

6.4 Limiting state
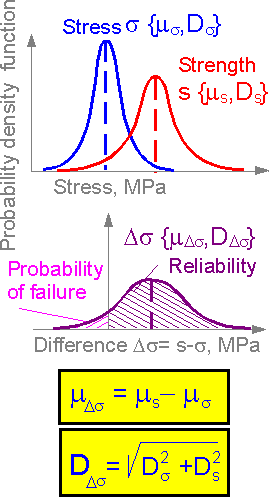 If
the probability density functions for strength and stress of a
structure are described by normal functions with known means mi and
standard deviation Di
the probability density function for difference in strength and
stress is also a normal distribution.
If
the probability density functions for strength and stress of a
structure are described by normal functions with known means mi and
standard deviation Di
the probability density function for difference in strength and
stress is also a normal distribution.
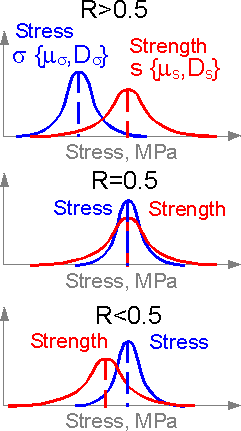 The
reliability is equal to 0.5 if the means of the distributions
coincide. It is larger than 0.5 if the mean for stress is smaller
than for strength.
The
reliability is equal to 0.5 if the means of the distributions
coincide. It is larger than 0.5 if the mean for stress is smaller
than for strength.
 The
summed area under a density function is equal to 1.
The
probability of failure is equal to the integral over the range where
both functions f(s) and F'(s) are nonzero.
The
summed area under a density function is equal to 1.
The
probability of failure is equal to the integral over the range where
both functions f(s) and F'(s) are nonzero.
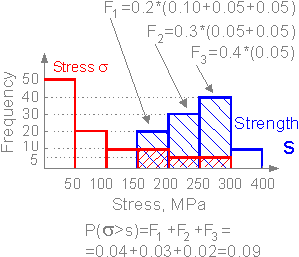 The
summation is over three intervals. The probability of failure of a
structure is 0.09 and its reliability is 0.91.
The
summation is over three intervals. The probability of failure of a
structure is 0.09 and its reliability is 0.91.
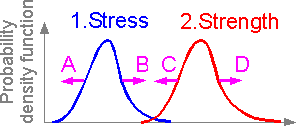 Engineering
changes can alter the positions of the probability density
functions.
A. Cross section area increase results in a
stress decrease.
B. Stress concentration results in a stress
increase.
C. Service in low temperatures results in brittle
fracture (strength decrease).
D. Heat treatment of welded joints
results in residual stress decrease (strength increase).
Engineering
changes can alter the positions of the probability density
functions.
A. Cross section area increase results in a
stress decrease.
B. Stress concentration results in a stress
increase.
C. Service in low temperatures results in brittle
fracture (strength decrease).
D. Heat treatment of welded joints
results in residual stress decrease (strength increase).
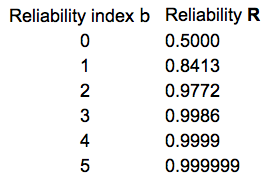
 The
reliability index is a measure of the reliability of a structure. The
minimum reliability index of structural components corresponds to the
reliability index of the whole structure. The smaller the reliability
index bi, the more probable the failure.
The
reliability index is a measure of the reliability of a structure. The
minimum reliability index of structural components corresponds to the
reliability index of the whole structure. The smaller the reliability
index bi, the more probable the failure.
6.5 Dispersion
 The
histogram shows how many specimens have strength in the corresponding
intervals. The experimental data and corresponding analytical
distributions can be characterized by mean value ms
and standard deviation Ds.
The standard deviation is expressed in terms of the same units of
measurement as the variable.
m
The
histogram shows how many specimens have strength in the corresponding
intervals. The experimental data and corresponding analytical
distributions can be characterized by mean value ms
and standard deviation Ds.
The standard deviation is expressed in terms of the same units of
measurement as the variable.
m
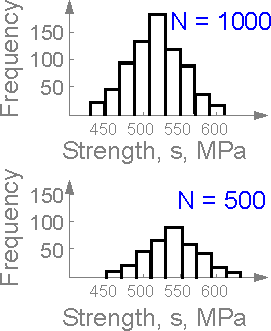 The
standard deviation does not depend on number of tests N if the number
is large. The shapes of the two histograms are similar.
The
standard deviations are approximately equal for both examples.
The
standard deviation does not depend on number of tests N if the number
is large. The shapes of the two histograms are similar.
The
standard deviations are approximately equal for both examples.
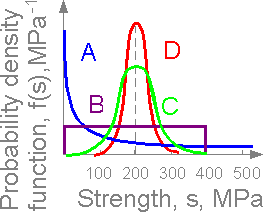 All
distributions (exponential A, uniform B, normal C and D) correspond
to the mean ms=200 MPa.
The areas under the curves are equal.
The larger part of the area is placed far from the mean, the
bigger standard deviation Ds:
All
distributions (exponential A, uniform B, normal C and D) correspond
to the mean ms=200 MPa.
The areas under the curves are equal.
The larger part of the area is placed far from the mean, the
bigger standard deviation Ds:
Ds(A) > Ds(B) > Ds(C) > Ds(D)
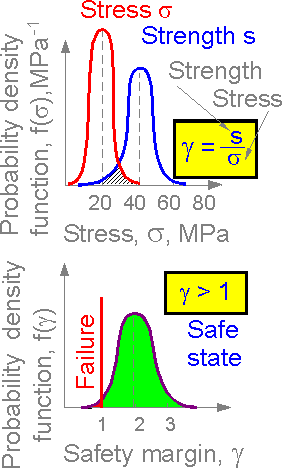 The
mean of the safety margin is equal to ratio of the means for strength
and stress:
mg = 40 / 20 = 2.0
There is probability
of failure for the structure
The
mean of the safety margin is equal to ratio of the means for strength
and stress:
mg = 40 / 20 = 2.0
There is probability
of failure for the structure
P(g) > 0 if g < 1 .
 The
reliability index helps to compare two variants. If the acting stress
is constant (s = 180 MPa) the reliability index depends on variation
parameters of strength. The bigger the reliability index, the bigger
the reliability of the structure.
The
reliability index helps to compare two variants. If the acting stress
is constant (s = 180 MPa) the reliability index depends on variation
parameters of strength. The bigger the reliability index, the bigger
the reliability of the structure.
 As
result of damage growth in a heat exchanger, the strength of the
material decreases by 10%. To keep the initial reliability the
engineers decrease the stress due to vapor pressure by 20% after 10
years of service. In this case the reliability index is equal for
both time t=0 and t=10 years.
t = 0 year : Dm = 200 - 100
= 100 MPa.
t = 10 years : Dm = 180 - 80 = 100 MPa.
As
result of damage growth in a heat exchanger, the strength of the
material decreases by 10%. To keep the initial reliability the
engineers decrease the stress due to vapor pressure by 20% after 10
years of service. In this case the reliability index is equal for
both time t=0 and t=10 years.
t = 0 year : Dm = 200 - 100
= 100 MPa.
t = 10 years : Dm = 180 - 80 = 100 MPa.
 A
carbon-fiber reinforced plastic element of an airplane has
microdamages, its rigidity and strength decrease with time. The
maximum stress increases due to smaller rigidity of the elements.
There is a correlation between stress and strength. The correlation
coefficient affects the reliability index of the structural elements.
The negative correlation coefficient decreases the reliability
index. Positive correlation coefficient between stress and strength
is preferential.
A
carbon-fiber reinforced plastic element of an airplane has
microdamages, its rigidity and strength decrease with time. The
maximum stress increases due to smaller rigidity of the elements.
There is a correlation between stress and strength. The correlation
coefficient affects the reliability index of the structural elements.
The negative correlation coefficient decreases the reliability
index. Positive correlation coefficient between stress and strength
is preferential.