
- •Главная
- •1.1 Напряжений и концентраторы
- •1.1.3 Концентраторы напряжения
- •1.3 Stress concentration factor
- •1.7 Elastic-plastic stress concentration
- •1.8 Joints: bolts and welds
- •3. Механические свойства конструкционных материалов
- •3.1 Напряженности испытания
- •3.2 Stress - strain diagram
- •3.3 Testing schemes
- •3.4 Strength
- •4 Прочность материалов
- •4.1 Tension and compression
- •4.2 Shear and torsion
- •4.3 Stress-strain state
- •4.4 Bending: force and moment diagrams
- •4.5 Geometrical characteristics of sections
- •4.6 Bending: stress and deformation
- •4.7 Mixed mode loading
- •4.8 Buckling
- •4.9 Statically indeterminate systems
- •4.10 Three-dimensional structures
- •References
- •5. Theory of elasticity
- •5.1 Deformation
- •5.2 Stress
- •5.3 Hooke's law
- •5.4 Plane problems
- •5.5 Torsion
- •5.6 Bending
- •5.7 Polar coordinates
- •5.8 Plates
- •5.9 Shells
- •5.10 Contact stresses
- •6.2 Distribution functions
- •6.3 Structural models of reliability
- •6.4 Limiting state
- •6.5 Dispersion
- •6.6 Durabilty
- •6.7 Design by reliability criterion
- •6.8 Risk
- •6.9 Safety classes
- •6.10 Risk : structural and social
- •References
- •7 Materials science
- •7.1 Crystalline solids
- •7.2 Mechanical properties
- •7.3 Failure
- •7.4 Phase diagrams
- •7.5 Heat treatment of metals and alloys
- •7.6 Corrosion of metals and alloys
- •7.7 Casting
- •7.8 Polymers
- •7.9 Composites
- •7.10 Forming of metals
- •8.2 Mechanical properties
- •8.3 Stress concentration
- •8.4 Defects
- •8.5 Residual Stress
- •8.6 Strength
- •8.7 Fatigue strength
- •8.8 Fracture
- •8.9 Weldability
- •References
- •9 Composites
- •9.1 Structure of composites
- •9.2 Fibers
- •9.3 Rigidity
- •9.4 Strength
- •9.5 Crack resistance
- •9.6 Optimization
- •9.7 Fatigue and temperature effect
- •9.8 Reliability
- •9.9 Joints
- •9.10 Material selection
- •References
- •10 Finite element analysis
- •10.1 Finite element method
- •10.2 Finite elements
- •10.3 Meshing
- •10.4 Boundary conditions
- •10.5 Deformation
- •10.6 Accuracy
- •10.7 Heat transfer analysis
- •10.8 Dynamics
- •10.9 Computational fluid dynamics
- •10.10 Design analysis
- •References
5.9 Shells
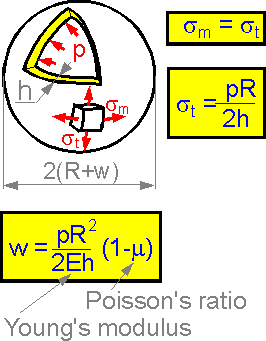 The
tangential stress is equal to meridian stress for spherical shells.
Radial displacement (radius increase) is directly proportional to the
inner pressure and R2.
The bigger the Young's modulus of the material, the smaller the
displacement.
The
tangential stress is equal to meridian stress for spherical shells.
Radial displacement (radius increase) is directly proportional to the
inner pressure and R2.
The bigger the Young's modulus of the material, the smaller the
displacement.
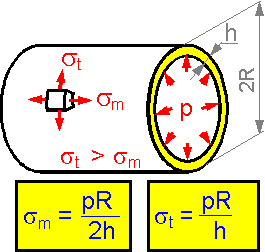 The
tangential stress for a cylindrical pressure vessel is twice as large
as the meridian stress.
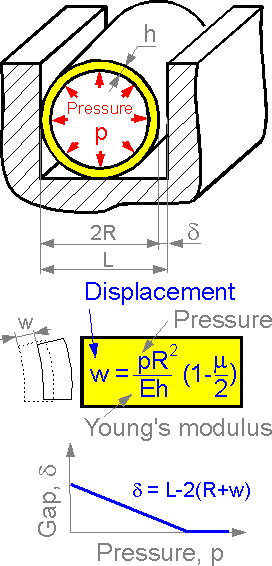 The
radial displacement is proportional to pressure. The bigger the
displacement, the smaller the gap between the cylindrical vessel and
the wall. There is a pressure when the gap is zero.
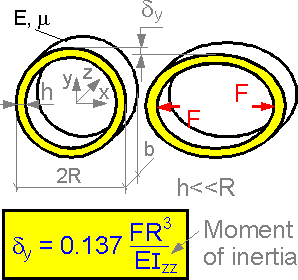 Tension
in the X-direction results in deformation in the vertical direction.
This theory gives the formula for calculation of the displacement
dy.
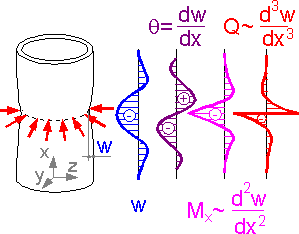 A
cylindrical shell is compressed. The figure shows patterns of
deflection w, angle of rotation q, bending moment M and transverse
force Q.
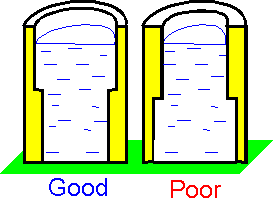 The
bending moment and bending stress are at a maximum at the bottom of
the tank. The most effective use of material utilizes thicker parts
at the bottom.
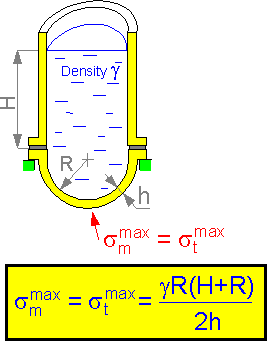 The
tangential and radial stresses are at a maximum in the bottom of the
water tank. There is a quadratic dependence of the stress on the
radius of the half-sphere R.
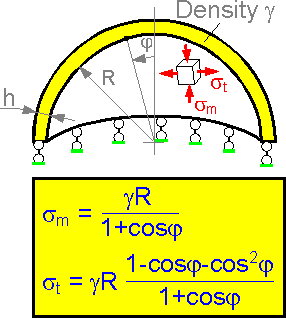 If
a spherical dome accepts its own weight, the increase in thickness h
results in an increase of the shell weight and its bending rigidity.
The two factors compensate for each other. Therefore, maximum stress
does not depend on thickness of the shell.
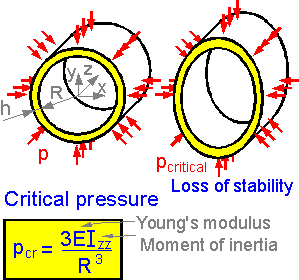 A
thin-walled cylindrical ring can lose its shape due to a pressure
increase. The more rigid the material, the bigger the critical
stress. Critical pressure is proportional to Young's modulus E.
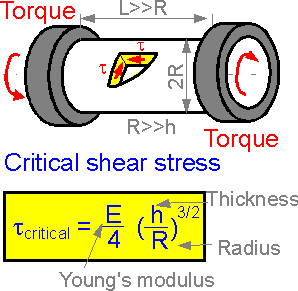 A
thin wall cylindrical shell can lose stability at shear stress
tcritical.
Geometrical parameters have different effects on the critical stress.
Length L has no effect on the critical stress tcritical.
The bigger the radius R, the smaller the stress. The bigger the
thickness h, the bigger the critical stress tcritical.
5.10 Contact stresses
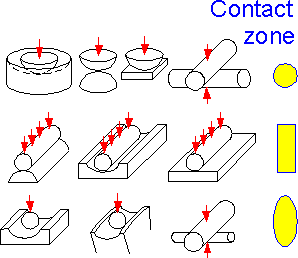 The
shape of the contact area between two elastic bodies is usually
circular, elliptical or rectangular. This is valid for ideal elastic
bodies.
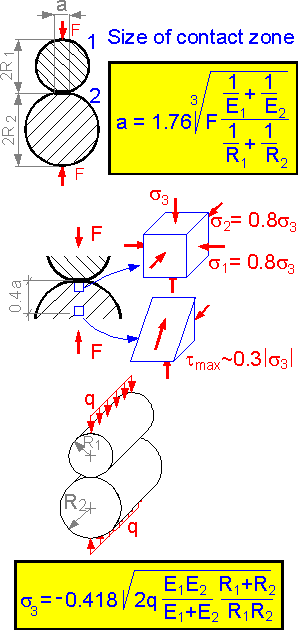 The
size of the contact area depends on the modulus of elasticity of the
balls, their radii and the compressive force F. It is proportional to
F1/3.
Absolute value of the contact normal stress s3
is at a maximum at the contact surface. The two other components are
80% of s3.
Maximum shear stress acts inside the ball at 0.4a from the
surface.
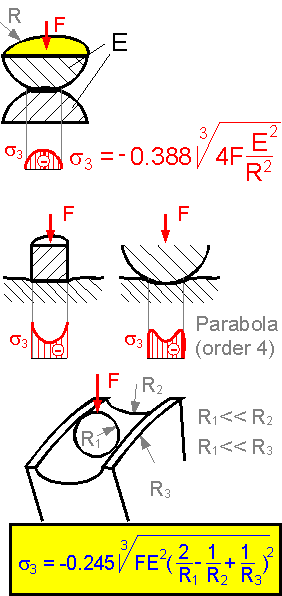 For
compression of two balls the contact stress is at a maximum in the
center of the contact spot. The stress decreases to zero at the edges
of the contact region. For the two other loading situations, the
stress is not the highest in the center.
The theory of
elasticity predicts the maximum contact stress for ball bearings. The
smaller contact stress, the better. The smaller the modulus of
elasticity E, the smaller the contact stress. The hardness, not the
contact stress, is more important in choosing the material for ball
bearings.
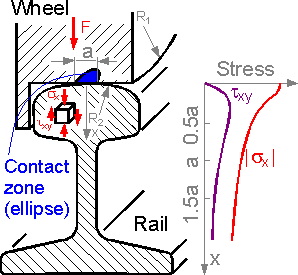 Shear
stress in a rail is approximately equal to zero at the surface (z=0)
and is at a maximum at a distance 0.45a from the contact zone, where
a is size of contact region.
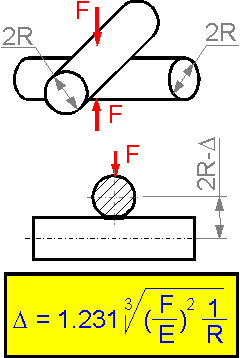 The
distance between the centers of the cylinders decreases with an
increase in force. There is no linear dependence for the elastic
displacement D.
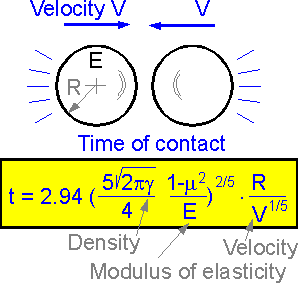 Time
of contact for impact between two steel balls in a ball mill is
proportional to the radius of the balls R. Increase in the modulus of
elasticity or in velocity decreases the time of contact.
The
bigger the size of the balls the longer the time of contact.
REFERENCES
S.P. Timoshenko, J.N. Goodier Theory of Elasticity, McGraw-Hill, N. Y., 1970.
S.P. Timoshenko, S. Woinowsky-Krieger Theory of Plates and Shells, McGraw-Hill, N. Y., 1959.
THEMES
Theme 1. Stress Concentration Theme 2. Fracure Mechanics Theme 3. Mechanical Properties Theme 4. Strength of Materials Theme 5. Theory of Elasticity Theme 6. Structural Safety Theme 7. Material Science Theme 8. Welds Theme 9.Composite Materials Theme 10. Finite Element Analysis
6. STRUCTURAL SAFETY
Igor Kokcharov and Anatolii Lepikhin
6.1 RELIABILITY
Dependability
is the ability of a structure to maintain its working parameters in
given ranges for a stated period of time. Dependability is a
collective term used to describe the availability performance and its
influencing factors: reliability performance, maintainability
performance and maintenance-support performance. Dependability is
used only for general descriptions in non-quantitative terms.
Maintainability is a measure of the ease and rapidity
with which a system can be restored to operational status following a
failure.
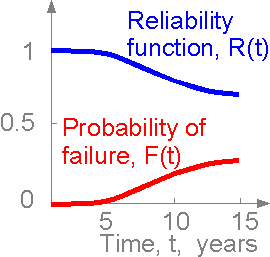 Reliability
is the probability of component or system success under stated
conditions for a stated period of time. Time to the moment when the
structure fails is not exactly known. The time is a random variable.
Reliability is characterized by the reliability function R(t):
Reliability
is the probability of component or system success under stated
conditions for a stated period of time. Time to the moment when the
structure fails is not exactly known. The time is a random variable.
Reliability is characterized by the reliability function R(t):
R(t) = P{t > t}
where P is the probability that the operating time to failure t exceeds the stated period of time t. Probabilities are numbers between 0 and 1. The reliability function is related to the probability of failure function F(t) and its density function f(t):
F(t) = 1 - R(t) ; f(t) = d F(t) / dt = - d R(t) / dt;
The
domain of the cumulative distribution function F(t) is from zero to
infinity, while its range is the interval [0 ... 1].
 Failure
rate l(t) is an important parameter of reliability.
Every
random variable has its associated cumulative distribution function.
The cumulative distribution function F(t) is increasing (accumulating
probability) as t increases.
If the failure rate is
constant (exponential law of reliability) the dependence between
failure rate and reliability function can be
simplified.
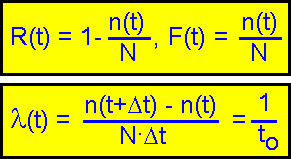 Statistical
estimators of the function can be obtained by the following
expressions.
Here:
n(t) - number of failed elements
to time t.
N - total number of elements.
to - mean time to
failure.
 There
is some standard behavior of the dependence curve of failure rate l
versus time t:
1. failures due to manufacturing defects (cracks,
inappropriate materials, poor design)
2. failures due to
conditions of service (exploitation errors)
3. failures due to
accumulated damage (wear and fatigue)
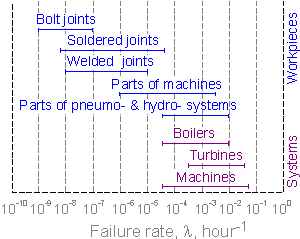 The
figure shows typical ranges of failure rate for different engineering
systems. The parameter changes over a wide range.
