


TOXICOKINETICS 105
Assuming at equilibrium that unbound concentration in tissue and plasma are equal, then we let the ratio of fu/fuT replace CT W /C and determine the volume of distribution as follows:
Vd = Vp + VT W × |
fuT . |
|
|
|
fu |
It is possible to predict what happens to Vd |
when fu or fuT changes as a result |
|
of physiological or disease processes in the body that change plasma and/or tissue protein concentrations. For example, Vd can increase with increased unbound toxicant in plasma or with a decrease in unbound toxicant tissue concentrations. The preceding equation explains why: because of both plasma and tissue binding, some Vd values rarely correspond to a real volume such as plasma volume, extracellular space, or total body water. Finally interspecies differences in Vd values can be due to differences in body composition of body fat and protein, organ size, and blood flow as alluded to earlier in this section. The reader should also be aware that in addition to Vd , there are volumes of distribution that can be obtained from pharmacokinetic analysis of a given data set. These include the volume of distribution at steady state (Vd,ss), volume of the central compartment (Vc), and the volume of distribution that is operative over the elimination phase (Vd,area). The reader is advised to consult other relevant texts for a more detailed description of these parameters and when it is appropriate to use these parameters.
6.7 TOXICOKINETICS
The explanation of the pharmacokinetics or toxicokinetics involved in absorption, distribution, and elimination processes is a highly specialized branch of toxicology, and is beyond the scope of this chapter. However, here we introduce a few basic concepts that are related to the several transport rate processes that we described earlier in this chapter. Toxicokinetics is an extension of pharmacokinetics in that these studies are conducted at higher doses than pharmacokinetic studies and the principles of pharmacokinetics are applied to xenobiotics. In addition these studies are essential to provide information on the fate of the xenobiotic following exposure by a define route. This information is essential if one is to adequately interpret the dose-response relationship in the risk assessment process. In recent years these toxicokinetic data from laboratory animals have started to be utilized in physiologically based pharmacokinetic (PBPK) models to help extrapolations to low-dose exposures in humans. The ultimate aim in all of these analyses is to provide an estimate of tissue concentrations at the target site associated with the toxicity.
Immediately on entering the body, a chemical begins changing location, concentration, or chemical identity. It may be transported independently by several components of the circulatory system, absorbed by various tissues, or stored; the chemical may effect an action, be detoxified, or be activated; the parent compound or its metabolite(s) may react with body constituents, be stored, or be eliminated—to name some of the more important actions. Each of these processes may be described by rate constants similar to those described earlier in our discussion of first-order rate processes that are associated with toxicant absorption, distribution, and elimination and occur
106 ABSORPTION AND DISTRIBUTION OF TOXICANTS
Exposure
Absorption at Portals of Entry
Distribution to Body |
|
|
Excretion |
|
Metabolism to |
Metabolism to |
Metabolism to |
More Toxic |
Less Toxic |
Conjugation |
Metabolites |
Metabolites |
Products |
|
Distribution |
|
Interaction with Macromolecules
(Proteins, DNA, RNA, Receptors,etc)  Turnover and Repair
Toxic Effects
(Genetic, Carcinogenic, Reproductive, Immunologic, etc)
Figure 6.11 Sequence of events following exposure of an animal to exogenous chemicals.
simultaneously. Thus at no time is the situation stable but is constantly changing as indicated in Figure 6.11.
It should be noted, however, that as the toxicant is being absorbed and distributed throughout the body, it is being simultaneously eliminated by various metabolism and/or excretion mechanisms, as will be discussed in more detail in the following chapters. However, one should mention here that an important pharmacokinetic parameter known as clearance (C ) can be used to quantitatively assess elimination of a toxicant. Clearance is defined as the rate of toxicant excreted relative to its plasma concentration, Cp :
C = Rate of toxicant excretion . Cp
The rate of excretion is really the administered dose times the fractional elimination rate constant Kel described earlier. Therefore we can express the preceding equation in terms of Kel and administered dose as volume of distribution, Vd :
C = Kel · Dose = Kel · (Vd · Cp )/Cp = Kel · Vd .
Cp
In physiological terms we can also define clearance as the volume of blood cleared of the toxicant by an organ or body per unit time. Therefore, as the equations above indicate, the body clearance of a toxicant is expressed in units of volume per unit time (e.g., L/h), and can be derived if we know the volume of distribution of the toxicant

TOXICOKINETICS 107
and fractional rate constant. In many instances this can only be derived by appropriate pharmacokinetic analysis of a given data set following blood or urine sample collection and appropriate chemical analyses to determine toxicant concentrations in either of these biological matrices.
Each of the processes discussed thus far—absorption, distribution, and elimina- tion—can be described as a rate process. In general, the process is assumed to be first order in that the rate of transfer at any time is proportional to the amount of drug in the body at that time. Recall that the rate of transport (dC/dt) is proportional to toxicant concentration (C) or stated mathematically:
dC = KC, dt
where K is the rate constant (fraction per unit time). Many pharmacokinetic analyses of a chemical are based primarily on toxicant concentrations in blood or urine samples. It is often assumed in these analyses that the rate of change of toxicant concentration in blood reflects quantitatively the change in toxicant concentration throughout the body (first-order principles). Because of the elimination/clearance process, which also assumed to be a first-order rate process, the preceding rate equation now needs a negative sign. This is really a decaying process that is observed as a decline of toxicant concentration in blood or urine after intravenous (IV) administration. The IV route is preferred in these initial analyses because there is no absorption phase, but only chemical depletion phase. However, one cannot measure infinitesimal change of C or time, t; therefore there needs to be integration after rearrangement of the equation
above: |
−C |
= kdt becomes |
−C |
= k |
dt, |
|
|
dC |
|
|
dC |
|
|
|
|
|
|
|
|
|
which can be expressed as
C = C0e−kt ,
where e is the base of the natural logarithm. We can remove e by taking the ln of both sides:
ln Ct = ln C0 − kt.
Note that K is the slope of the straight line for a semilog plot of toxicant concentration versus time (Figure 6.12). In the preceding equation it is the elimination rate constant that is related to the half-life of the toxicant described earlier in this chapter. The derived C0 can be used to calculate the volume of distribution (Vd ) of the toxicant
as follows:
Dose
Vd = C0 .
However, toxicokinetic data for many toxicants do not always provide a straight line when plotted as described above. More complicated equations with more than one exponential term with rate constants may be necessary to mathematically describe the concentration-time profile. These numerous rate constants are indicative of chemical transport between various compartments in the body and not only to a single central compartment as suggested in the simple equation and semilog plot described in
108 ABSORPTION AND DISTRIBUTION OF TOXICANTS
Cp0 |
|
Slope = −Kel |
↓Ka |
p |
|
lnC |
Central |
|
|
|
Kel |
Time |
|
(a) |
(b) |
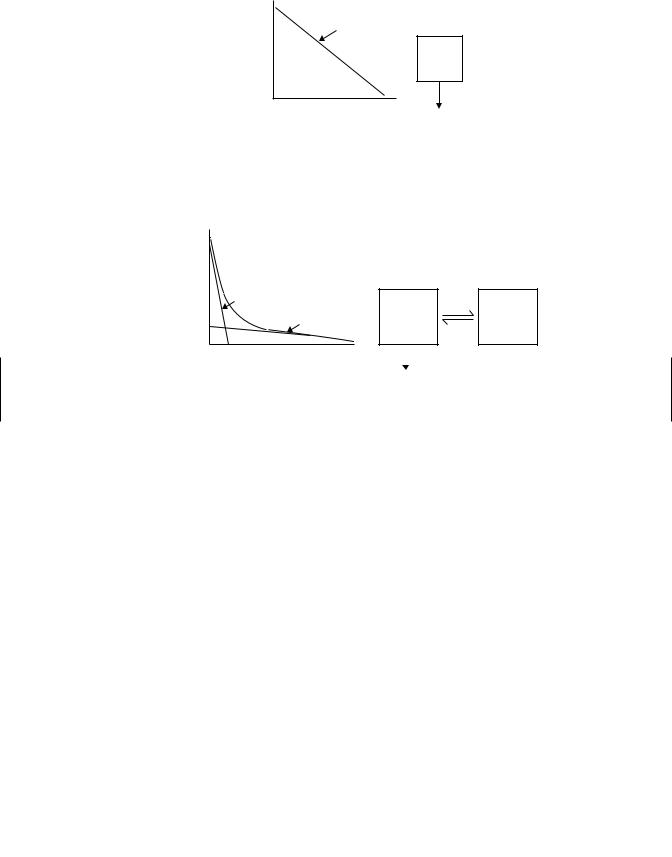
Figure 6.12 (a) Semilog plot of plasma concentration (Cp ) versus time. Cp 0 is the intercept on the y-axis, and Kel is the elimination rate constant. (b) Single compartment model with rate constants for absorption, Ka and for elimination, Kel.
Cp0 |
|
|
|
|
|
|
|
|
|
|
|
|
|
A1 = A |
|
|
|
|
|
|
p |
|
|
|
|
|
|
lnC |
|
a = l1 |
|
|
K12 |
|
|
|
b = l2 |
Central |
Peripheral |
||
A2 = B |
|
(1) |
K21 |
(2) |
||
|
|
|
|
|
||
|
|
Time |
|
Kel = K10 |
|
|
|
|
(a) |
|
|
|
(b) |
Figure 6.13 (a) Semilog plot of plasma concentration for (Cp ) versus time representative of a two-compartment model. The curve can be broken down into an α or λ1 distribution phase and β or λ2 elimination phase. (b) Two-compartment model with transfer rate constants, K12 and K21, and elimination rate constant, Kel.
Figure 6.12. In some instances the data may fit to a bi-exponential concentration-time profile (Figure 6.13). The equation to describe this model is
C = Ae−αt + Be−βt .
In other instances, complex profiles may require a threeor multi-exponential concentration-time profile (Figure 6.14). The equation to describe the three-profile
case is
C = Ae−αt + Be−βt + Ce−γ t .
In the physiological sense, one can divide the body into “compartments” that represent discrete parts of the whole-blood, liver, urine, and so on, or use a mathematical model describing the process as a composite that pools together parts of tissues involved in distribution and bioactivation. Usually pharmacokinetic compartments have no anatomical or physiological identity; they represent all locations within the body that have similar characteristics relative to the transport rates of the particular toxicant. Simple first-order kinetics is usually accepted to describe individual