

Micro-Nano Technology for Genomics and Proteomics BioMEMs - Ozkan
.pdfELECTRONIC MICROARRAY TECHNOLOGY AND APPLICATIONS |
11 |
TABLE 1.2. Examples of Nanochip R technology application in genomics.
Relevance |
Test |
Ref |
|
|
|
Cystic Fibrosis |
CFTR |
http://www.nanogen.com/products/cystic fibrosis.htm |
Thrombosis |
Factor V Leiden |
[41] |
|
Factor II (prothrombin) |
[15] |
|
MTHFR |
[14] |
|
Factor V/Prothrombin |
http://www.nanogen.com/products/Factor vII.htm |
Hereditary |
HFE |
http://www.nanogen.com/products/HH.htm |
Hemochromatosis |
|
|
Alzheimer’s Disease |
ApoE |
http://www.nanogen.com/products/apoe.htm |
|
|
http://biz.yahoo.com/prnews/040106/latu005 1.html |
β-thalassemia |
Factor VII |
[39] |
Asthma and chronic |
B(2)-adrenergic receptor |
[53] |
obstructive |
|
|
pulmonary disease |
|
|
Ulcerative colitis |
N-acetyltransferase 1 (NAT 1) |
[38] |
|
N-acetyltransferase 2 (NAT 2) |
|
Cancer |
p53 |
[3] |
Rett syndrome |
MeCP2 |
[47] |
Immunologic defect |
Mannose binding protein |
[19] |
|
(MBP) |
|
Parkinson’s discease |
CYP1A2/CYP2E1 |
[10] |
Cytokine |
Tumor necrosis factor-α |
[43] |
|
(TNF-α) |
|
|
IL-4 |
|
|
Interferon-γ (CA)n repeats |
|
|
IL-1 RN VNTR |
|
|
CCR5 |
|
Bacterial ID |
Staphylococcus aureus pol C |
[9] |
|
Escherichia coli gyrA |
[50] |
|
Salmonella gyrA |
|
|
Campylobacter gyrA |
|
|
E. coli parC |
|
|
Staphylococcus mecA |
|
|
|
|
typical STR loci are selected groups of four nucleotide repeats that are represented in the human population by 4-15 alleles distinguished by a different number of repeat units [8]. Unlike SNPs, STRs are more difficult to analyze by conversional passive hybridization techniques [20, 34]. However, electronic hybridization techniques have been proven to overcome these problems and allow STR analysis to be performed on electronic microarray in a rapid and high fidelity fashion [37]. Multiplex hybridization analysis of three STR loci (CSF1PO, TH01 and TPOX) was achieved for 12 individuals, 100% concordant with genotyping results of an accredited forensic laboratory.
Given the recent discovery of abundance SNPs and the ease of automation and miniaturization of detection techniques, SNP assays have started to be implemented in DNA forensic analysis. According to Chakraboty et al. [6], somewhere in the range of 30-60 SNP loci would be needed to equal the power of the 13 STR loci with regard to genotypic match probability and/or paternity exclusion. The flexibility of electronic microarray will permit accelerated development of SNPs for DNA forensic analysis by allowing an easy
12 |
YING HUANG ET AL. |
Capture Only
TNFα
IL6
Jun
Osteopontin
β-Throm
IL1
COX2
HMG-17
Actin
differentiated Non
Differentiation + treatment
|
5h |
1h |
3h |
6h |
O/N |
|
0 |
||||
0 . |
|
|
|
|
|
T |
|
|
|
|
|
Capture Only
d e t a i t n e r e f f i d
n o N
Differentiation + treatment
|
h |
|
|
|
N |
|
5 |
h |
h |
h |
/ |
0 . |
O |
||||
T |
0 |
1 |
3 |
6 |
|
|
|
|
|
|
|
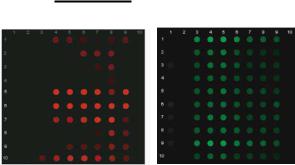
Cy5 image for test genes |
Cy3 image for the reference gene |
FIGURE 1.7. Multiplexed gene expression profiling on the electronic microarray. Ten target genes plus the β-la reference gene from the U937 cell lines at various time points after differentiation and LPS treatment. The genes were electronically hybridized to target-specific capture probes and to the β-la capture probe. The left panel represents the Cy5 fluorescent signals from the 10 target genes, whereas the right panel shows the Cy3 signal corresponding to the β-la reference gene. Each target gene exhibits a distinct expression pattern over the time course of LPS treatment, while the β-la reference gene remains relatively unchanged. Reprinted with permission from Weidenhhammer et al. Copyright [49] American Association for Clinical Chemistry.
method of adapting new loci. Currently, supported by government funding, assays are under development to detect 35 SNPs and 6 STRs on a single electronic microarray.
1.3.3. Gene Expression Profiling
Another array-based method in genomic studies is to simultaneously monitor global gene expression profiling of cells under a condition of interest and to identify a set of gene markers for specific disease [1]. Towards this trend, a multiplex, targeted gene expression profiling method has been developed using electronic field-facilitated hybridization on Nanochip R electronic microaray [49]. In this method, target mRNA generated from T7 RNA polymerase-mediated amplification were detected by hybridization to sequence-specific capture oligonucleotides on electronic microarray. The expression of a model set of 10 target genes in the U937 cell line was analyzed during lipopolysaccharide-mediated differentiation with 2-fold changes in concentration and 64-fold range of concentration (Figure 1.7). This electronic array based expression analyzing method allows simultaneous assessment of target concentrations from multiple sample sources.
1.3.4. Cell Separation
In addition to dc current, ac voltage can also be applied to the electronic microarray in certain ways to create a dielectrophoretic (DEP) force applicable to analytes such as cells. Depending on the frequency of the ac voltage and the dielectric properties of the cells, the DEP forces can be either positive (moving cells towards electrodes) or negative (moving
ELECTRONIC MICROARRAY TECHNOLOGY AND APPLICATIONS |
13 |
(a) |
(b) |
|
IL-1 TNF-α TGF-β |
|
|
|
No target control |
|
U937/PBMC -LPS- |
|
U937/PBMC -LPS+ |
|
Post-DEP U937 LPS- |
|
Post-DEP U937 LPS+ |
(c) |
(d) |
|
U937 LPS- |
|
U937 LPS+ |
|
PBMC |
|
(e) |
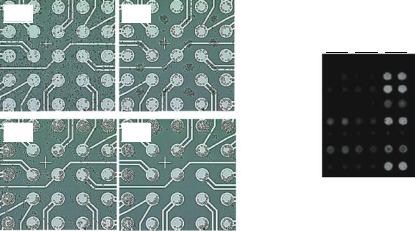
FIGURE 1.8. The procedure of DEP separation for U937 and PBMC mixture and gene expression profiling of three genes for U937 cells before and after DEP separation on electronic microarrays. (a) Mixture is introduced to the microarray. (b) U937 cells are separated from PBMC on array by dielectrophoresis 5 min after an ac voltage is applied. U937 cells are collected on the electrodes and PBMC are accumulated at the space between the electrodes. (c) Buffer is introduced from the reservoir to the array by fluid flow while the voltage is kept on. PBMC are carried away with the fluid stream. (d) PBMC are washed off from the array and U937 cells are retained on the electrodes after 10 min of washing. (e) Fluorescent image of three genes expression profiling before and after DEP separation. The specific signals for IL-1, TNF-α, and TGF-β from different samples after electronic hybridization are indicated. Reprinted with permission from Huang et al. Copyright (2002) American Chemical Society.
cells towards spaces) resulting in special separation of different types of cells on electronic microarrays [8, 26]. Using DEP, U937 and PBMC were separated on the array [22]. The separation procedure is illustrated in Figure 1.8. After the mixture was introduced to the array, the flow was stopped (Figure 1.8a). Five minutes after an ac voltage of 500 kHz, 7 Vpp (volts, peak to peak) was applied to the array, U937 cells were separated from PBMC on chip (Figure 1.8b). Then by introducing the fluidic flow of 40 µl/min and keeping on the voltage, only PBMC were washed away with the buffer (Figure 1.8c). Ten minutes after washing, only U937 cells were remained on the electrodes by positive dielectrophoresis (Figure 1.8d). These U937 cells could then be released from the electrodes by fluidic flow and subsequently collected for gene expression analysis if the applied voltage was turned off.
RNA from DEP separated U937 cells was extracted, and the expression levels of IL-1, TNF-α, and TGF-β were quantitatively monitored on a 10 × 10 microelectronic chip array using a targeted gene expression profiling assay. The gene expression levels of IL-1, TNF-α, and TGF-β for LPS treated or untreated U937 cells were compared with those of U937 and PBMC mixture on a 10 × 10 array before and after DEP separation (Figure 1.8e). As demonstrated in Figure 1.8e, upon LPS treatment, U937 cells exhibited a significant increase in expression levels of IL-1, TNF-α, and TGF-β. After mixing U937 cells with PBMC at 1:5 ratio (U937 cells to PBMC), the expression patterns of the three genes had changed. In the mixed sample, the LPS induction of IL-1 and TNF-α expression could not be detected, and the induction of TGF-β was decreased. This reduction of the TGF-β
14 |
YING HUANG ET AL. |
expression level in the mixed samples was most likely due to the high expression level of TGF-β gene in PBMC. Apparently, in heterogeneous samples, the gene expression levels in a cell population of interest are not simply diluted by unrelated cells but are masked by the expression patterns of the contaminating cell populations. Notably, in the DEP separated U937 cells, the LPS induction of IL-1, TNF-α, and TGF-β expression was observed. This result indicates that DEP separation can improve the accuracy of gene expression profiling by purifying out cells of interest.
1.3.5. Electronic Immunoassays
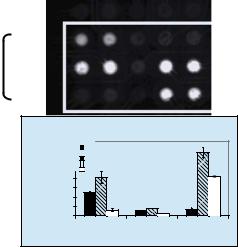
The flexibility of the microarray platform in terms of the ability to electrophoretically transport charged molecules to any site on the planar surface of the array has been exploited for developing electronic immunoassays. The following is an example of an electric fielddriven immunoassay developed for two biological toxins—Staphylococcal enterotoxin B (SEB) and Cholera toxin B (CTB) for biological warefare applications [16]. A 25-site electronic microarray (Figure 1.9) was transformed into an immunoassay array by electronically biasing electrodes at user defined microlocation to direct the transport, concentration, and binding of biotinylated monoclonal capture antibodies specific for SEB and CTB to streptavidin in the hydrogel layer. The detection of fl-SEB and fl-CTB were accomplished in only 6 minutes, including 1-minute electronic addressing step to bind fl-SEB and fl-CTB, followed by a 5-minute washing step to reduce nonspecific binding. More noticeably, electronic addressing permitted the detection of CTB down to concentrations of 18 nM. No fluorescence
α-SEB β-CTB
SEB
Analyte Mixture
CTB
Fluorescence Intensity |
|
8000 |
SEB |
|
|
(relative units) |
7000 |
|
|
||
Mixture |
|
|
|||
6000 |
|
|
|||
5000 |
CTB |
|
|
||
4000 |
|
|
|
||
3000 |
|
|
|
||
2000 |
|
|
|
||
1000 |
|
|
|
||
0 |
|
|
|
||
|
|
|
|
|
|
|
|
|
anti-SEB |
none |
anti-CTB |
Capture Antibody
FIGURE 1.9. Electronic assay for fl-SEB and fl-CTB on the 10,000 site CMOS array. Biotinylated anti-SEB capture antibody was electronically addressed to the microlocations in the two columns on the left side of the image. Biotinylated anti-CTB capture antibody was electronically addressed to each of the microlocations in the two columns on the right side of the image. The column of microlocations in the center was left free. A mixture of fl-SEB and fl-CTB (20 nM in 50 mM histidine, pH 7.5) was applied to the chip and electronically addressed to all 15 microlocations of the chip. After washing, the fluorescence intensity at each microlocation was measured.
ELECTRONIC MICROARRAY TECHNOLOGY AND APPLICATIONS |
15 |
1600-site chip |
DEP chip |
(flip-chip bonded to the layer #1) |
(flip-chip bonded to the layer #5) |
1. Patterned Kapton®
2. Double-sided PSA
3. PMMA film
4. Double-sided PSA
5. Patterned Kapton®
DEP chip and step electrodes |
Via hole and step electrodes |
in the upper level |
in the upper level |
Step electrodes in the lower level
3”
3”
1600-site chip
in the lower level
TOP VIEW
electric contacts
6. Double-sided PSA
 DEP chip
7. Glass cover plate
Fluidic inlet/outlet |
1600-site chip |
BOTTOM VIEW
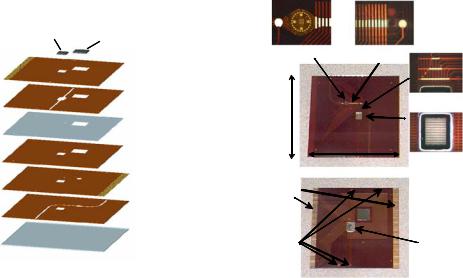
FIGURE 1.10. The stacked microlaboratory : (left) Fabrication of the stacked structure; (right) Photographs of the completed stacked structure showing the top and the bottom views.
attributable to antigen binding was observed at any other location on the chip other than the sites addressed with the appropriate capture antibody. It was possible to detect both toxins from a mixture in a single electronic addressing step (Figure 1.10). The ability to perform a rapid, electric field-mediated immunoassay for multiple analytes provides an advantage over existing approaches in terms of sample volume, speed and system complexity.
1.3.6. Miniaturization of Electronic Microarray Technology and Applications
DNA microarray technology provides a highly specific analytical response that enables the identification of a particular sequence within the DNA target molecules. Using these characteristic sequences the identification of biological agents, including biological warfare agents and infectious disease pathogens can be performed with the highest specificity and accuracy. It is of emergent interest to make portable instruments capable of performing rapid DNA analysis in the field or in hospitals. Such trends call for the development of the so-called point-of-care or field-portable instruments which could be used immediately at the patient bed or by first responders in the case of biological attacks. The requirements for such instrumentation are very stringent including high sensitivity and specificity, simultaneous detection of multiple targets, automated operation, and ease of use. Encountering various types of samples in the field, there is an urgent need to integrate the sample preparation processes with the detection and create simple to operate field portable sample-to-answer instruments [2]. Using the basic principles of the electronic separation and addressing of the targets we have developed a number of different approaches to miniaturize detection
16 |
YING HUANG ET AL. |
systems as well as the integration of sample preparation with detection on the electronic microarray.
1.3.6.1. Stacked Microlaboratory A sample-to-answer prototype instrument was developed to perform pathogen isolation [28], DNA hybridization and protein immunoassays from mixed samples [52]. At the core of this instrument is a small two-level-stacked microlaboratory that is 76 × 76 mm2 and 2.77 mm thick. The stacked microfluidic structure was constructed from a set of laminated flexible substrates with fluidic cutouts, pressure sensitive adhesive layers, electrode arrays, and two Si chips. The completed stacked structure has the DEP chip in the upper level chamber for dielectrophoretic collection of bioparticles and the 1600-site chip in the lower level for performing automated electric-field-driven assays (Figure 1.10). Various automated assays have been demonstrated on this instrument. E. coli bacteria and Alexa-labeled protein toxin SEB were detected by electronic immunoassay. The identification of SLT1 gene from E. coli was accomplished in 2.5 hours starting from a dielectrophoretic concentration of intact E. coli bacteria and finishing with an electronic DNA hybridization assay [52].
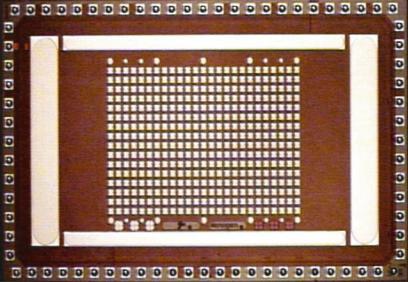
1.3.6.2. Miniaturized Electronic Microarray System Rapid identification of pathogens or biological agents, including biological warfare agents, would ideally incorporate small automated portable systems. Supported through Department of Defense funding, a simple miniaturized system for the detection of DNA targets from pathogenic microorganisms based on the electronic microarray technology was developed. The first generation of the instrument is an automated portable DNA analysis system designed to operate with the Nanogen’s 400-site NanoChip R array and cartridge. The 400-site array (Figure 1.11) is a
FIGURE 1.11. Photogoraph of a CMOS 400-site chip. Counter electrodes surround the central 400-site working electrode array.
ELECTRONIC MICROARRAY TECHNOLOGY AND APPLICATIONS |
17 |
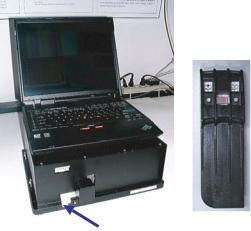
Cartridge loading Port |
400-site ACV-chip and cartridge |
|
FIGURE 1.12. Photograph of the electronic microarray system with the laptop used to operate the instrument and perform data storage and processing. The arrow indicates a port for the 400-site cartridge introduction.
second generation CMOS chip developed at Nanogen [46]. The advantages of the CMOS chip over the first generation design include simple control circuitry, improved electrode current and voltage control, four times as many assay sites and on-chip temperature sensing. The CMOS chip has an array of 16 × 25 (400-sites); each electrode being 50 µm in diameter with a 150-µm center-to-center distance. Voltage on each electrode can be individually controlled and measured. Furthermore, a temperature sensor is built into the chip’s CMOS circuitry.
A photograph of the Nanogen’s portable electronic microarray detection instrument is shown in Figure 1.12. It is a compact, fully enclosed instrument featuring automated DNA sample and reagent delivery to the chip, temperature control of the chip and the fluidic cell, electronic control of the chip array, and optical detection system. Any standard laptop or desktop computer can be used to operate and control the system. The overall dimensions of the system are (not including laptop) ca. 14 inch × 12 inch by 6 inch. The total weight including the laptop which provide automated control of the system and data acquisition, ca. 30 lbs.
The portable instrument and electronic microarray platform allows development of a number of assays which can support PCR amplification of the target DNA from the sample, as well as solution strand displacement amplification (SDA) and anchored SDA. Anchored SDA provides an extremely convenient way to integrate the sample preparation steps. In this arrangement, the DNA amplification step and fluorescent detection steps are performed on the microarray chip. Highly sensitive assays were developed for detection of typical biological warfare agents such as anthrax and vaccinia. A number of other assays for viral and bacterial DNA identification, e.g., including Staphylococcus enterotoxin a (SEA) and b (SEB), Yersinia pestis (plague), E. Coli, Salmonella typhimurium, Streptococcus pneumoniae, and others are being optimized for sensitivity using the same technology. Table 1.3 shows results of a sensitivity study performed for determination of Bacillus anthracis
18 YING HUANG ET AL.
TABLE 1.3. Results of a sensitivity study for Bacillus anthracis, Vollum, CapB gene .
|
|
Number positives/number replicates |
|
||
|
|
|
|
|
|
Sample |
Chip 1 |
Chip 2 |
Chip 3 |
Chip 4 |
Total |
|
|
|
|
|
|
1 fg/µl |
1/10 |
1/10 |
1/10 |
1/10 |
4/40 |
10 fg/µl |
8/10 |
7/10 |
7/10 |
8/10 |
30/40 |
100 fg/µl |
10/10 |
10/10 |
10/10 |
10/10 |
40/40 |
Study performed as an independent evaluation of the method by, Midwest Research Institute, Florida.
Vollum DNA. A PCR amplification protocol was developed and CapB gene was used as a confirmation gene. Table 1.3 demonstrates that 100 % correct calls were made for 100 fg/µl DNA and 75% for 10 fg/µl DNA. These values correspond to ca. 170 and 17 copies of anthrax DNA. The achieved sensitivity is well within the requirements for field detection of biological warfare agents. Similar sensitivity has been achieved for other biowarfare agents.
1.3.7. Applications in Proteomics
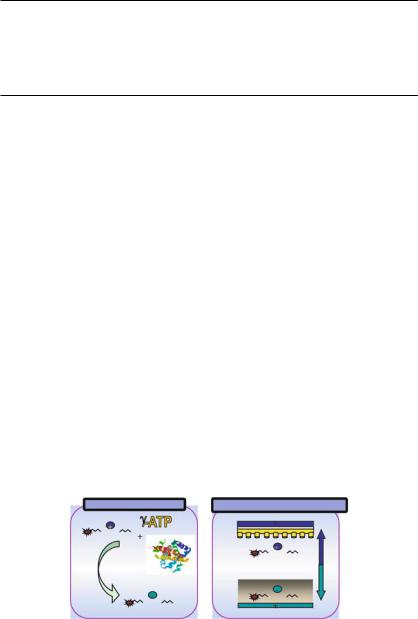
After the completion of the human genome project, the attention of the scientific community has turned toward the gene products within the cell and tissue matrix, namely proteins. The field of proteomics is an evolving area, which may shed light on the proteins associated with diseases and tumors. Protein kinases are of particular interest because they have been shown to be key regulators of many cell functions and have been one of the main targets in drug industry. Several high-throughput screening (HTS) kinase assays have been developed based on either antibodies or radioactivity for detection. Recently, an electronic, fluorescent assay for kinases, phosphatases and proteases has been developed for the serine/threonine kinase PKA [30]. This ElectroCaptureTM PKA assay combines electric field separation of a substrate and a reaction product of different net charge and subsequent capture of the reaction product on a capture matrix (Figure 1.13). The Lissamine-rhodamine labeled Kemptide peptide substrate contains a (+1) charge. Upon phosphorylation, the
Kinase Reaction |
Electronic Separation |
LRRASLG |
|
|
+ |
|
LRRASLG |
Kinase |
Capture Matrix |
|
|
|
LRRASLG |
LRRASLG |
|
FIGURE 1.13. The ElectroCaptureTM Assay. The fluorescently labelled substrate contains a (+1) charge. Upon phosphorylation, the peptide substrate undergoes a charge inversion from a (+1) charge to a (−1) charge on the product of the reaction. When an electric field is applied, the unphosphorylated peptide substrate (+1) migrates towards the negative electrode and the product (−1) migrates towards the positive electrode. The (−1) charged phosphorylated peptides migrate towards the (+) electrode from the solution, through the diffusion barrier and bind to the membrane.
ELECTRONIC MICROARRAY TECHNOLOGY AND APPLICATIONS |
19 |
peptide substrate undergoes a charge inversion from a (+1) to a (−1) charge on the product of the reaction. When an electric field is applied, the positively charged unphosphorylated peptide substrate migrates towards the negative electrode and the neagtively charged phosphorylated peptides product migrates towards the positive electrode from the solution, through the diffusion barrier and bind to the membrane. After the electrophoretic separation, the amount of Lissamine-rhodamine labeled phosphorylated peptides product can be quantitated, e.g., using a Tecan Ultra 384 fluorescence reader. The ElectroCaptureTM PKA assay was validated with both known PKA inhibitors and with library compounds. The pKi results obtained in the ElectroCaptureTM assay were comparable to those generated in our current radioactive Filter Binding assay and antibody-based competitive Fluorescence Polarization (FP) PKA assay formats [30].
1.4. SUMMARY AND OUTLOOK
Future applications of focused arrays will involve improvements in speed, sample preparation and systems integration. This evolution in technology will allow the user to process a variety of samples in the disposable cartridge or directly on the embedded array. As we have demonstrated in this review, complete sample to answer systems based on site-specific electrophoresis, dielectrophoresis, DNA amplification and detection can be optimized, miniaturized and integrated into a complete sample-to-answer system. The usage of integrated and portable biological detection systems is expected to increase several fold in the next few years including point of care diagnostic applications for genotyping, pharmacogenomics, proteomics, detection of infectious agents as well as identification of biological warfare agents. The electronic microarray technology offering high speed of hybridization, target concentration and multiplexing has all the advantages to be one of highly competitive technologies in future miniaturized instruments for molecular and clinical diagnostics.
REFERENCES
[1]A.A. Alzadeh, M.B. Elsen, R.E. Davis, C. Ma, I.S. Lossos, and A. Rosenwald et al. Nature, 403:503, 2000.
[2]R. Anderson, X. Su, G. Bogdan, and J. Fenton. Nucleic Acids Res., 28:12, 2000.
[3]H.A. Behrensdorf, M. Pignot, N. Windhab, and A. Kappel. Nucleic Acids Res., 30:e64, 2002.
[4]J. Boguslavsky. Lab-on-a-Chip: Easier, Faster, Smaller, Drug Discovery & Development, July/August, p. 32, 2001.
[5]L. Carey and L. Mitnik. Electrophoresis, 23:1386, 2002.
[6]R. Chakraboty, D.N. Stivers, B. Su, Y. Zhong, and B. Budowle. Electrophoresis, 20:1682, 1999.
[7]M. Chee, R. Yang, E. Hubbell, A. Berno, X.C. Huang et al. Science, 274:610, 1996.
[8]J. Cheng, E.L. Sheldon, L. Wu, A. Uribe, L.O. Gerrue, J. Carrino, M.J. Heller, and J.P. O’Connell. Nat. Biotech., 16:541, 1998.
[9]K.L. Cooper and R.V. Goering. J. Mol. Diagn., 5:28, 2003.
[10]B. Dukek and D.J. O’Kane. IVD Technol., 47:Jan/Feb, 2004.
[11]C.F. Edman, D.E. Raymond, D.J. Wu, E. Tu, R.G. Sosnowski, W.F. Butler, M. Nerenberg, and M.J. Heller.
Nucleic Acids Res., 25:4907, 1997.
[12]C.F. Edman, P. Mehta, R. Press, C.A. Spargo, G.T. Walker, and M. Nerenberg. J. Investig. Med., 48:93, 2000.
20 |
YING HUANG ET AL. |
[13]M. Eggers, M. Hogan, R.K. Reich, J.B. Lamture, D. Ehrlich et al. Biotechniques, 17:516, 1994.
[14]M. Erali, B. Schmidt, E. Lyon, and C. Wittwer. Clin. Chem., 49:732, 2003.
[15]J.G. Evans and C. Lee-Tataseo. Clin. Chem., 48:1406, 2002.
[16]K.L. Ewalt, R.W. Haigis, R. Rooney, D. Ackley, and M. Krihak. Anal. Biochem., 289:162, 2001.
[17]L. Feng and M. Nerenberg. Gene. Ther. Mol. Biol., 4:183, 1999.
[18]S.P. Fodor, R.P. Rava, X.C. Huang, A.C. Pease, C.P. Holmes, and C.L. Adams. Nature, 251:767, 1991.
[19]P.N. Gilles, D.J. Wu, C.B. Foster, P.J. Dillon, and S.J. Chanock. Nat. Biotechnol., 17:365, 1999.
[20]J.G. Hacia. Nat. Biotechnol., 21(suppl):42, 1999.
[21]M.J. Heller. IEEE Eng. Med. Biol., 100: March/April, 1996.
[22]M.J. Heller. Annu. Rev. Biomed. Eng., 4:129, 2002.
[23]M.J. Heller, E. Tu, R. Martinsons, R.R. Anderson, C. Gurtner, A.H. Forster, and R. Sosnowski. In M.J. Heller and A. Guttman (ed.), Integrated Microfabricated Biodevices. Marcel Dekker, New York, p. 223, 2002.
[24]M. Heller, A.H. Forster, and E. Tu. Electrophoresis, 21:157, 2000.
[25]M.J. Heller, E. Tu. U.S. Patent # 5,605,662 Nanogen, Inc., San Diego, CA, 1997.
[26]Y. Huang, K.L. Ewalt, M. Tirado, R. Haigis, A. Forster, D. Ackley, M.J. Heller, J.P. O’Connell, and M. Krihak. Anal. Chem., 73:1549, 2001.
[27]Y. Huang, S. Joo, M. Duhon, M. Heller, B. Wallace, and X. Xu. Anal. Chem., 74:3362, 2002.
[28]Y. Huang, J.M. Yang, P.J. Hopkins, S. Kassegne, M. Tirado, A.H. Forster, and H. Reese. Biomed. Microdev., 3:217, 2003.
[29]Y. Huang, J. Shirajian, A. Schroder, Z. Yao, T. Summers, D. Hodko, and R. Sosnowski. Electrophoresis, 25:3106, 2004.
[30]K. Huss, R.M. Campbell, S. Miick, S. Jalali, D. Thomas, and M. Jimenez. 9th Annual SBC Conference, Poster 1025, Portland, OR, 2003.
[31]S.K. Kassegne, H. Reese, D. Hodko, J.M. Yang, K. Sarkar, D. Smolko, P. Swanson, D.E. Raymond, M.J. Heller, and M.J. Madou. Sens. Actu. B, 94:81, 2003.
[32]K. Liszewski. Broader Uses for Microfluidics Technologies, Genet. Eng. News, vol. 23, no 9, p. 40, 2003.
[33]M. McCormick. Genet. Eng. News, vol. 23, no. 15, p. 34, 2003.
[34]C.E. Pearson, Y.H. Wang, J.D. Griffith, and R.R. Sinden. Nucleic Acids Res., vol. 26, 816, 1988.
[35]E.S. Pollak, L. Feng, H. Ahadian, and P. Fortina. Ital. Heart J., 2:568, 2001.
[36]S. Raddatz, J. Mueller-Ibeler, J. Kluge, L. Wass, G. Burdinski, J.R. Haven, T.J. Onofrey, D. Wang, and
M.Schweitzer. Nucleic Acids Res., 30:4793, 2002.
[37]R. Radtkey, L. Feng, M. Muralhidar, M. Duhon, D. Canter, D. DiPierro, S. Fallon, E. Tu, K. McElfresh,
M.Nerenberg, and R. Sosnowski. Nucleic Acids Res., 28:e17, 2000.
[38]E. Ricart, W.R. Taylor, E.V. Loftus, D. O’Kane, R.M., Weinshilboum, W.J. Tremaine, W.S. Harmsen, A.R. Zinsmeister, and W.J. Sandborn. Am. J. Gastroenterol., 97:1763, 2002.
[39]R. Santacroce, A. ratti, F. Caroli, B. Foglieni, A. Ferraris et al. Clin. Chem., 48:2124, 2002.
[40]M. Schena, D. Shalon, R.W. Davis, and P.O. Brown. Science, 270:467, 1995.
[41]I. Schrijver, M.J. Lay, and J.L. Zehnder. Am. J. Clin. Pathol. 119:490, 2003.
[42]E. Sheldon, et al. In electronic sample handling. In S.A. Minden and L.M. Savage (ed.), Diagnostic Gene Detection & Quantification Technologies for Infectious Agents and Human Genetic Diseases, IBC Library Series, pp. 225–238, 1997.
[43]Y.R. Sohni, J.R. Cerhan, and D. O’Kane. Hum. Immunol. 64:2003.
[44]R. Sosnowski, E. Tu, W.F. Butler, J. O’Connell, and M. J. Heller. Proc. Natl. Acad. Sci. USA, vol. 94, p. 1119, 1997.
[45]R. Sosnowski, M.J. Heller, E. Tu, A.H. Forster, and R. Radtkey. Psychiatr. Genet., 12:181, 2002.
[46]P. Swanson, R. Gelbart, A.E. Atlas, L. Yang, T. Grogan, W.F. Butler, D.E. Ackley, and E. Sheldon. Sens. Actur. B., 64:22, 2000.
[47]W.A. Thistlethwaite, L.M. Moses, K.C. Hoffbuhr, J.M. Devaney, and E.P. Hoffman. J. Mol. Diagn., 5:121, 2003.
[48]V.W. Weedn and J.W. Hicks. Natl. Inst. Justics J., 234:16, 1997.
[49]E.M. Weidenhammer, B.F. Kahl, L. Wang, L. Wang, M. Duhon, J.A. Jackson, M. Slater, and X. Xu. Clin. Chem., 48:1873, 2002.
[50]L. Westin, X. Xu, C. Miller, L. Wang, C.F. Edman, and M. Nerenberg. Nat. Biotechnol., 18:199, 2000.
[51]L. Westin, C. Miller, D. Vollmer, D. Canter, R. Radtkey, M. Nerenberg, and J.P. O’Connell. J. Clin. Microbiol., 39:1097, 2001.