

Micro-Nano Technology for Genomics and Proteomics BioMEMs - Ozkan
.pdf(C)
1 m
FIGURE 3.13(C). Hoechst staining reveals the dissociation of the nucleic matter due to apoptosis induced by the exposure of the neurons to 9 ppm ethanol. The circled areas represented the dissociated nucleic matter due to apoptosis.
(D)
Intracellular calcium transients
5 m
FIGURE 3.13(D). Physiological effect of ethanol at 19 ppm on individual osteoblasts. The cells are stained with fluo-3 and visualized using FITC mode on Leica TCS SP2. Apoptotic bundles are seen distributed throughout the cytoplasm.
MICROARRAY AND FLUIDIC CHIP FOR EXTRACELLULAR SENSING |
83 |
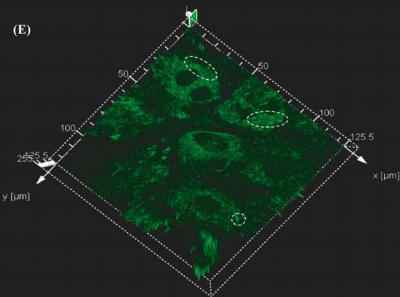
FIGURE 3.13(E). Three dimensional vector representation of the fluorescence intensity. The circled areas represent the high intensity peaks that correspond to the areas of localization of the apoptotic bundles.
the binding of fluo-3 to the ions. Figure 3.13(e) shows the three dimensional vector representation of the fluorescence intensity. The intensity levels are indicated by the z axis. The higher intensity peaks are associated with the apoptotic bundles. Figure 3.13(f) is the confocal micrograph of the dissociated chromosomes due to the effect of ethanol. Ethanol causes the differentiation of the bone matrix in large cell populations [134] but in single cell level it can be visualized using Hoechst stain as dissociated nucleic matter.
3.34.3. Effect of Hydrogen Peroxide on Neurons
Addition of hydrogen peroxide causes it’s binding to the α subunit of the APMA gated Na+ ion channels which produce a rapid ionic depolarization current. It simultaneously acts upon the NMDA gated channels which triggers the entry of Ca++ ions into the cell, which causes the transmembrane release of glutamate and a steep increase of intracellular levels of Ca++ [4]. Previous research has shown that large populations of hippocampal neurons are particularly vulnerable to hypoxia/ischaemia-induced damage, and free radicals are thought to be prime mediators of this neuronal destruction. It has been shown that hydrogen peroxide), through the production of free radicals, induces cell death by activation of a nonselective cation channel, which leads to irreversible cell depolarization and unregulated Ca2+ entry into the cell [124]. In single cells groups of free sodium potassium and calcium ions are expected localized at different regions of the cell. The sodium and potassium ions are expected to be localized near the cell membrane. The calcium ions are distributed throughout the cytoplasm with higher concentrations near the nucleus and the pre-synaptic

84 |
MIHRIMAH OZKAN ET AL. |
(F)
FIGURE 3.13(F). Hoechst staining reveals the dissociation of the nucleic matter due to apoptosis induced by the exposure of the osteoblasts to 19 ppm ethanol. The circled areas represent the dissociated nucleic matter due to apoptosis.
terminals. The cells are doubly stained for the three ion types. Based on the location of the apoptotic bundles the ion type is determined. Figure 3.14(a) is a confocal optical micrograph of neurons stained for the three ions after being exposed to hydrogen peroxide at 19ppm for the period of one sensing cycle. Figure 3.14(b) is a three dimensional vector representation of the fluorescence intensity of the apoptotic bundles. The z axis gives the various intensity levels of fluorescence. Previous in-vivo studies have established the presence and attributes of apoptosis and necrosis in the anatomically well-defined cortical region after exposure to hydrogen peroxide at physiologically relevant concentrations. These were verified under light microscopy with Hoechst 33342, staining [57]. Cells exhibiting apoptotic morphology with chromatin condensation and apoptotic bodies and necrotic ghost appearance were observed. In single cell in-vitro studies condensed chromatin is expected to be visualized using confocal microscopy. This is verified by figure 3.14(c).
3.34.4. Effect of Hydrogen Peroxide on Osteoblasts
Previous research has established that the physiological activity of osteoblasts is known to be closely related to increased intracellular Ca2+ activity ([Ca2+] i) in osteoblasts. The cellular regulation of [Ca2+]i in osteoblasts is mediated by Ca2+ movements associated with Ca2+ release from intracellular Ca2+ stores, and transmembrane Ca2+ influx via Na+−Ca2+ exchanger, and Ca2+ ATPase. Reactive oxygen species, such as hydrogen peroxide, play an important role in the regulation of cellular functions, and act as signaling molecules or toxins in cells. This behavior has been seen in-vivo and in-vitro in large cell populations [91]. Similarly after exposure to 25 ppm of hydrogen peroxide for the period corresponding

(A)
Localization of sodium and potassium ions
Intracellular calcium transients
5 m
FIGURE 3.14(A). Physiological effect of hydrogen peroxide at 19 ppm on individual neurons. The cells are stained with SBFI and PBFI esters and fluo-3 for visualizing free sodium potassium and calcium ions respectively. Double immunohistochemistry is performed after cell fixation. The sodium and potassium ions are localized near the cell membrane and the pre-synaptic terminals where as the free calcium ions are localized near the nucleus.
FIGURE 3.14(B). Three dimensional vector representation of the fluorescence intensity. The circled areas represent the high intensity peaks. The peak with the maximum intensity corresponds to the localization of the sodium and potassium ions at the pre-synaptic terminals. The intensity peaks around the nucleus correspond to the localization of the calcium ions.

86 |
MIHRIMAH OZKAN ET AL. |
(C)
1 m
FIGURE 3.14(C). Hoechst staining reveals the dissociation of the nucleic matter due to apoptosis induced by the exposure of the individual neurons to 19 ppm hydrogen peroxide. The circleed areas represent the dissociated nucleic matter due to apoptosis.
to one sensing cycle the fixed cells stained for free sodium and calcium ions show apoptotic bundles throughout the cytoplasm. This corresponds to the expected physiological behavior due to the effect of reactive species like hydrogen peroxide on excitable mammalian cells like osteoblasts. This behavior is seen in figure 3.14(d) which is a confocal optical micrograph that identifies apoptotic bundles formed due to the localization sodium and calcium ions. Figure 3.14(e) is the three dimensional vector representation of the fluorescence intensity. The higher intensity levels correspond to the areas of localization of the apoptotic bundles. Previous research indicates marked nuclear condensation and fragmentation of chromatin due to exposure to reactive species like hydrogen peroxide at physiologically relevant concentrations were observed by Hoechst 33382 stain, for large cell populations [113]. Similarly condensed chromatin was observed in single osteoblasts after exposure to hydrogen peroxide at 25 ppm concentration after exposure for a period of one sensing cycle. Figure 3.14(f) is the confocal micrograph of osteoblasts after hydrogen peroxide exposure and stained with Hoechst 33382.
3.34.5. Effect of Pyrethroid on Neurons
Addition of pyrethroid results in the activation of the NMDA gated channels. The negative charge along the membrane surface induces the binding of Mg++ ions causing the clogging of the channels thus preventing the flow of Na+ and K+ ions. Previous research has shown that the treatment of mammalian cells in-vivo with pyrethroid results in

MICROARRAY AND FLUIDIC CHIP FOR EXTRACELLULAR SENSING |
87 |
(D)
Localized calcium ions
Localized sodium ions
5 m
FIGURE 3.14(D). Physiological effect of hydrogen peroxide at 25 ppm on individual osteoblasts. The cells are stained with SBFI ester and fluo-3 for visualizing free sodium potassium and calcium ions respectively. Double immunohistochemistry is performed after cell fixation. The sodium ions are localized throughout the cytoplasm with a higher concentration away from the nucleus where as the free calcium ions are localized near the nucleus.
mitochondrial damage. The mitochondrial swelling was accompanied by the accumulation of electron dense granules. In addition, the neuropiles contained secondary lysosomes which increased in size and number with the progress of poisoning and showed signs of depletion of synaptic vesicles. This is imaged with free calcium binding stains. These stains show uniform permeability throughout the cell thus indicating the slow onset of apoptosis [122]. Similar behavior is observed at the single cell level. The patterned hippocampal neurons after exposure to pyrethroid at 280 ppb concentration for a period of one sensing cycle are stained with fluo-3 after fixation. The dye permeates throughout the cytoplasm indicating the slow onset of apoptosis associated with the effect of pyrethroid. Figure 3.15(a) is the confocal optical micrograph of patterned neurons undergoing fluorescence under FITC mode stained with fluo-3. Figure 3.15(b) is the three dimensional vector representation of

88 |
MIHRIMAH OZKAN ET AL. |
FIGURE 3.14(E). Three dimensional vector representation of the fluorescence intensity. The circled areas represent the high intensity peaks. The peak with the maximum intensity near the nucleus corresponds to the locallized sodium ions whereas the intensity peaks near the nucleus.
the fluorescence intensity. The fluorescence peaks are evenly distributed throughout the cell indicating the slow onsent of apoptosis due to the effect of pyrethroid. It has been shown that Organophosphorus (OP) compounds have been shown to be cytotoxic to neuroblastoma cell cultures. The mechanisms involved in OP compound-induced cell death (apoptosis versus necrosis) have been assessed morphologically by looking at nuclear fragmentation and budding using the fluorescent stain Hoechst 33342 Hoechst staining revealed induced timedependent apoptosis. In many cells OP has also induced nuclear condensation with little fragmentation or budding [16]. Similarly in individual neurons treated with pyrethroid also show nuclear condensation in keeping with the previous results as shown by the confocal optical micrograph in figure 3.15(c).
3.34.6. Effect of Pyrethroid on Osteoblasts
Previous research has shown that in in-vivo studies specific features of osteogenesis under a toxic action of pesticide was observed in experiments with inbred albino rats. This resulted in accumulation of potassium clusters that was visualized using autoradiography with 3H-thymidine label [70]. Similarly exposure of the patterned osteoblast to 890 ppb concentration of pyrethroid for the period of one sensing cycle and staining with PBFI ester after cell fixation results in the identification of potassium ion bundles that are formed due

1 m
FIGURE 3.14(F). Single osteoblasts stained with Hoechst 33382 stain after being exposed to hydrogen peroxide at 19 ppm concentration for a period of one sensing cycle. The circled areas indicate the regions where the chromatin has condensed due to apoptosis.
to the effect of the pyrethroid. Figure 3.15(d) is the confocal optical micrograph that shows the presence of potassium bundles after exposure to PBFI stain. Figure 3.15(e) is the three dimensional vector representation of the fluorescence intensity. The high intensity peaks correspond to the localization of the potassium ions. Based on previous research, in-vivo administration of pyrethroid results in the development of bone lesions. This translates cellularly to the development of nucleic material condensation [125]. Similar behavior is seen in single osteoblasts after exposure to pyrethroid and stained with Hoechst 33382 and this is shown in figure 3.15(f).
3.34.7. Effect of EDTA on Neurons
EDTA, a chelator of Zn and calcium (a modulator of AbetaP-mediated toxicity) induced a reversible change in the Zn-mediated aggregation. Thus based on previous research the effect of physiologically relevant amounts of EDTA causes the depolarization of the

90 |
MIHRIMAH OZKAN ET AL. |
(A)
5 m
FIGURE 3.15(A). Physiological effect of pyrethroid at 280 ppb on individual neurons. The cells are stained with fluo-3 for visualizing free calcium ion transients. A uniform permeation of the fluo-3 stain is observed within the cytoplasm of individual cells this establishes the onset of apoptosis. This behavior correlates to the in-vitro behavior of large cell populations after exposure to organophosphates.
(B)
FIGURE 3.15(B). Three dimensional vector representation of the fluorescence intensity. The circled areas represent the high intensity peaks. The high intensity peaks are distributed throughout the cytoplasm of the cell indicating the uniform distribution of free calcium ions throughout the cytoplasm that is associated with the onset of apoptosis due to the effect of pyrethroid.

MICROARRAY AND FLUIDIC CHIP FOR EXTRACELLULAR SENSING |
91 |
(C)
1 m
FIGURE 3.15(C). Single neurons stained with Hoechst 33382 stain after being exposed to pyrethriod at 280 ppb concentration for a period of one sensing cycle. The circled areas indicate the regions of nuclear condensation in keeping with the previous results obtained from in-vitro studies with exposure to physiologically relevant amounts of organophosphates.
membrane due to calcium emission. This results in excitotoxicity that eventually results in cell death [100]. The patterned neurons are exposed to 180 ppm concentration of EDTA over a period of one sensing cycle. The cells are then fixed and stained with fluo-3. This is a calcium indicator and binds to the free calcium ions generated throughout the cytoplasm due to the action of EDTA. Figure 3.16(a) is the confocal optical micrograph of patterned neurons stained with fluo-3. Figure 3.16(b) is the three dimensional vector representation of the fluorescence intensity. The z axis gives the intensity of fluorescence. The peaks indicate the location of the accumulation of free calcium ions. Previous research shows that nuclear spreads obtained from neurons of zebrafish indicate the formation of condensed chromatin due to apoptosis caused by the exposure to EDTA [14] Figure 3.16(c) is the confocal micrograph of neurons that show condensed chromation due to apoptosis caused by exposure to 180 ppm EDTA.
3.34.8. Effect of EDTA on Osteoblasts
Previous in-vivo research indicated that timed immersion in buffered EDTA selectively altered the mineral content at each level in the cortical bone structural hierarchy. This affected