

Micro-Nano Technology for Genomics and Proteomics BioMEMs - Ozkan
.pdf72 |
MIHRIMAH OZKAN ET AL. |
Neuron-Ethanol Frequency Spectrum
Concentration: 9ppm
15 |
A |
|
(314, 0.708) |
|
(626, 0.830) |
|
|
|
||
|
|
|
|
|
|
|||||
|
t=0s |
|
|
|
|
|
|
|
|
|
|
|
|
(314, 0.563) |
|
(626, 0.927) |
|
|
|
||
|
t=30s |
|
|
|
|
|
|
|
||
|
|
|
|
(314, 1.396) |
(626, 0.794) |
|
|
|
||
|
t=60s |
|
|
|
|
|
|
|
||
|
|
|
|
|
|
|
|
|
|
|
10 |
t=90s |
|
(314, 0.299) |
|
(626, 0.759) |
|
|
|
||
|
|
|
|
|
|
|
|
|||
Amplitude |
|
|
(314, 0.412) |
|
(626, 0.746) |
|
|
|
||
t=120s |
|
|
|
|
|
|
|
|||
t=150s |
|
(314, 0.383) |
|
(626, 0.465) |
|
|
|
|||
|
t=180s |
|
(314, 0.337) |
|
|
|
|
|
|
|
5 |
t=180s |
|
|
(626, 0.288) |
|
|
|
|||
|
|
|
|
|
|
|||||
|
t=210s |
|
(314, 0.514) |
|
(626, 0.512) |
|
|
|
||
|
|
|
(314, 1.12) |
|
(626, 0.701) |
|
|
|
||
|
t=240s |
|
|
|
|
|
|
|
||
|
|
|
|
|
|
|
|
|
|
|
|
t=270s |
|
(314, 0.467) |
|
(626, 0.729) |
|
|
|
||
|
|
|
|
|
|
|
|
|||
00 |
100 |
200 |
300 |
400 |
500 |
600 |
700 |
800 |
900 |
1000 |
|
|
|
|
|
Frequency(Hz) |
|
|
|
|
|
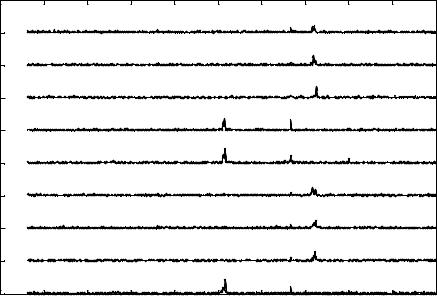
FIGURE 3.9(A). Signature pattern represented is obtained from a single neuron due to the action of ethanol at its detection limit of 9 ppm. SP due to the action of ethanol produces an Eigen Vector at 314 Hz [111].
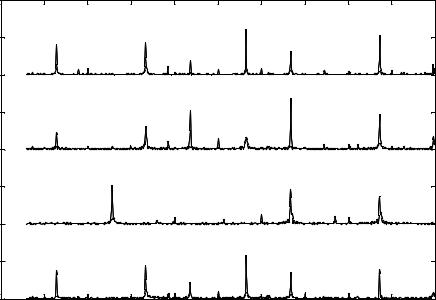
SP corresponding to the modulated firing rate of the osteoblast. During the first phase of the sensing cycle (t = (0, 60) sec) the modulated firing rate is focused at 722Hz. During the second phase of the sensing cycle (t = (60,120)sec) the modulated firing rate shifts towards the lower frequency value (514Hz). During the third phase of the sensing cycle (t = (120, 180)sec), the modulated frequency shifts back to the original higher frequency bursting (668Hz and 722Hz) as observed in the first phase. As the concentration of ethanol is very low the cell quickly recovers and on re-introducing the chemical at t = 180sec the SP starts to repeat itself (t = (180,240) sec).
3.30. HYDROGEN PEROXIDE SENSING
3.30.1. Single Neuron Sensing
Addition of hydrogen peroxide causes it’s binding to the α subunit of the APMA gated Na+ ion channels which produce a rapid ionic depolarization current. It simultaneously acts
MICROARRAY AND FLUIDIC CHIP FOR EXTRACELLULAR SENSING |
73 |
Osteoblast-Ethanol Frequency Spectrum
Concentration: 19 ppm
|
18 |
B |
|
|
|
|
|
|
|
|
|
|
|
|
|
|
|
|
|
(668, 0.347) |
(722, 0.469) |
t=0s |
|
||
|
16 |
|
|
|
|
|
|
|
|
|
|
|
|
|
|
|
|
|
|
|
|
(722, 0.611) |
t=30s |
|
|
|
14 |
|
|
|
|
|
|
|
|
|
|
|
|
|
|
|
|
|
|
|
|
(722, 0.728) |
t=60s |
|
|
|
12 |
|
|
|
|
|
|
|
|
|
|
|
|
|
|
|
|
|
(514, 0.758) |
(668, 0.691) |
t=90s |
|
|||
Amplitude |
10 |
|
|
|
|
|
|
|
( |
, 0.077) |
|
|
|
|
|
|
|
|
|
|
|
|
|
||
|
|
|
|
|
(514, 0.884) |
(668, 0.530) |
t=120s |
|
||||
8 |
|
|
|
|
|
|
|
|
|
|
|
|
|
|
|
|
|
|
|
|
(722, 0.535) |
t=150s |
|
||
|
|
|
|
|
|
|
|
|
|
|||
|
6 |
|
|
|
|
|
|
(668, 0.231) |
|
|
|
|
|
|
|
|
|
|
|
|
|
|
|
|
|
|
|
|
|
|
|
|
|
(668, 0.109) |
(722, 0.491) |
t=180s |
|
|
|
|
|
|
|
|
|
|
|
|
|||
|
4 |
|
|
|
|
|
|
|
|
|
||
|
|
|
|
|
|
|
|
|
|
|
|
|
|
|
|
|
|
|
|
|
|
(722, 0.621) |
t=210s |
|
|
|
|
|
|
|
|
|
(668, 0.188) |
|
|
|||
|
2 |
|
|
|
|
|
|
|
|
|||
|
|
|
|
|
|
|
|
|
|
|
|
|
|
|
|
|
|
|
(514, 0.904) |
|
(668, 0.458) |
t=240s |
|
||
|
|
|
|
|
|
|
|
|
|
|||
|
|
|
|
|
|
|
|
|
|
|
||
|
0 |
|
|
|
|
|
|
|
|
|
|
|
|
0 |
100 |
200 |
300 |
400 |
500 |
600 |
700 |
800 |
900 |
1000 |
|
|
|
|
|
|
|
Frequency(Hz) |
|
|
|
|
||
FIGURE 3.9(B). Signature pattern represented is obtained from a single osteoblast due to the action of ethanol at its detection limit of 19 ppm. SP due to the action of ethanol produces an Eigen Vectors at 514 Hz and 722 Hz [149].
upon the NMDA gated channels which triggers the entry of Ca++ ions into the cell, which causes the transmembrane release of glutamate and a steep increase of intracellular levels of Ca++ [4] The low frequency Eigen Vectors (175 Hz, 227 Hz, and 349 Hz) indicates the initial activation of APMA gated channels due to initial short binding transients of hydrogen peroxide. The mid frequency Eigen Vector (453 Hz) corresponds to the activation of NMDA gated channels and the longer duration of binding of hydrogen peroxide to NMDA receptors. The high frequency Eigen Vectors (749 Hz and 975 Hz) correspond to the induced excitotoxicity (Fig 3.10(a)) (Stout et al., 1998). The lowest concentration of hydrogen peroxide detected by the neuronal cell membrane is 19ppm.
3.30.2. Single Osteoblast Sensing
The single osteoblast cells were isolated and positioned over individual electrodes in a manner previously described. The initial concentration of hydrogen peroxide used was 5000ppm and the modified electrical activity was recorded. The concentration of hydrogen peroxide was decremented in a stepwise manner and in each case the modified electrical activity was recorded. The lowest concentration of hydrogen peroxide sensed by a single

74 |
MIHRIMAH OZKAN ET AL. |
Neuron-Hydrogen Peroxide Frequency Spectrum
Concentration: 19ppm
|
12 |
|
|
|
|
|
|
|
|
|
|
|
|
A |
|
|
|
|
|
|
|
|
(853, 1.048) |
|
|
|
t=0s |
(175, 0.387) |
|
(349, 0.614) |
|
|
|
|
||||
|
|
|
|
(749, 0.620) |
(975, 0.318) |
|||||||
|
|
|
(227, 0.388) |
|
(453, 0.293) |
(626, 0.285) |
|
|||||
|
10 |
|
|
|
|
|
|
|
|
|
|
|
|
t=30s |
|
|
|
|
|
|
|
|
(853, 1.454) |
|
|
|
|
(227, 0.489) |
|
|
|
(749, 0.651) |
|
|
||||
|
|
|
|
|
|
|
|
|||||
|
|
|
|
|
(349, 0.427) (453, 0.612) |
|
|
|
||||
|
|
(175, 0.141) |
|
(626, 0.352) |
|
(975, 0.264) |
||||||
|
8 |
|
|
|
|
|
|
|
|
|
|
|
|
t=60s |
|
|
|
|
|
(453, 1.054) |
|
(749, 1.191) |
|
|
|
|
|
(175, 0.319) |
|
(349, 0.666) |
|
|
(853, 0.433) |
|
||||
Amplitude |
|
|
|
(626, 0.462) |
|
|||||||
|
|
(227, 0.240) |
|
|
|
(975, 0.279) |
||||||
|
|
|
|
|
|
|
||||||
6 |
|
|
|
|
|
|
|
|
|
|
|
|
t=90s |
|
|
|
|
|
|
|
(749, 0.435) (853, 0.464) |
|
|||
|
(175, 0.253) |
|
(349, 0.546) |
(453, 0.295) |
|
|
||||||
|
|
|
(227, 0.207) |
(626, 0.436) |
|
(975, 0.177) |
||||||
|
|
|
|
|
|
|
||||||
|
4 |
|
|
|
|
|
|
|
|
|
|
|
|
t=120s |
|
|
(349. 0.762) |
(453, 0.682) |
|
|
(853, 1.148) |
|
|||
|
|
(175, 0.232) |
|
|
(749, 0.544) |
|
|
|||||
|
|
|
|
|
|
|
(975, 0.222) |
|||||
|
|
|
(227, 0.278) |
|
|
|
(626, 0.064) |
|
||||
|
|
|
|
|
|
|
|
|
||||
|
2 |
|
|
|
|
|
|
|
|
(749, 1.589) |
|
|
|
t=150s |
|
|
|
|
|
|
|
|
|
||
|
|
|
|
|
|
|
|
|
|
|
||
|
(175, 0.205)(227, 0.503) |
(349, 0.554) |
|
(626, 0.228) |
(853, 0.811) |
|
||||||
|
(453, 0.129) |
|
(975, 0.364) |
|||||||||
|
0 |
|
|
|
|
|
|
|
|
|
|
|
|
|
|
|
|
|
|
|
|
|
|
|
|
|
0 |
100 |
200 |
300 |
400 |
500 |
600 |
700 |
800 |
900 |
1000 |
|
|
|
|
|
|
|
|
Frequency(Hz) |
|
|
|
|
|
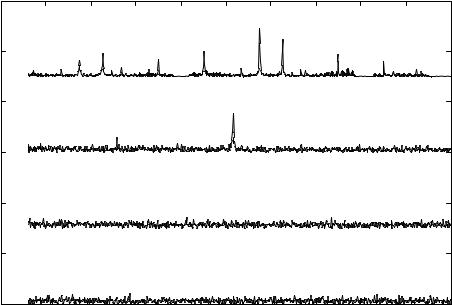
FIGURE 3.10(A). Signature pattern represented is obtained from a single neuron due to the action of hydrogen peroxide at its detection limit of 19 ppm. SP due to the action of hydrogen peroxide produces low frequency Eigen Vectors at 175 Hz, 227 Hz, and 349 Hz, mid frequency Eigen Vector at 453 Hz and high frequency Eigen Vectors at 749 Hz and 975 Hz [111].
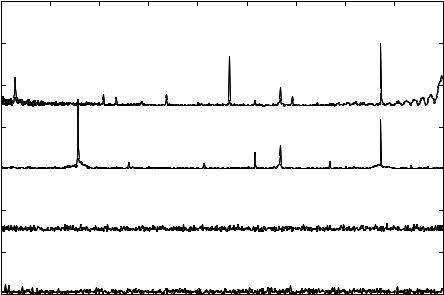
osteoblast was 25ppm. FFT analysis was performed on the acquired data pertaining to the modified extracellular potential to yield the SP. The instant at which the chemical is added to the chip system is denoted by t = 0sec. Figure 3.10(b) represents the signature pattern. There are two eigen vectors (257Hz, and 873Hz) in the SP corresponding to the modulated firing rate of the osteoblast. The frequency of 668Hz corresponds to the osteoblast firing rate in the absence of a chemical agent. During the first half of the cycle, the low frequency subsidiary peaks (129Hz, 334Hz, and 437Hz) are expressed. During the second half of the cycle the high frequency subsidiary peak (565Hz) is expressed.
3.31. PYRETHROID SENSING
3.31.1. Single Neuron Sensing
Addition of pyrethroid results in the activation of the NMDA gated channels. The negative charge along the membrane surface induces the binding of Mg++ ions causing the clogging of the channels thus preventing the flow of Na+ and K+ ions [4]. These results in the
MICROARRAY AND FLUIDIC CHIP FOR EXTRACELLULAR SENSING |
75 |
Osteoblast-Hydrogen Peroxide Frequency Spectrum
Concentration: 25ppm
|
18 |
|
|
|
|
|
|
|
|
|
|
|
|
B |
|
|
|
|
(565, 1.214) |
|
|
|
|
|
17 |
|
|
|
|
|
|
(873, 1.060) |
|
||
|
(129, 0.812) |
(334, 0.857) |
|
|
|
|
|
||||
|
|
|
(668, 0.620) |
|
|
|
|||||
|
|
|
|
|
(437, 0.685) |
|
|
|
|
||
|
|
t=0 sec |
|
|
|
|
|
|
|
||
|
|
|
|
|
|
|
|
|
|
|
|
|
16 |
|
|
|
|
|
|
|
|
|
|
|
|
|
|
|
|
|
|
(668, 1.359) |
|
|
|
|
15 |
|
|
|
(437, 1.046) |
|
|
|
(873, 0.941) |
|
|
|
|
|
(334, 0.621) |
|
|
|
|
|
|||
Amplitude |
|
(129, 0.465) |
|
(565, 0.324) |
|
|
|
||||
|
|
|
|
|
|
|
|||||
|
t=30 sec |
|
|
|
|
|
|
|
|
|
|
14 |
|
|
|
|
|
|
|
|
|
|
|
13 |
|
|
(257, 1.023) |
|
|
|
(668, 0.722) |
|
(873, 0.753) |
|
|
|
|
|
|
|
|
|
|
||||
|
|
|
|
|
|
|
|
|
|||
|
12 |
t=60 sec |
|
|
|
|
|
|
|
|
|
|
|
|
|
|
|
|
|
|
|
|
|
|
|
|
|
|
|
|
(565, 1.645) |
|
|
|
|
|
11 |
(129, 0.757) |
(334, 0.900) |
|
|
(668, 0.715) |
|
(873, 0.789) |
|
||
|
|
|
|
|
(437, 0.454) |
|
|
|
|
||
|
|
|
|
|
|
|
|
|
|
||
|
10 |
t=90 sec |
|
|
|
|
|
|
|
|
|
|
100 |
200 |
300 |
400 |
500 |
600 |
700 |
800 |
900 |
1000 |
|
|
0 |
||||||||||
|
|
|
|
|
Frequency(Hz) |
|
|
|
|
||
FIGURE 3.10(B). Signature pattern represented is obtained from a single neuron due to the action of hydrogen peroxide at its detection limit of 25 ppm. SP due to the action of hydrogen peroxide produces two Eigen Vectors at 257Hz, and 873Hz [149].
reduction of the depolarizing ionic current reducing the firing rate to 514 Hz (Fig 3.11(A)). SP due to the effect of pyrethroid produces an Eigen Vectors at 514 Hz and 576 Hz. The initial concentration of pyrethroid sensed was 5000ppm and the detection limit for the single cell was determined to be 280 ppb.
3.31.2. Single Osteoblast Sensing
The initial concentration of pyrethroid used was 5000ppm and the modified electrical activity was recorded. The concentration of pyrethroid was decremented in a stepwise manner and in each case the modified electrical activity was recorded. The lowest concentration of pyrethroid sensed by a single osteoblast was 890ppm. FFT analysis was performed on the acquired data pertaining to the modified extracellular potential to yield the SP. The instant at which the chemical is added to the chip system is denoted by t = 0sec. Figure 3.11(b) represents the signature pattern. There are two eigen vectors (129Hz, and 873Hz) in the SP corresponding to the modulated firing rate of the osteoblast The frequency of 668Hz corresponds to the osteoblast firing rate in the absence of a chemical agent. During the first half of the cycle there is a high frequency subsidiary peak corresponding to 565Hz. During the second half of the cycle there is a low frequency subsidiary peak of 257Hz.
76 |
MIHRIMAH OZKAN ET AL. |
Neuron-Pyrethroid Frequency Spectrum
Concentration: 280 ppb
|
6 |
|
|
|
|
|
|
|
|
|
|
|
|
A |
|
|
|
|
576 |
|
|
|
|
|
|
t=0s |
|
|
|
|
626 |
|
|
|
|
|
|
|
|
|
|
|
|
|
|
||
|
5 |
|
|
|
|
|
|
|
|
|
|
|
4 |
t=30s |
|
|
|
514 |
|
|
|
|
|
Amplitude |
3 |
|
|
|
|
|
|
|
|
|
|
|
t=60s |
|
|
|
|
|
|
|
|
|
|
|
|
|
|
|
|
|
|
|
|
|
|
|
2 |
|
|
|
|
|
|
|
|
|
|
|
1 |
t=90s |
|
|
|
|
|
|
|
|
|
|
0 |
100 |
200 |
300 |
400 |
500 |
600 |
700 |
800 |
900 |
1000 |
|
0 |
||||||||||
|
|
|
|
|
|
Frequency(Hz) |
|
|
|
|
|
FIGURE 3.11(A). Signature pattern represented is obtained from a single neuron due to the action of pyrethroid at its detection limit of 280 ppb. SP due to the action of pyrethroid produces Eigen Vectors at 514 Hz and 576 Hz [111].
3.32. EDTA SENSING
3.32.1. Single Neuron Sensing
Addition of EDTA causes it’s binding to the GABAA as well as the NMDA receptor gated Cl−and Na+ ion channels, respectively [130]. The GABAA activation produces a hyperpolarizing current resulting in low frequency bursting at 227 Hz and NMDA activation produces a high frequency burst of 873 Hz (Fig 3.12(a)). The initial concentration of EDTA used is 5000ppm and the detection limit obtained for the single neuron is 180ppm.
3.32.2. Single Osteoblast Sensing
The initial concentration of EDTA used was 5000ppm and the modified electrical activity was recorded. The concentration of EDTA was decremented in a stepwise manner and in each case the modified electrical activity was recorded. The lowest concentration of EDTA sensed by a single osteoblast was 280ppm. FFT analysis was performed on the acquired data pertaining to the modified extracellular potential to yield the SPV. The instant at which EDTA is added to the chip system is denoted by t = 0sec. Figure 3.12(b) represents
MICROARRAY AND FLUIDIC CHIP FOR EXTRACELLULAR SENSING |
77 |
Osteoblast-Pyrethroid Frequency Spectrum
Concentration: 890 ppb
|
7 |
|
|
|
|
|
|
|
|
|
|
|
B |
|
|
|
|
|
|
|
|
|
6 |
|
|
|
|
|
|
|
(873, 1.500) |
|
|
|
|
|
|
(565, 1.186) |
|
|
|
|
|
|
|
|
|
|
|
|
|
|
|
|
|
|
(129, 0.681) |
|
|
|
|
|
|
|
|
|
5 |
|
|
|
|
|
(668, 0.451) |
|
|
t=0sec |
|
|
|
|
|
|
|
|
|
||
|
|
|
(257, 1.653) |
|
|
|
|
|
(873, 1.189) |
|
|
4 |
|
|
|
|
|
|
|
||
Amplitude |
|
|
|
|
|
(668, 0.547) |
|
|
|
|
|
|
|
|
|
|
|
|
|
||
|
|
|
|
|
|
|
|
|
t=30sec |
|
3 |
|
|
|
|
|
|
|
|
|
|
|
2 |
|
|
|
|
|
|
|
|
t=60sec |
|
|
|
|
|
|
|
|
|
|
|
|
1 |
|
|
|
|
|
|
|
|
|
|
|
|
|
|
|
|
|
|
|
t=90sec |
|
0 |
200 |
300 |
400 |
500 |
600 |
700 |
800 |
900 |
1000 |
|
100 |
|||||||||
|
|
|
|
|
Frequency(Hz) |
|
|
|
|
|
FIGURE 3.11(B). Signature pattern represented is obtained from a single osteoblast due to the action of pyrethroid at its detection limit of 890 ppb. SP due to the action of pyrethroid produces Eigen Vectors at 129 Hz and 873 Hz [149].
the signature pattern. The initial peak in the frequency spectrum is observed at 514Hz corresponding to the first eigen vector. This is obtained at t = 0, after the immediate application of EDTA. Osteoblast cells then regain their control of the firing rate, corresponding to 667Hz. The next two eigen vectors of 258Hz and 872Hz are obtained in the time interval (t = (60, 90) sec). Subsidiary low frequency peaks are observed at 129Hz, 334H, 437Hz and high frequency peaks are observed at 514Hz and 565Hz.
3.33. IMMUNOHISTOCHEMISTRY
To verify the associated changes physiological changes related to the exposure to varying dosages of diesel and gasoline at the cellular level. The cells are first exposed to the specific chemical agents for the sensing cycle period as described in detail elsewhere [110]. The cells are then fixed using standard immunohistochemistry procedures. Briefly the patterned cells on the sensing platform were exposed to the specific chemical analytes namely either diesel or gasoline for a period of 270 sec (or 4.5 minutes). This time period constitutes to one sensing cycle which was determined previously from other sensing experiments performed on single chemical analytes [Yang et al., 2003, 110]. The cell array is then washed twice with Phosphate Buffered Saline (1X). The wash cycle duration was 3 minutes each.
78 |
MIHRIMAH OZKAN ET AL. |
Neuron-EDTA Frequency Spectrum
|
|
|
|
|
|
|
|
Concentration: 180 ppm |
|
||
|
16 |
|
|
|
|
|
Concentration: 180 ppm/ |
|
|||
|
D |
|
|
|
|
|
|
|
|
|
|
|
|
|
|
|
|
|
|
|
|
|
|
|
|
A |
|
(227, 1.021) |
|
|
|
|
|
|
|
|
|
|
|
|
|
|
|
|
|
||
|
14 |
t=0s |
|
|
|
|
(626, 0.013) |
|
|
(873, 0.345) |
|
|
|
|
|
|
|
|
|
|
|
|
|
|
|
t=30s |
|
(227, 0.836) |
|
|
|
|
(873, 0.324) |
||
|
12 |
|
|
|
|
(626, 0.012) |
|
|
|||
|
|
|
|
|
|
|
|
|
|
||
|
|
t=60s |
|
|
|
|
|
|
|
|
|
|
10 |
|
|
|
|
|
|
|
|
|
|
|
|
t=90s |
|
|
|
|
|
|
|
|
|
Amplitude |
8 |
|
|
|
|
|
|
|
|
|
|
|
t=120s |
|
|
|
|
|
|
|
|
|
|
|
6 |
|
|
|
|
|
|
|
|
|
|
|
|
|
|
|
|
|
(626, 0.0245) |
|
|
|
|
|
4 |
t=150s |
|
|
|
|
|
|
|
|
|
|
|
|
|
|
|
|
|
|
|
|
|
|
2 |
t=180s |
|
|
|
|
|
|
|
|
|
|
|
|
|
|
|
|
|
|
|
|
|
|
|
t=210s210s |
|
|
|
|
|
|
|
|
|
|
0 |
100 |
200 |
300 |
400 |
500 |
600 |
700 |
800 |
900 |
1000 |
|
0 |
||||||||||
|
|
|
|
|
|
Frequency(Hz) |
|
|
|
|
|
FIGURE 3.12(A). Signature pattern represented is obtained from a single neuron due to the action of EDTA at its detection limit of 180 ppm. SP due to the action of EDTA produces a Eigen Vectors at 227Hz and 873 Hz [111].
After aspiration the cells are exposed to 1–3% formalin for a period of 20 minutes. After aspiration the cells were exposed to 1% triton –X in the case of neurons and 10% triton –X in case of osteoblasts for a period of 25 minutes. This functions as a cell permeating agent that allows the easier penetration of the dye by increasing the permeability of the cell membrane. The stain then is provided with an easier access to the locations of interest namely the presence of caged calcium emissions which are the expected biological changes at the cellular level. The cells were then aspirated with 1X PBS three times for a period of 3 minutes each. Cells were then stained with Fluo-3 (Molecular Probes, Eugene, OR) which bind to the intracellular calcium channels that produce calcium emissions due to excitation by the chemical analytes under analysis (Coward et al., 1999). Cells are incubated with Fluo-3(1 mg/0.5 ml) at a 1:1000 dilution for a period of 30 min. The cells are then aspirated with 1X PBS 3 times for a period of 2 minutes each. The cells are then imaged using Leica SP2 UV confocal microscope (Leica Microsystems, Inc., Germany).
Similarly for staining the voltage sensitive sodium and potassium channels, the cells are fixed with 1–3% formalin using the same procedure as described above. The stock solution of the dye for cell loading is prepared by dissolving the material in anhydrous DMSO to a concentration of 10 mM. The same procedure is followed for the sodium ion stain which is the AM ester of SBFI (Molecular Probes, Eugene, OR) and the potassium ion stain which is the AM ester of PBFI (Molecular Probes, Eugene, OR). The molecular weights of SBFI AM and PBFI AM are 1127 and 1171, respectively. The use of Pluronic R F-127 is essential

MICROARRAY AND FLUIDIC CHIP FOR EXTRACELLULAR SENSING |
79 |
Osteoblast-EDTA Frequency Spectrum
Concentration: 280 ppm
|
18 |
B |
|
|
|
|
|
|
(514, 1.404) |
|
|
|
|
|
|
|
|
|
|
|
|
|
|
|
|
||
|
|
t=0s |
|
|
|
|
|
|
|
|
|
|
|
|
16 |
|
|
|
|
|
|
|
(514, 1.465) |
|
|
|
|
|
t=30s |
|
|
|
|
|
|
|
|
|
|
|
|
|
|
|
|
|
|
|
|
|
|
|
|
|
|
|
14 |
|
|
(258, 1.484) |
|
|
|
|
|
|
|
(872, 0.651) |
|
|
t=60s |
|
|
|
|
|
|
|
(667, 0.606) |
|
|
||
|
|
|
|
|
|
|
|
|
|
|
|
|
|
|
12 |
|
|
(258, 1.834) |
|
|
|
|
|
(667, 0.975) |
|
(872, 0.744) |
|
|
t=90s |
|
(401, 0.207) |
|
|
|
|
||||||
|
|
|
|
|
|
|
|
|
|||||
Amlitude |
10 |
t=120s |
(129, 1.579) |
|
(437, 0.680) |
|
(565, 0.358) |
(667, 0.334) |
|
(872, 0.769) |
|
||
|
|
|
|
|
|
|
|
|
|
||||
8 |
|
|
|
|
|
|
|
|
|
|
(872, 2.242) |
|
|
|
|
|
|
|
|
|
|
|
|
|
|
||
|
|
|
(334, 0.851) |
|
(565, 0.814) |
|
|
|
|
||||
|
|
t=150s |
|
|
(667, 0.437) |
|
|
|
|||||
|
6 |
|
|
|
|
|
|
|
|
|
|
|
|
|
|
(129, 1.449) |
|
|
|
|
|
|
|
|
(872, 1.124) |
|
|
|
|
|
|
|
(437. 0.671) |
|
|
(667, 0.546) |
|
|
|||
|
|
t=180s |
|
|
|
|
|
|
|
|
|||
|
4 |
|
|
|
|
|
|
|
|
|
|
|
|
|
|
(129, 1.409) |
|
|
|
|
|
|
|
|
(872, 1.08) |
|
|
|
|
|
|
|
(437, 0.690) |
|
(565, 0.395) |
|
|
|
|||
|
|
t=210s |
|
(334, 0.282) |
|
(667, 0.301) |
|
|
|
||||
|
2 |
|
|
|
|
|
|
|
|
||||
|
|
|
|
|
|
|
|
(514, 1.654) |
|
|
|
|
|
|
|
|
|
|
|
|
|
|
(667, 0.262) |
|
|
|
|
|
|
t=240s |
|
|
|
|
|
|
|
|
|
|
|
|
0 |
100 |
200 |
300 |
400 |
500 |
600 |
700 |
800 |
900 |
1000 |
||
|
0 |
||||||||||||
|
|
|
|
|
|
|
Frequency(Hz) |
|
|
|
|
||
FIGURE 3.12(B). Signature pattern represented is obtained from a single osteoblast due to the action of EDTA at its detection limit of 280 ppm. SP due to the action of EDTA produces Eigen Vectors at 258Hz, 514Hz, and 872Hz. [149].
for optimal cell loading of both SBFI AM and PBFI AM due to the poor aqueous solubility of the dyes. 1 mL of a 20% (w/v) solution of Pluronic F-127 in DMSO (P-3000) is used in this case. The indicator stock solution in DMSO is mixed with an equal volume of 25% w/v Pluronic F-127 solution immediately prior to its addition to the cell loading buffer (Tsubokawa et al., 1999). The loading concentration used for both the indicators is 5 µM. The cells are incubated with the indicators for a period of 40 minutes before washing them twice with 1X PBS for a period of 2 minutes each. In the case of dual staining the cells are first loaded with the sodium and potassium indicators and then loaded with the calcium indicator.
Finally to verify the apoptotic state due to the effect of the chemical agents. The cells after exposure to the chemical agent at the detection limit are stained with Hoechst dye. The effect of the chemical induces apoptosis which can me imaged using the spectral shift that is noted with the Hoechst dye. As mentioned in literature [27, 141] a simple interpretation rests on the well-documented increased permeability of apoptotic cells to Hoescht, and if more dye permeates then some concentration-dependent dye-dye interaction may result in a red shift. This is consistent with the observation that the cells with redder emission appear only as dye loading saturates. The dye concentration is the critical parameter controlling the shift. Hence taking into account this effect 0.12 µg/ml of the stock solution is prepared for ideal imaging of the DNA alteration which is the expected effect of the chemical agent
80 |
MIHRIMAH OZKAN ET AL. |
on the nucleic material of the cell. The protocol for Hoechst is similar to the protocols for calcium, sodium and potassium staining. The patterned cells after being exposed to the chemical analyte for a period corresponding to the sensing cycle are fixed using 1.5% formaldehyde for a period of 20 minutes. The cells are then aspirated twice using 1X PBS for a period of 3 minutes each. The cells are then incubated with 100% methanol for a period of 20 minutes. Methanol is a cell permeant and it allows the easy penetration of the Hoechst dye into the cell nucleus. The function of the Hoechst dye is to bind to the diffused chromatin that is formed due to the apoptosis of the cell due to the effect of the chemical analyte. Approximately 5ml of 0.12 µg/ml Hoechst 33382 dye (Santa Cruz Biotechnology, Santa Cruz, California) is prepared from a stock solution of 0.5 µg/ml dye. The cells are incubated with the dye for a period of 30 minutes at 37˚C. The cells are then aspirated thrice with 1X PBS for a period of 2 minutes each. Hoechst dye is visualized by exciting the dye with UV (352 nm). The emission is in blue. The cells are imaged using a confocal microscope (Leica, Germany).
3.34. VISUALIZATION OF PHYSIOLOGICAL CHANGES DUE TO THE EFFECT OF THE CHEMICAL ANALYTES
3.34.1. Effect of Ethanol on Neurons
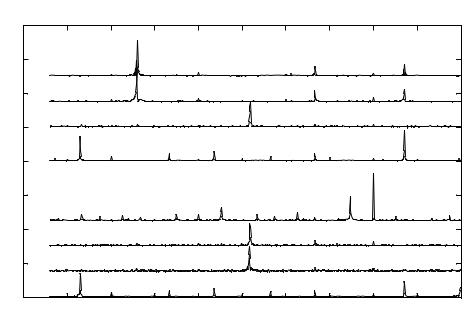
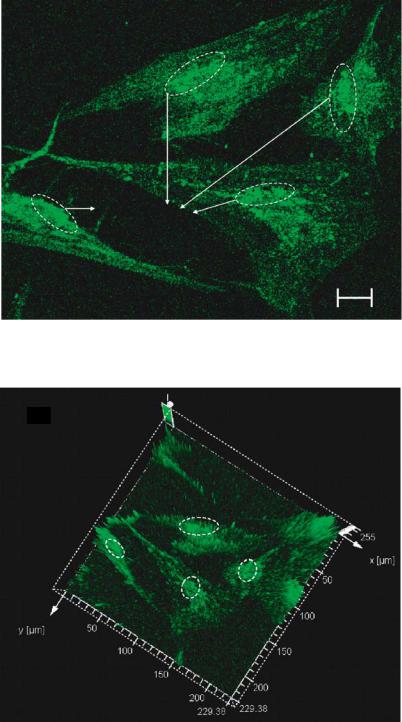
Addition of ethanol leads to its binding to M1 and M2 regions on the outside face of the GABAA and Glycine receptor gated Cl− ion channels [77]. This increases the duration of the channel openings causing a strong inhibitory ionic current associated with Cl− influx, which in turn causes the intracellular release of calcium as it has been established that intoxicating concentrations of ethanol inhibit N-methyl-d-aspartate (NMDA) receptor-dependent longterm potentiation, an interaction thought to underlie a major component of the central nervous system actions of ethanol [52]. At the cellular level this can be by fluo-3 that binds to the intracellular calcium ions released into the cytoplasm close to the nucleus. The patterned cells are exposed to 9 ppm concentration of ethanol before the immunohistochemistry procedures. Figure 3.13(a) is a confocal image of the neuron stained with fluo-3 indicating the intracellular calcium transients. Also shown in figure 3.13(b) is the three dimensional contour vector representation of the confocal image. The z axis represents the intensity profile. It shows that maximum intensity is obtained from the cytoplasm correlating to the position of the intracellular calcium transients. The Hoecsht stain indicates the dissociation of DNA associated with apoptotic state of the cells [28]. The cell death associated due to the effect of ethanol results in clumping of chromatin. Hoechst binds to the dissociated nucleic material and is visualized using confocal microscopy and is shown in figure 3.13(c).
3.34.2. Effect of Ethanol on Osteoblasts
In-vitro and in-vivo studies have shown the changes to the bone calcium density due to long term exposure to ethanol [18]. At a cellular level this translates to the presence of apoptotic bundles in the cytoplasm of the cells. The patterned cells are treated to 19ppm ethanol and then after cell fixation is incubated with fluo-3 calcium indicator that binds to free calcium ions. Figure 3.13(d) shows the location of free calcium imaged due to
(A)
Intracellular calcium transients
5 m
FIGURE 3.13(A). Physiological effect of ethanol at 9 ppm on individual neurons. The cells are stained with fluo-3 and visualized using FITC mode on Leica TCS SP2. Intracellular calcium transients are observed at the cytoplasm near the nucleus.
(B)
FIGURE 3.13(B). Three dimensional vector representtion of the fluorescence intensity. The circled areas represent the hight intensity peaks that correspond to the areas of localization of intracellular calcium transients.