


Getting Started and Creating Applications |
149 |
|
|
Chapter 7. Sample Programs
This section describes the sample programs that are included in our tool kits. The sample programs are ready for you to run. You can use the sample programs to learn how to use our tools. Additionally, you can copy the code from our samples for your own use.
The sample programs are found in the C:\KEIL\C51\EXAMPLES\ folder. Each sample program is stored in a separate folder along with project files that help you quickly build and evaluate each sample program.
The following table lists the sample programs and their folder names.
Example |
Description |
BADCODE |
Program with syntax errors and warnings. You may use the µVision2 editor to |
|
correct these. |
BANK_EX1 |
A simple code banking application. |
CSAMPLE |
Simple addition and subtraction calculator that shows how to build a multimodule |
|
project with µVision2. |
DHRY |
Dhrystone benchmark. Calculates the dhrystones factor for the target CPU. |
HELLO |
Hello World program. Try this first when you begin using µVision2. It prints Hello |
|
World on the serial interface and helps you confirm that the development tools |
|
work correctly. Refer to “HELLO: Your First 8051 C Program” on page 150 for |
|
more information about this sample program. |
MEASURE |
Data acquisition system that collects analog and digital signals. Refer to |
|
“MEASURE: A Remote Measurement System” on page 155 for more information |
|
about this sample program. |
RTX_EX1 |
Demonstrates round-robin multitasking using RTX-51 Tiny. |
RTX_EX2 |
Demonstrates an RTX-51 Tiny application that uses signals. |
SIEVE |
Benchmark that calculates prime numbers. |
TRAFFIC |
Shows how to control a traffic light using the RTX-51 Tiny real-time executive. |
WHETS |
Benchmark program that calculates the whetstones factor for the target CPU. |
To begin using one of the sample projects, use the µVision2 menu Project – |
7 |
|
Open Project and load the project file. |
||
The following sections in this chapter describe how to use the tools to build the |
|
|
following sample programs: |
|
|
|
HELLO: Your First 8051 C Program |
|
|
MEASURE: A Remote Measurement System |
|
150 |
Chapter 7. Sample Programs |
|
|
HELLO: Your First 8051 C Program
The HELLO sample program is located in C:\KEIL\C51\EXAMPLES\HELLO\ . HELLO does nothing more than print the text “Hello World” to the serial port. The entire program is contained in a single source file HELLO.C.
This small application helps you confirm that you can compile, link, and debug an application. You can perform these operations from the DOS command line, using batch files, or from µVision2 for Windows using the provided project file.
The hardware for HELLO is based on the standard 8051 CPU. The only on-chip peripheral used is the serial port. You do not actually need a target CPU because µVision2 lets you simulate the hardware required for this program.
HELLO Project File
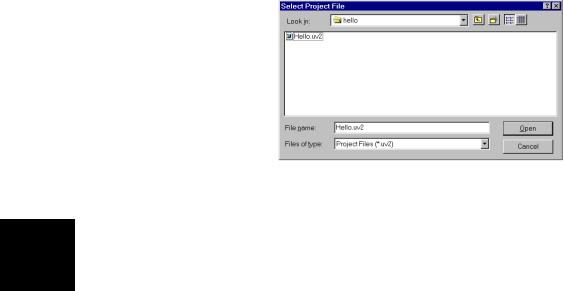
In µVision, applications are maintained in a project file. A project file has been created for HELLO. To load this project, select
Open Project from the
Project menu and open HELLO.UV2 from the folder
…\C51\EXAMPLES\HELLO.
Editing HELLO.C
7 |
You can now edit |
Project Window. |
editor window.
HELLO.C. Double click on HELLO.C in the Files page of the µVision2 loads and displays the contents of HELLO.C in an
Getting Started and Creating Applications |
151 |
|
|
 Compiling and Linking HELLO
When you are ready to compile and link your project, use the Build Target command from the Project menu or the Build toolbar. µVision2 begins to translate and link the source files and creates an absolute object module that you can load into the µVision2 debugger for testing. The status of the build process
is listed in the Build page of the Output Window.
7
NOTE
You should encounter no errors when you use µVision2 with the provided sample projects.
152 |
Chapter 7. Sample Programs |
|
|
 Testing HELLO
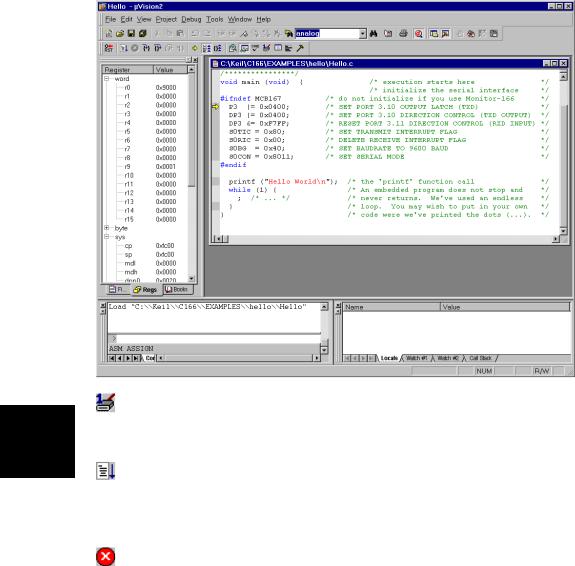
Once the HELLO program is compiled and linked, you can test it with the µVision2 debugger. In µVision2, use the Start/Stop Debug Session command from the Debug menu or toolbar. µVision2 initializes the debugger and starts program execution till the main function. The following screen displays.
Open Serial Window #1 that displays the serial output of the application with the Serial Window #1 command from the View menu or the Debug
7 toolbar.
Run HELLO with the Go command from the Debug menu or toolbar. The HELLO program executes and displays the text “Hello World” in the serial window. After HELLO outputs “Hello World,” it begins executing an endless loop.
Stop Running HELLO with the Halt command from the Debug menu or the toolbar. You may also type ESC in the Command page of the Output window.

Getting Started and Creating Applications |
153 |
|
|
During debugging µVision2 will show the following output:
Single-Stepping and Breakpoints
Use the Insert/Remove Breakpoints command from the toolbar or the local editor menu that opens with a right mouse click and set a breakpoint at the beginning of the main function.
Use the Reset CPU command from the Debug menu or toolbar. If you
have halted HELLO start program execution with Run. µVision2 will 7 stop the program at the breakpoint.
You can single-step through the HELLO program using the Step buttons in the debug toolbar. The current instruction is marked with a yellow arrow. The arrow moves each time you step
Place the mouse cursor over a variable to view their value.
You may stop debugging at any time with Start/Stop Debug Session command.

154 |
Chapter 7. Sample Programs |
|
|
command.
7
Getting Started and Creating Applications |
155 |
|
|
MEASURE: A Remote Measurement
System
The MEASURE sample program is located in the \C51\EXAMPLES\MEASURE\ folder. MEASURE runs a remote measurement system that collects analog and digital data like a data acquisition systems found in a weather stations and process control applications. MEASURE is composed of three source files:
GETLINE.C, MCOMMAND.C, and MEASURE.C.
This implementation records data from two digital ports and four A/D inputs. A timer controls the sample rate. The sample interval can be configured from
1 millisecond to 60 minutes. Each measurement saves the current time and all of the input channels to a RAM buffer.
Hardware Requirements
The hardware for MEASURE is based on the C515 CPU. This microcontroller provides analog and digital input capability. Port 4 and port 5 is used for the digital inputs and AN0 through AN3 are used for the analog inputs. You do not actually need a target CPU because µVision2 lets you simulate all the hardware required for this program.
MEASURE Project File
The project file for the MEASURE sample program is called MEASURE.UV2. To load this project file, use Open Project from the Project
menu and select MEASURE.UV2 in the folder 7
C:\KEIL\C51\EXAMPLES\MEASURE.
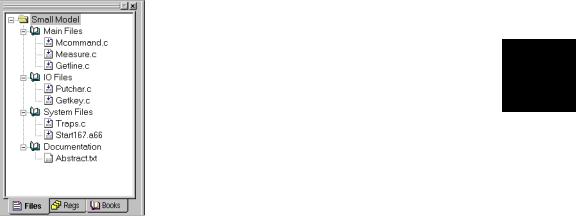
The Files page in the Project Window shows the source files that compose the MEASURE project. The three application related source files that are located in the Main Files group. The function of the source files is described below. To open a source file, double-click on the filename.

156 |
Chapter 7. Sample Programs |
|
|
The project contains several targets for different test environments. For debugging with the simulator select the target Small Model in the Build toolbar.
MEASURE.C contains the main C function for the measurement system and the interrupt routine for timer 0. The main function initializes all peripherals of the C515 and performs command processing for the system. The timer interrupt routine, timer0, manages the realtime clock and the measurement sampling of the system.
MCOMMAND.C processes the display, time, and interval commands. These functions are called from main. The display command lists the analog values in floating-point format to give a voltage between 0.00V and 5.00V.
GETLINE.C contains the command-line editor for characters received from the serial port.
 Compiling and Linking MEASURE
When you are ready to compile and link MEASURE, use the Build Target command from the Project menu or the toolbar. µVision2 begins to compile and link the source files in MEASURE and displays a message when the build is finished.
Once the project is build, you are ready to browse the symbol information or begin testing the MEASURE program.
7
Getting Started and Creating Applications |
157 |
|
|
 Browse Symbols
The MEASURE project is configured to generate full browse and debug information. To view the information, use the Source Browse command from the View menu or the toolbar. For more information refer to “Source Browser” on page 69.
 Testing MEASURE
The MEASURE sample program is designed to accept commands from the onchip serial port. If you have actual target hardware, you can use a terminal simulation to communicate with the C515 CPU. If you do not have target hardware, you can use µVision2 to simulate the hardware. You can also use the serial window in µVision2 to provide serial input.
Once the MEASURE program is build, you can test it. Use the Start/Stop Debug Session command from the Debug menu to start the µVision2 debugger.
Remote Measurement System Commands
The serial commands that MEASURE supports are listed in the following table. These commands are composed of ASCII text characters. All commands must be terminated with a carriage return. You can enter these commands in the Serial Window #1 during debugging.
Command |
Serial Text |
Description |
|
|
|
Clear |
C |
Clears the measurement record buffer. |
|
|
|
Display |
D |
Displays the current time and input values. |
|
|
|
7 |
|||||
Time |
T hh:mm:ss |
Sets the current time in 24-hour format. |
|
||
Interval |
I mm:ss.ttt |
Sets the interval time for the measurement samples. The |
|
||
|
|
interval time must be between 0:00.001 (for 1ms) and |
|
||
|
|
60:00.000 (for 60 minutes). |
|
|
|
Start |
S |
Starts the measurement recording. After receiving the start |
|
|
|
|
|
command, MEASURE samples all data inputs at the specified |
|
|
|
|
|
interval. |
|
|
|
Read |
R [count] |
Displays the recorded measurements. You may specify the |
|
|
|
|
|
number of most recent samples to display with the read |
|
|
|
|
|
command. If no count is specified, the read command |
|
|
|
|
|
transmits all recorded measurements. You can read |
|
|
|
|
|
measurements on the fly if the interval time is more than 1 |
|
|
|
|
|
second. Otherwise, the recording must be stopped. |
|
|
|
Quit |
Q |
Quits the measurement recording. |
|
|

158 |
Chapter 7. Sample Programs |
|
|
 View Program Code
µVision2 lets you view the program code in the Disassembly Window that opens with the View menu or the toolbar button. The Disassembly Window shows intermixed source and assembly lines. You may change the view mode or use other commands from the local menu that opens with the right mouse button.
 View Memory Contents
µVision2 displays memory in various formats. The Memory Window opens via the View menu or the toolbar button. You can enter the address of four different memory areas in the pages. The local
7 menu allows you to modify the memory contents or select different output formats.
Program Execution
Before you begin simulating MEASURE, open the Serial Window #1 that displays the serial output with the View menu or the Debug toolbar. You

Getting Started and Creating Applications |
159 |
|
|
may disable other windows if your screen is not large enough.
You can use the Step toolbar buttons on assembler instructions or source code lines. If the Disassembly Window is active, you single step at assembly instruction basis. If an editor window with source code is active, you single step at source code level.
The StepInto toolbar button lets you single-step through your application and into function calls.
StepOver executes a function call as single entity and is not interrupt unless a breakpoint occurs.
On occasion, you may accidentally step into a function unnecessarily. You can use StepOut to complete execution of that function and return to the statement immediately following the function call.
A yellow arrow marks the current assembly or high-level statement. You may use the you may accidentally step into a function unnecessarily. You can use StepOut to complete execution of that function and return to the statement immediately following the function call.
The toolbar or local menu command Run till Cursor Line lets you use the current cursor line as temporary breakpoint.
With Insert/Remove Breakpoints command you can set or remove breakpoints on high-level source lines or assembler statements.
 Call Stack
µVision2 internally tracks
function nesting as the 7 program executes. The Call
Stack page of the Watch Window shows the current function nesting. A double click on a line displays the source code that called the selected function.

160 |
Chapter 7. Sample Programs |
|
|
 Trace Recording
It is common during debugging to reach a breakpoint where you require information like register values and other circumstances that led to the breakpoint. If Enable/Disable Trace Recording is set you can view the CPU instructions that were executed be reaching the breakpoint. The Regs page of the Project Window shows the CPU register contents for the selected instruction.
7
Getting Started and Creating Applications |
161 |
|
|
Breakpoints Dialog
µVision2 also supports complex breakpoints as discussed on page 96. You may want to halt program execution when a variable contains a certain value. The example shows how to stop when the value 3 is written to current.time.sec.
Open the Breakpoints dialog from the Debug menu. Enter as expression current.time.sec==3. Select the Write check box (this option specifies that the break condition is tested only when the expression is written to). Click on the Define button to set the breakpoint.
To test the breakpoint condition perform the following steps:
Reset CPU.
If program execution is halted begin executing the MEASURE program.
After a few seconds, µVision2 halts execution. The program counter line in the |
7 |
debug window marks the line in which the breakpoint occurred. |
162 |
Chapter 7. Sample Programs |
|
|
 Watch Variables
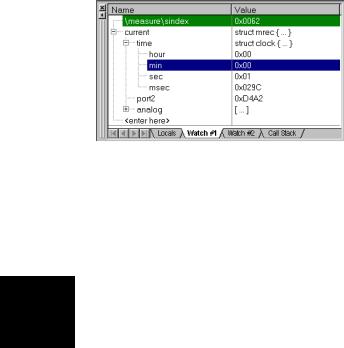
You may constantly view the contents of variables, structures, and arrays. Open the Watch Window from the View menu or with the toolbar. The Locals page shows all local symbols of the current function. The Watch #1 and Watch #2 pages allow you to enter any program variables as described in the following:
Select the text <enter here> with a mouse click and wait a second. Another mouse click enters edit mode that allows you to add variables. In the same way you can modify variable values.
Select a variable name in an Editor Window and open the local menu with a right mouse click and use the command Add to Watch Window.
You can enter WatchSet in the Output Window – Command page.
To remove a variable, click on the line and press the Delete key.
Structures and arrays open on demand when you click on the [+] symbol. Display lines are indented to reflect the nesting level.
The Watch Window updates at the end of each execution command. You enable may enable Periodic Window Update in the View menu to update the watch window during program execution.
7

Getting Started and Creating Applications |
163 |
|
|
Viewing and Modifying On-Chip Peripherals
µVision2 provides several ways to view and modify the on-chip peripherals used in your target program. You may directly view the results of the example below when you perform the following steps:
Reset CPU and kill all defined breakpoints.
If program execution is halted begin executing the MEASURE program.
Open the Serial Window #1 and enter the ‘d’ command for the MEASURE application. MEASURE shows the values from I/O Port2 and A/D input 0 – 3. The Serial Window shows the following output:
You may now use the following procedures to supply input to the I/O pins.
7
164 |
Chapter 7. Sample Programs |
|
|
Using Peripheral Dialog Boxes
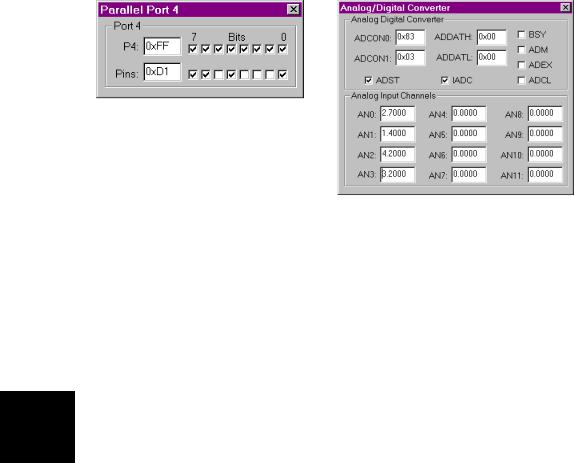
µVision2 provides dialogs for: I/O Ports, Interrupts, Timers, A/D Converter, Serial Ports, and chip-specific peripherals. These dialogs can be opened from the Debug menu. For the MEASURE application you may open I/O Ports:Port4 and A/D Converter. The dialogs show the current status of the peripherals and you may directly change the input values.
Each of these dialogs lists the related SFR symbols and shows the current status of the peripherals. To change the inputs, change the values of the Pins or Analog Input Channels.
Using VTREG Symbols
You may use the “CPU Pin Registers (VTREGs)” described on page 114 to change input signals. In the Command page of the Output Window, you may make assignments to the VTREG symbols just like variables and registers. For example:
PORT4=0xDA |
set digital input PORT4 to 0xDA. |
AIN1=3.3 |
set analog input AIN1 to 3.3 volts. |
7
Getting Started and Creating Applications |
165 |
|
|
Using User and Signal Functions
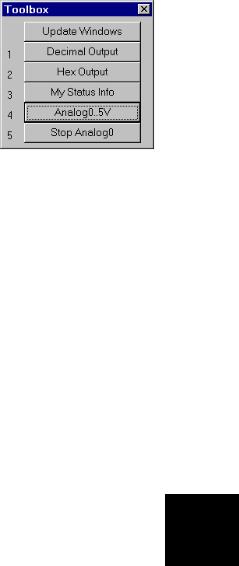
You may combine the use of VTREG symbols defined by the CPU driver and µVision2 user and signal functions to create a sophisticated method of providing external input to your target programs. The “Analog Example” on page 146 shows a signal function that provides input to AIN0. The signal function is included in the MEASURE example and may be quickly invoked with the Toolbox button Analog0..5V and changes constantly the voltage on the input AIN0.
7

166 |
Chapter 7. Sample Programs |
|
|
Using the Performance Analyzer
µVision2 lets you perform timing analysis of your applications using the integrated performance analyzer. To prepare for timing analysis, halt program execution and open the Setup Performance Analyzer dialog with the Debug menu.
You may specify the function names dialog box available from the Setup menu.
Perform the following steps to see the performance analyzer in action:
Open the Performance Analyzer using the View menu or toolbar.
Reset CPU and kill all breakpoints.
If program execution is halted begin executing the MEASURE program.
Select the Serial Window #1 and type the commands S Enter D Enter
7

Getting Started and Creating Applications |
167 |
|
|
The Performance Analyzer shows a bar graph for each range. The bar graph shows the percent of the time spent executing code in each range. Click on the range to see detailed timing statistics. Refer to page 103 for more information.
The MEASURE application may be also tested on a Keil MCB517 board or other C515 or C517 starter kits. Refer to “Debugging with Monitor-51” on page 209.
7