


Getting Started and Creating Applications |
93 |
|
|
Chapter 5. Testing Programs
µVision2 Debugger
You can use µVision2 Debugger to test the applications you develop using the C51 Compiler and A51 macro assembler. The µVision2 Debugger offers two operating modes that are selected in the Options for Target – Debug dialog:
Use Simulator allows you to configure the µVision2 Debugger as software-only product that simulates most features of the 8051 microcontroller family without actually having target hardware. You can test and debug your embedded application before the hardware is ready. µVision2 simulates a wide variety of peripherals including the serial port, external I/O, and timers. The peripheral set is selected when you select a CPU from the device database for your target.
Use Advance GDI drivers, like Keil Monitor 51 interface. With the Advanced GDI interface you may connect the environment directly to emulators or the Keil Monitor program. For more information refer to “Chapter 11. Using Monitor-51” on page 199.
5

94 |
Chapter 5. Testing Programs |
|
|
CPU Simulation
µVision2 simulates up to 16 Mbytes of memory from which areas can be mapped for read, write, or code execution access. The µVision2 simulator traps and reports illegal memory accesses.
In addition to memory mapping, the simulator also provides support for the integrated peripherals of the various 8051 derivatives. The on-chip peripherals of the CPU you have selected are configured from the Device Database selection you have made when you create your project target. Refer to page 58 for more information about selecting a device.
You may select and display the on-chip peripheral components using the Debug menu. You can also change the aspects of each peripheral using the controls in the dialog boxes.
 Start Debugging
You start the debug mode of µVision2 with the Debug – Start/Stop Debug Session command. Depending on the Options for Target – Debug
5 configuration, µVision2 will load the application program and run the startup code. For information about the configuration of the µVision2 debugger refer to page 101. µVision2 saves the editor screen layout and restores the screen layout of the last debug session. If the program execution stops, µVision2 opens an editor window with the source text or shows CPU instructions in the disassembly window. The next executable statement is marked with a yellow arrow.
During debugging, most editor features are still available. For example, you can use the find command or correct program errors. Program source text of your application is shown in the same windows. The µVision2 debug mode differs from the edit mode in the following aspects:
The “Debug Menu and Debug Commands” described on page 28 are available. The additional debug windows are discussed in the following.
The project structure or tool parameters cannot be modified. All build commands are disabled.
Getting Started and Creating Applications |
95 |
|
|
 Disassembly Window
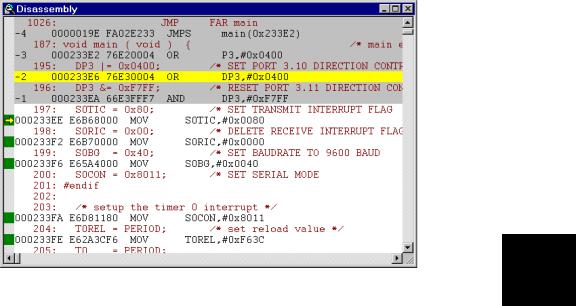
The Disassembly window shows your target program as mixed source and assembly program or just assembly code. A trace history of previously executed instructions may be displayed with Debug – View Trace Records. To enable the trace history, set Debug – Enable/Disable Trace Recording.
5
If you select the Disassembly Window as the active window all program step commands work on CPU instruction level rather than program source lines. You can select a text line and set or modify code breakpoints using toolbar buttons or the context menu commands.
You may use the dialog Debug – Inline Assembly… to modify the CPU instructions. That allows you to correct mistakes or to make temporary changes to the target program you are debugging.
96 Chapter 5. Testing Programs
|
|
Breakpoints |
|
µVision2 lets you define breakpoints in several different ways. You may already |
|
|
set Execution Breaks during editing of your source text, even before the |
|
|
program code is translated. Breakpoints can be defined and modified in the |
|
|
following ways: |
|
|
|
With the File Toolbar buttons. Just select the code line in the Editor or |
|
|
Disassembly window and click on the breakpoint buttons. |
|
|
With the breakpoint commands in the local menu. The local menu opens |
|
|
with a right mouse click on the code line in the Editor or Disassembly |
|
|
window. |
|
|
The Debug – Breakpoints… dialog lets you review, define and modify |
|
|
breakpoint settings. This dialog allows you to define also access breakpoints |
|
|
with different attributes. Refer to the examples below. |
|
|
In the Output Window – Command page you can use the BreakSet, |
|
|
BreakKill, BreakList, BreakEnable, and BreakDisable commands. |
|
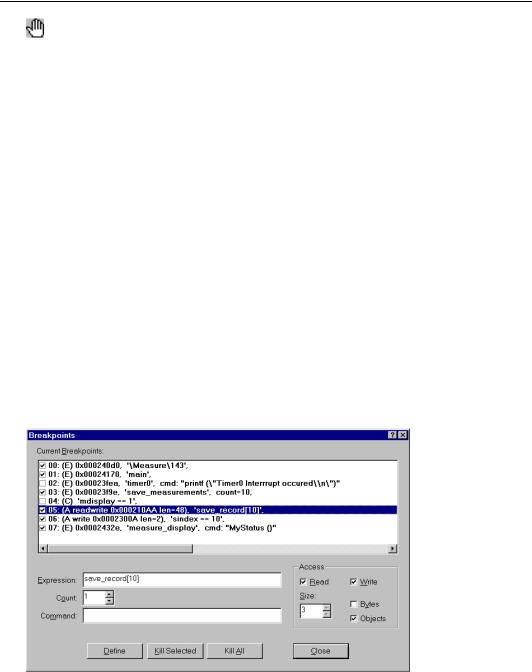
The Breakpoint dialog lets you view and modify breakpoints. You can quickly |
|
|
disable or enable the breakpoints with a mouse click on the check box in the |
|
5 |
Current Breakpoints list. A double click in the Current Breakpoints list |
|
allows you to modify the selected break definition. |
||
|
|
|

Getting Started and Creating Applications |
97 |
|
|
You define a breakpoint by entering an Expression in the Breakpoint dialog. Depending on the expression one of the following breakpoint types is defined:
When the expression is a code address, an Execution Break (E) is defined that becomes active when the specified code address is reached. The code address must refer to the first byte of a CPU instruction.
When a memory Access (Read, Write or both) is selected an Access Break
(A)is defined that becomes active when the specified memory access occurs. You can specify the size of the memory access window in bytes or object size of the expression. Expressions for an Access Break must reduce to a memory address and memory type. The operators (&, &&, <. <=. >, >=, = =, and !=) can be used to compare the variable values before the Access Break halts program execution or executes the Command.
When the expression cannot be reduced to an address a Conditional Break
(C)is defined that becomes active when the specified conditional expression becomes true. The conditional expression is recalculated after each CPU instruction, therefore the program execution speed may slow down considerably.
When you specify a Command for a breakpoint, µVision2 executes the command and resumes executing your target program. The command you specify here may be a µVision2 debug or signal function. To halt program
execution in a µVision2 function, set the _break_ system variable. For more 5 information refer to “System Variables” on page 113.
The Count value specifies the number of times the breakpoint expression is true before the breakpoint is triggered.
Breakpoint Examples:
The following description explains the definitions in the Breakpoint dialog shown above. The Current Breakpoints list summarizes the breakpoint type and the physical address along with the Expression, Command and Count.
Expression: \Measure\143
Execution Break (E) that halts when the target program reaches the code line 143 in the module MEASURE.
Expression: main
Execution Break (E) that halts when the target program reaches the main function.

98 |
|
Chapter 5. Testing Programs |
|
|
|
|
|
|
|
|
|
|
Expression: timer0 |
Command: printf ("Timer0 Interrupt occurred\n") |
|
Execution Break (E) that prints the text "Timer0 Interrupt occurred" in the Output Window – Command page when the target program reaches the timer0 function. This breakpoint is disable in the above Breakpoint dialog.
Expression: save_measurements Count: 10
Execution Break (E) that halts when the target program reaches the function save_measurements the 10th time.
Expression: mcommand == 1
Contional Break (C) that halts program execution when the expression mcommand = = 1 becomes true. This breakpoint is disable in the above Breakpoint dialog.
Expression: save_record[10] Access: Read Write Size: 3 Objects
Access Break (A) that halts program execution when an read or write access occurs to save_record[10] and the following 2 objects. Since save_record is a structure with size 16 bytes this break defines an access region of 48 bytes.
5 |
|
Expression: |
sindex == 10 |
Access: |
Write |
|
Access Break (A) that halts program execution when the value 10 is written to |
||||
|
the variable sindex. |
|
|
||
|
|
|
|
|
|
|
|
|
|
|
|
|
|
Expression: |
measure_display |
Command: |
MyStatus () |
Execution Break (E) that executes the µVision2 debug function MyStatus when the target program reaches the function measure_display. The target program execution resumes after the debug function MyStatus has been executed.
Getting Started and Creating Applications |
99 |
|
|
 Target Program Execution
µVision2 lets execute your application program in several different ways:
With the Debug Toolbar buttons and the “Debug Menu and Debug Commands” as described on page 28.
With the Run till Cursor line command in the local menu. The local menu opens with a right mouse click on the code line in the Editor or Disassembly window.
In the Output Window – Command page you can use the Go, Ostep, Pstep, and Tstep commands.
 Watch Window
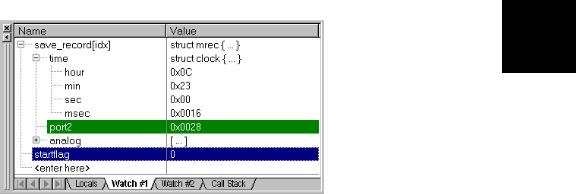
The Watch window lets you view and modify program variables and lists the current function call nesting. The contents of the Watch Window are automatically updated whenever program execution stops. You can enable View
– Periodic Window Update to update variable values while a target program is running.
5
The Locals page shows all local function variables of the current function. The Watch pages display user-specify program variables. You add variables in three different ways:
Select the text <enter here> with a mouse click and wait a second. Another mouse click enters edit mode that allows you to add variables. In the same way you can modify variable values.
In an editor window open the context menu with a right mouse click and use Add to Watch Window. µVision2 automatically selects the variable name

100 |
Chapter 5. Testing Programs |
|
|
under the cursor position, alternatively you may mark an expression before using that command.
In the Output Window – Command page you can use the WatchSet command to enter variable names.
To remove a variable, click on the line and press the Delete key.
The current function call nesting is shown in the Call Stack page. You can double click on a line to show the invocation an editor window.
 CPU Registers
The CPU registers are displayed and Project Window – Regs page and can be modified in the same way as variables in the Watch Window.
 Memory Window
The Memory window displays the contents of the various memory areas. Up to 5 four different areas can be review in the different pages. The context menu
allows you to select the output format.
In the Address field of the Memory Window, you can enter any expression that evaluates to a start address of the area you want to display. To change the memory contents, double click on a value. This opens an edit box that allows you to enter new memory values. To update the memory window while a target program is running enable View – Periodic Window Update.
Getting Started and Creating Applications |
101 |
|
|
 Toolbox
The Toolbox contains user-configurable buttons. Click on a Toolbox button to execute the associated command. Toolbox buttons may be executed at any time, even while running the test program.
Toolbox buttons are defined in the Output
Window – Command page with the DEFINE
BUTTON command. The general syntax is:
>DEFINE BUTTON "button_label", "command"
button_label is the name to display on the button in the Toolbox.
command is the µVision2 command to execute when the button is pressed.
The following examples show the define commands used to create the buttons in the Toolbox shown above:
>DEFINE BUTTON "Decimal Output", "radix=0x0A" |
|
|
|
>DEFINE BUTTON "Hex Output", "radix=0x10" |
|
|
|
>DEFINE BUTTON "My Status Info", "MyStatus ()" |
/* call debug function */ |
|
|
>DEFINE BUTTON "Analog0..5V", "analog0 ()" |
/* call signal function */ |
5 |
|
>DEFINE BUTTON "Show R15", "printf (\"R15=%04XH\\n\")" |
|||
|
|||
NOTE
The printf command defined in the last button definition shown above introduces nested strings. The double quote (") and backslash (\) characters of the format string must be escaped with \ to avoid syntax errors.
You may remove a Toolbox button with the KILL BUTTON command and the button number. For example:
>Kill Button 5 /* Remove Show R15 button */
NOTE
The Update Windows button in the Toolbox is created automatically and cannot be removed. The Update Windows button updates several debug windows during program execution.

102 |
Chapter 5. Testing Programs |
|
|
 Set Debug Options
The dialog Options for Target - Debug configures the µVision2 debugger.
5 |
|
The following table describes the options of the Debug dialog page: |
|
|
|
Dialog Item |
Description |
|
|
|
|
|
|
Use Simulator |
Select the µVision2 Simulator as Debug engine. |
|
|
Use Keil Monitor-51 |
Select the Advanced GDI driver to connect to your debug hardware. The |
|
|
Driver |
Keil Monitor-51 Driver allows you to connect a target board with the Keil |
|
|
|
Monitor. There are µVision2 emulator and OCDS drivers in preparation. |
|
|
Settings |
Opens the configuration dialog of the selected Advanced GDI driver. |
|
|
Other dialog options are available separately for the Simulator and Advanced GDI section. |
|
|
|
Load Application at |
Enable this option to load your target application automatically when you |
|
|
Startup |
start the µVision2 debugger. |
|
|
Go till main () |
Start program execution till the main label when you start the debugger. |
|
|
Initialization File |
Process the specified file as command input when starting a debug |
|
|
|
session. |
|
|
Breakpoints |
Restore breakpoint settings from the previous debug session. |
|
|
Toolbox |
Restore toolbox buttons from the previous debug session. |
|
|
Watchpoints & PA |
Restore Watchpoint and Performance Analyzer settings from the previous |
|
|
|
debug session. |
|
|
Memory Display |
Restore the memory display settings from the previous debug session. |
|
|
CPU DLL |
Configures the internal µVision2 debug DLLs. The settings are taken from |
|
|
Driver DLL |
the device database. Please do not modify the DLL or DLL parameters. |
|
|
Parameter |
|
Getting Started and Creating Applications |
103 |
|
|
 Serial Window
µVision2 provides two Serial Windows for serial input and output. Serial data output from the simulated CPU is displayed in this window. Characters you type in the Serial Window are input to the simulated CPU.
This lets you simulate the CPU’s UART without the need for external hardware. |
|
|
The serial output may be also assigned to a PC COM port using the ASSIGN |
5 |
|
command in the Output Window – Command page. |
||
|
||
|
|
 Performance Analyzer
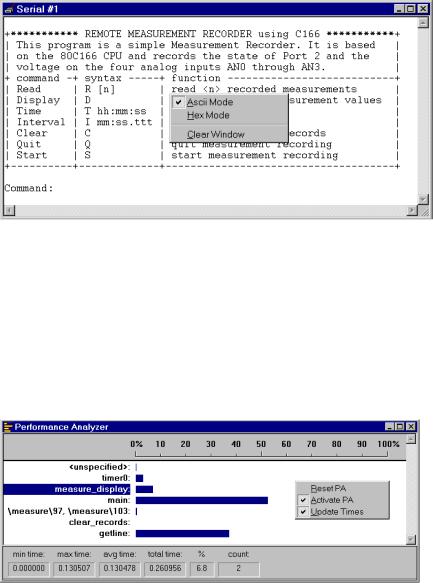
The µVision2 Performance Analyzer displays the execution time recorded for functions and address ranges you specify.

104 |
Chapter 5. Testing Programs |
|
|
The <unspecified> address range is automatically generated. It shows the amount of time spent executing code that is not included in the specified functions or address ranges.
Results display as bar graphs. Information such as invocation count, minimum time, maximum time, and average time is displayed for the selected function or address range. Each of these statistics is described in the following table.
Label |
Description |
min time |
The minimum time spent in the selected address range or function. |
max time |
The maximum time spent in the selected address range or function. |
avg time |
The average time spent in the selected address range or function. |
total time |
The total time spent in the selected address range or function. |
% |
The percent of the total time spent in the selected address range or function. |
count |
The total number of times the selected address range or function was |
|
executed. |
To setup the Performance Analyzer use the menu command Debug – Performance Analyzer. You may enter the PA command in the command window to setup ranges or print results.
5 |
Code Coverage |
|
|
The µVision2 debugger provides a code coverage function that marks the code that has been executed. In the debug window, lines of code that have been executed are market green in the left column. You can use this feature when you test your embedded application to determine the sections of code that have not yet been exercised.

Getting Started and Creating Applications |
105 |
|
|
The Code Coverage dialog provides information and statistics. You can output this information in the
Output Window – Command page using the COVERAGE command.
Memory Map |
|
|
The Memory Map dialog box lets you specify the memory areas your target |
|
|
program uses for data storage and program execution. You may also configure |
|
|
the target program’s memory map using the MAP command. |
|
|
When you load a target application, µVision2 automatically maps all address |
|
|
ranges of your application. Typically it is not required to map additional address |
|
|
5 |
||
ranges. You need to map only memory areas that are accessed without explicit |
||
variable declarations, i.e. memory mapped I/O space. |
||
|
||
The dialog opens via the menu |
|
|
|
||
Debug – Memory Map… |
|
|
As your target program runs, |
|
|
µVision2 uses the memory map to |
|
|
verify that your program does not |
|
|
access invalid memory areas. For |
|
|
each memory range, you may |
|
|
specify the access method: Read, |
|
|
Write, Execute, or a combination. |
|

106 |
Chapter 5. Testing Programs |
|
|
View – Symbols Window
The Symbols Window displays public symbols, local symbols, line number information, and CPU-specific SFRs defined in the currently loaded application.
5 |
|
You may select the symbol type and filter symbols displayed. |
|
|||
|
|
|
|
|
|
|
|
Options |
|
Description |
|
|
|
|
|
Mode |
|
select PUBLIC, LOCALS or LINE. Public symbols have application-wide |
|
|
|
|
|
|
scope. The scope of local symbols is limited to a module or function. Lines |
|
|
|
|
|
|
refer to the line number information of the source text. |
|
|
|
|
Current Module |
|
select the source module where information should be displayed. |
|
|
|
|
Mask |
|
specify a mask that is used to match symbol names. The mask may consist |
|
|
|
|
|
|
of alphanumeric characters plus mask characters: |
|
|
|
|
|
|
# |
matches a digit (0 – 9) |
|
|
|
|
|
$ |
matches any character |
|
|
|
|
|
* |
matches zero or more characters. |
|
|
|
Apply |
|
applies the mask and displays the update symbol list. |
|
|
|
|
|
|
|
|
|
The following table provides a few examples of masks for symbol name.
Mask Matches symbol names …
* Matches any symbol. This is the default mask in the Symbol Browser.
*#* … that contain one digit in any position.
_a$#* … with an underline, followed by the letter a, followed by any character, followed by a digit, ending with zero or more characters. For example, _ab1 or _a10value.
_*ABC … with an underline, followed by zero or more characters, followed by ABC.