

5.4 Supplementary Reading Texts
LOG FTC
The controller has one more tool at his/her disposal when the intensity of the precipitation returns begin to overwhelm even the CP function. We can activate two other circuits which are called background video circuits and LOG FTC. LOG FTC stands for logarithmic fast time constant and an exact discussion of how these systems align radar returns to eliminate weather areas is way above my head. In terms of what a controller sees on the radar scope when these circuits are activated however, the results are dramatic. This circuitry electronically outlines me strongest edges of the areas of precipitation and reduces or eliminates returns from the areas inside those outlines. Here again, the radar simply does not depict the weaker of these returns and only the strongest passively reflected target, usually the reply from an aircraft, will be displayed on the controller's scope inside the area.
Answer the questions.
1. When does the controller have one more tool at his/ her disposal?
2. What can be activated?
3. What does LOG FTC stand for?
4. What is it function?
5. What doesn’t the radar depict?
6. What will be displayed on the controller’s scope?
Attenuation
ATC radar has one more difficulty with the depiction of weather areas that is perhaps the most potentially dangerous of all of its limitations. Referred to as attenuation, it is a situation where one weather area effectively hides behind another. When a very intense area of precipitation is depicted on our radar display, it is entirely possible that most or all of the radar energy emitted in that direction is being reflected or absorbed by this system. Given this possibility, if a second weather cell exists outside of the first and in a direct line between the radar antenna and the one that is reflecting, all of the radar energy, little if any of this second cell would be displayed. To give you an example of how this situation could develop, let's consider the following possibility.
Some of the most devastating weather phenomena that a pilot can encounter are squall lines. These sometimes massive systems can block an area hundreds of miles wide across a pilot's flight path. Rather than fly the extra distance, many pilots will look for a soft spot or gap between two thunderstorms and attempt to cross the squall line at that point. If we were to build a hypothetical squall line we could begin by suggesting that a solid line of thunderstorms existed along an arc that was 35 miles west and northwest of the radar antenna (SEE FIGURE). Let's further define this system by saying that the thunderstorm line was depicted between the 270-degree bearing and the 330-degree bearing on our scope. This type of weather system is usually very prominently displayed on our radar and looks like a straight-line series of light-colored blobs on a green background.
Now let's place a small slow-moving but very intense area of weather at a point 10 miles from the antenna on a 300-degree bearing. This small area is being reduced by a combination of the MTI and CP functions and may not appear as a particularly intense weather area on the controller's radar display. If this cell
is strong enough though, it could easily reflect or absorb the majority of the radar energy directed in its path.
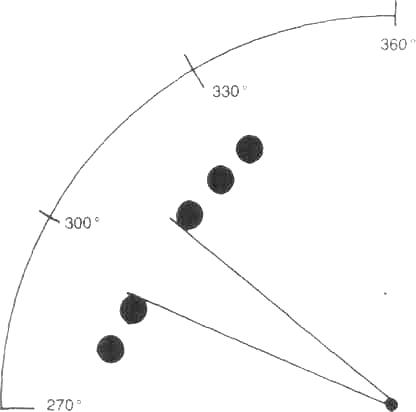
A nearby thunderstorm can ' 'block out'' coverage of more distant areas and weather systems. This phenomenon is known as attenuation.
The resultant display of the weather on the controller's radar scope will show what appears to be a gap in that solid line of weather located at approximately the 300-degree bearing and 35 miles from the antenna. This position is in a direct line from the radar antenna through our small, but not very well displayed weather cell. In reality this may actually be where the most intense area of weather associated with that entire system is located and this sucker hole could easily claim anyone foolish enough to fly through that point. If you ever get the chance, read the National Transportation Safety Board's accident investigation report (AAR-78-03) on Southern Airways Flight 242 which crashed in northwest Georgia after encountering extremely heavy hail in a weather area much like I have just described.
If only for this reason, controllers are very reluctant to accept the responsibility for vectoring aircraft through areas of precipitation or places which appear to be gaps in those areas of precipitation. When pilots ask us to do this, we often go into a long, drawn-out explanation qualifying our information or explaining why we cannot comply with their request. Pilots need to learn, and keep uppermost in their minds, the fact that the controller may not depict all of the weather areas that exist in their environment. We will certainly tell you about what we see, but, as you can tell from the above example, that is not always all of the information you need to make an informed decision.
Answer the questions.
1. What does ”attenuation” mean?
2. What is possible when a very intense area of precipitation is depicted on the radar display?
3. What would be displayed if a second weather cell exists outside of the first?
4. What is the most devastating phenomena that a pilot can encounter?
5. What can these massive systems do?
6. What will pilots do in such situations?
7. What could we suggest to build a hypothetical squall line?
8. What does this type of weather system look like on the radar?
9. Why are controllers very reluctant to accept the responsibility for vectoring aircraft through areas of precipitation?
10. What do controllers do, when the pilots ask them to direct aircraft through areas of precipitation?