

Airways - Miscellaneous Charts
Atlantic Polar High Altitude
En Route Chart 5AT(HI) - Introduction
This chart is used primarily for planning routes and high altitude polar navigation between Europe and North America. All operations between Europe and the Canadian Arctic Control Area, between FL280 and FL390 inclusive, are strongly recommended to flight plan in accordance with the POLAR TRACK STRUCTURE (PTS) during:
•1200 - 1800Z for traffic to Alaska.
•0000 - 0600Z for traffic to Europe.
Reference: NORTH ATLANTIC MINIMUM NAVIGATION PERFORMANCE SPECIFICATION (MNPS) AIRSPACE MANUAL EIGHTH EDITION states that:
The PTS consists of 10 fixed tracks in the Reykjavik Control Area (CTA) and 5 fixed tracks through Bodø Oceanic Control Area (OCA), which are a continuation of the relevant PTS tracks in the Reykjavik CTA.
Projection
Its projection is POLAR STEREOGRAPHIC:
•Bearings are correct.
•Great Circles are straight lines in Polar Regions.
•Scale is constant and correct in Polar Regions.
Track Direction/Magnetic Variation/Distance
Track direction is given or measured as: TRUE (T), MAGNETIC (M), GRID (G). Grid navigation is covered later in the chapter.
The lines of equal magnetic variation, isogonals, are valid for 1995. On this chart the North Magnetic Pole is located approximately at N78 W100. There is a rapid change of magnetic variation in this area and the directive force, which aligns a compass needle with the magnetic meridian, reduces to zero as the magnetic pole is approached. Thus, in high latitudes magnetic reference for direction is impractical. Also, VOR beacons cannot be referenced to local magnetic north.
Example:
Resolute Bay VOR, 112.1 MHz, YRB (N7443.7 W09455.4) is aligned with local true north.
Distances are printed parallel to the track segments. Other distances can be measured using the nearest meridian scale, or the scale printed at the top, left and right edges of the chart.
Note that 1inch = 100 NM.
11
Airways - Miscellaneous Charts 11
185
11 Airways - Miscellaneous Charts
Example 1
STN(N5812.4 W00611.0) UN615, MATIK(N6100.0 W00804.0) PTS 1, N6600.0 W01230.0 [66PR].
a. The Magnetic track and distance STN to MATIK is .........................
b. The Magnetic track MATIK to STN is ...................
c. The True track and distance MATIK to [66PR] are ..........................
d. The True track [66PR] to MATIK is ...................
e. The Grid track and mean magnetic variation MATIK to [66PR] are .......................
f. The Grid track and distance [66PR] to MATIK are ........................
Charts Miscellaneous - Airways 11
Example 2
a. The magnetic variation at KARLL(N7000.0 W15100.0) is .................
b. The magnetic variation at EUREKA NDB, YEU, 205 kHz (N7959.5 W08553.9) is ................
It can be seen that on the sector MATIK to [66PR] the return track 156°(T) is not a reciprocal of the outbound track 340°(T). However, the return track 169°(G) is almost the reciprocal of the outbound 348°(G). (The 1° difference is due to the fact that the track between the two points is not a straight line).
Therefore, to measure and fly a track that has an unchanging direction GRID NORTH must be used as the datum.
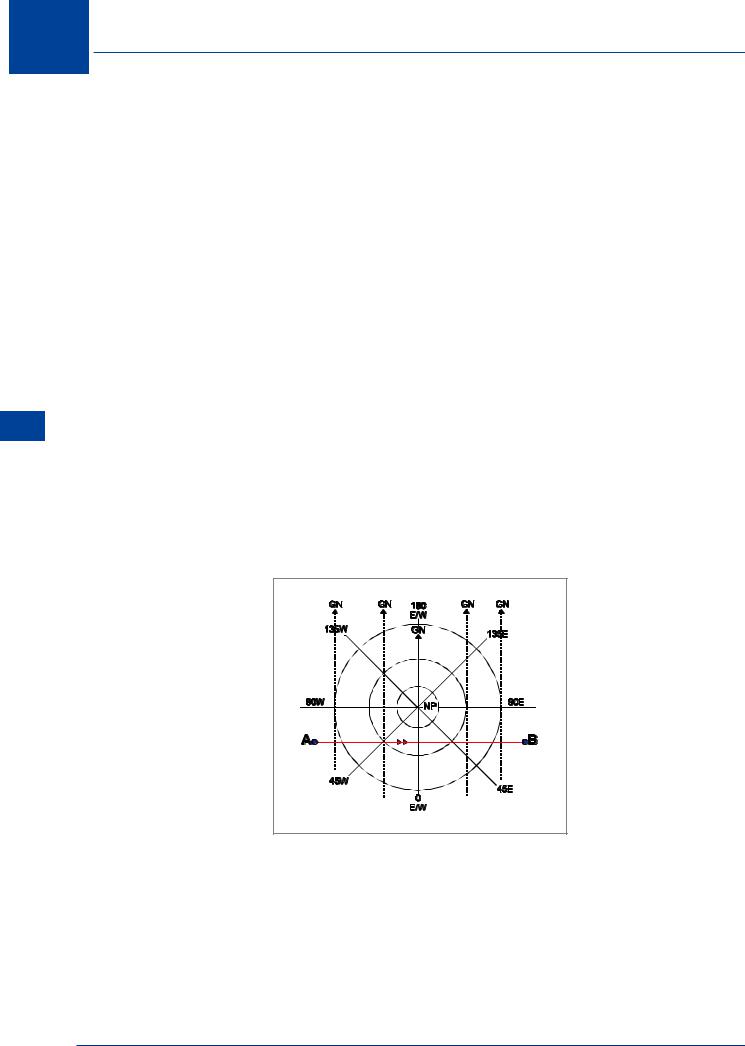
Figure 11.1 North Polar stereographic chart
186

Airways - Miscellaneous Charts 11
Grid Navigation
The use of true and/or magnetic references for navigation in high latitudes is impractical due to:
•The rapid convergence of the meridians as latitude increases causing true track direction to change rapidly over short distances.
•The rapid change of magnetic variation over short distances.
•The degraded directional capability of magnetic compasses.
Therefore, to measure and maintain a track that has a constant direction GRID NORTH is used as a datum.
On this chart (and similar Polar Stereographic charts) the Greenwich Meridian is selected as the grid north datum; it is highlighted by a thick blue line and paralleled East and West at 300 NM intervals.
Example 3
(Reference Jeppesen chart 5AT(HI))
Track from A (N8500.0 E04000.0) to B (N8500.0 W04000.0).
a.The true track direction at A is ..................
b.The true track direction at N8500 E/W0000 is ..............
c. |
The true track into B is ................ |
(Note the change of direction over 388 NM) |
To obtain a constant track direction the grid north datum is used.
d.The grid track A to B is .................
The angular difference between True and Grid direction at any point on a grid chart is known as Convergence:
TRUE NORTH - WEST OF GRID NORTH = WESTERLY CONVERGENCE.
TRUE NORTH - EAST OF GRID NORTH = EASTERLY CONVERGENCE.
Hence:
CONVERGENCE WEST, TRUE BEST (GRID LEAST)
CONVERGENCE EAST, TRUE LEAST (GRID BEST)
Conveniently, on a POLAR STEREOGRAPHIC chart:
CONVERGENCE = LONGITUDE WITH SIGN CHANGED
Airways - Miscellaneous Charts 11
187

11
Charts Miscellaneous - Airways 11
Airways - Miscellaneous Charts
Thus with reference to Figure 11.1:
LONGITUDE at A = 40°E = 40°W CONVERGENCE
LONGITUDE at B = 40°W = 40°E CONVERGENCE
Therefore:
The Grid Track at A (Longitude 40°E) = 310°(T) - 40°W Convergence = 270°(G). The Grid Track into B (Longitude 40°W) = 230°(T) + 40°E Convergence = 270°(G). Where the track crosses the Greenwich Meridian Convergence = 0°.
True and Grid tracks are the same - 270°
The bottom right-hand corner of panel 9 of the chart provides a simplified method of calculating a GRID BEARING:
+LONGITUDE WEST
GRID BEARING = TRUE BEARING
-LONGITUDE EAST
188