

Micro-Cap v7.1.6 / RM
.PDFThe Transfer Function Analysis Limits dialog box
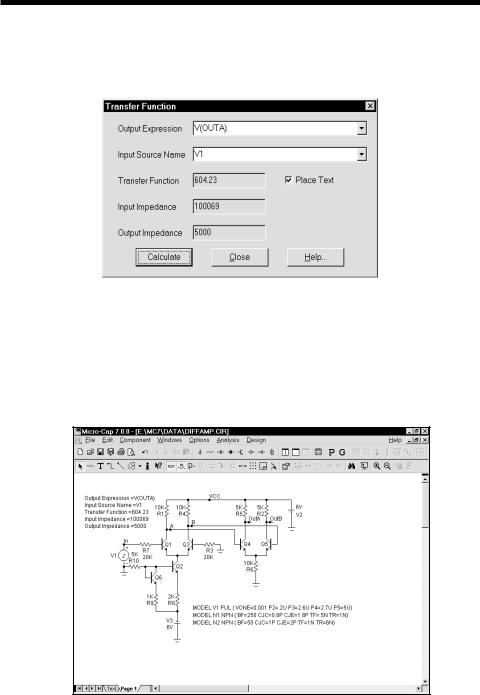
To illustrate how this type of analysis works, load the file DIFFAMP. Select Transfer Function from the Analysis menu. The dialog box looks like this:
Figure 10-1 The Transfer Function dialog box
The dialog box provides the following input fields:
•Output Expression: This is where you specify the desired output expression. It can be any legal expression involving any number of DC time-domain variables and functions. Usually it's a simple expression like V(A,B) or I(R1).
•Input Source Name: This is the part name of the input source.
The results are placed in these fields:
•Transfer Function: This is the field where the program places the result of the transfer function calculation.
•Input Impedance: This is the field where the program places the result of the input impedance calculation.
•Output Impedance: This is the field where the program places the result of the output impedance calculation.
There is also a field called "Place Text". If this box is checked, then the numeric results are placed into the schematic as grid text.
157
A sample of transfer function analysis
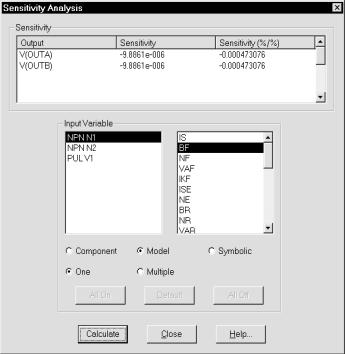
To illustrate, make sure the Place Text option is selected, then click on the Calculate button. The display should look like this:
Figure 10-2 The analysis results
MC7 solved for the transfer function and impedances and printed the results in the dialog box. If you run DC analysis and manually calculate the small-signal DC transfer function, you will get the same result, though it will take longer to set up. Click on the Close button. Notice that the program added a piece of grid text describing the results of the transfer function analysis to the schematic
Figure 10-3 The annotated schematic
158 Chapter 10: Transfer Function Analysis

Chapter 11 SensitivityAnalysis
What's in this chapter
This chapter describes the features of Sensitivity analysis. This analysis mode calculates the DC sensitivity of one or more output expressions to one or more circuit parameters.
The principal topics described in this chapter include:
•What happens in Sensitivity analysis
•The Sensitivity analysis dialog box
•A Sample of Sensitivity analysis
159

What happens in sensitivity analysis
Sensitivity analysis calculates the small-signal DC sensitivity of one or more output expressions to one or more input variables. Sensitivity is defined as:
Change in an output expression / Small change in an input variable
The "Small change" part is important, as the intention is to approximate the value of the derivative at the nominal operating point. Accordingly, a change of 1E-6*Value, or 1U if the value is zero, is used.
Sensitivity analysis is like transfer function analysis, except that it calculates the sensitivity of almost any DC expression to any variable that can be stepped. Transfer function analysis, by contrast, only calculates the DC sensitivity of expressions to the value of input DC source values.
Sensitivity analysis can calculate a great many quantities depending upon the choices made in the dialog box. You can choose one input parameter or you can choose many. If you choose many, and opt for all parameters, the program may grind away for a long time, so choose wisely. If you select the All On and Model options, for example, each MOSFET level 1-3 model will require 51 operating point calculations, and the MOSFET level 5-8 will require several hundred.
160 Chapter 11: Sensitivity Analysis

The Sensitivity Analysis Limits dialog box
To illustrate how this type of analysis works, load the circuit DIFFAMP. Select Sensitivity from the Analysis menu. The dialog box looks like this:
Figure 11-1 The Sensitivity dialog box
The dialog box provides the following input fields:
• Sensitivity group: This is where you specify the desired output expressions and it is also where the sensitivity answer is returned. There are three fields:
•Output: This is where you specify one or more output expressions. Each expression is placed on a new line. To edit an existing expression click on it. To add a new output, click on a blank line and type in the new expression.
•Sensitivity: This is the absolute sensitivity expressed as a pure ratio.
161
The result is printed here if only one input variable is selected. If more than one parameter is selected, then the results are placed in a text output file called CIRCUITNAME.SEN.
•Sensitivity (%/%): This is sensitivity expressed as the percentage change in the output expression divided by the percentage change in the input parameter.
•Input Variable group: This group is used to specify the input parameter. The fields are the same as in the Stepping dialog box, as the same parameters are available in both cases. There are several buttons that select the input parameter(s):
•Component: This specifies a single instance of a part's parameter.
•Model: This specifies a model parameter, affecting all parts that use the model name.
•Symbolic: This specifies a symbolic parameter (one created with a .define statement)
•One: This selects a single parameter for testing.
•Multiple: This selects multiple parameters for testing. Specifically, it specifies all those parameters shown as selected in the Input Variable group.
To specify which parameters to test when doing multiple input parameters, you can use the buttons as follows:
•All On: This selects all parameters for all devices, creating lots of data.
•Default: This selects a special subset of parameters for all devices. The set has been chosen to reflect common usage.
•All Off: This deselects all parameters for all devices.
You can manually select the parameters you want by using the CTRL + click method to select a list of preferred parameters.
To start the sensitivity calculation use the Calculate button. The Close button closes the dialog box without saving any changes.
162 Chapter 11: Sensitivity Analysis
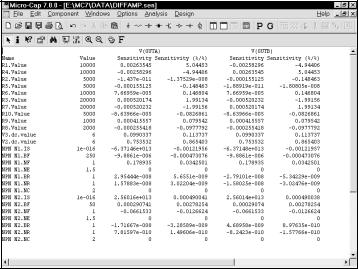
Select NPN N1 and its BF parameter. Click on the Calculate button and the dialog box shows the results.
Figure 11-2 The Sensitivity dialog box
The Sensitivity fields show the raw and percentage relative sensitivity of V(OUTA) and V(OUTB) to the BF parameter.
Because we elected to calculate for only one parameter, the results are shown in the dialog box.
To see the effect of doing sensitivity for many parameters, click on the Model and Multiple options and the Default button.
Click on the Calculate button and the program computes the sensitivity of the two output expressions to the default model parameters and presents the results in a text page called DIFFAMP.SEN. It looks like Figure 11-3.
163
The file shows the two sensitivity measures for each checked model parameter in a tabular format as show below:
Figure 11-3 Multiple parameter sensitivity results
164 Chapter 11: Sensitivity Analysis

Chapter 12 |
FilterDesign |
What's in this chapter
MC7 provides a filter design function that lets you create filter circuits. You can select the filter type, response, and circuit implementation. MC7 will then create a schematic of the filter circuit for you. This chapter shows you how to use it.
There are two types of filter design available, active filter design and passive filter design. Both are accessible from the Design menu.
Features new in Micro-Cap 7
•Circuits visible in background during filter design.
165

How the active filter designer works
The MC7 active filter designer is selected from the Design menu. It lets you select the filter type, specifications, response, and circuit implementation, then creates the required filter circuit.
The basic filter types include:
•Low pass
•High pass
•Bandpass
•Notch
•Delay
The first four are defined by their Bode plot characteristics. Delay filters are characterized by the time delay specification.
The available filter responses include:
•Butterworth
•Chebyshev
•Bessel
•Elliptic
•Inverse-Chebyshev
Not all of these responses are available for every filter type. Bessel, for example, is available for delay filters only.
The implementations, or circuits, may be different for each stage and include:
•Sallen-Key
•MFB (Multiple Feedback)
•Tow-Thomas
•Fleischer-Tow
•KHN
•Acker-Mossberg
•Tow-Thomas 2
•DABP (Dual Amplifier Band Pass)
Not all of these circuits are available for all responses, since some of the circuits cannot achieve some responses. Available circuits range from three to eight.
166 Chapter 12: Active Filter Designer