


126 |
Introduction to Direction-of-Arrival Estimation |
6.2 Performance Analysis
6.2.1Standard ESPRIT
In this section, we present performance analysis of standard ESPRIT in one dimension. Various simulations in both uncorrelated and coherent signal environments under variety of signal conditions are run. Fifty trials (i.e., K = 50) are carried out, with each trial involving 250 snapshots (i.e., K = 250). These simulation parameters are maintained throughout the experiments with the standard ESPRIT unless otherwise mentioned. Three uncorrelated signals of equal power are considered to be arriving from θ = 5°, θ = 10°, and θ = 20°. Other parameters are given in the caption of each figure that shows the simulation results.
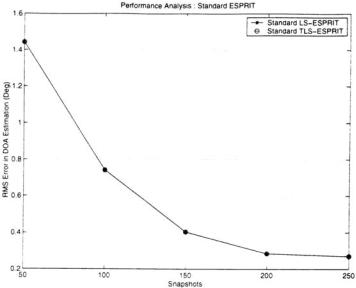
The performance of the standard ESPRIT with respect to number of snapshots taken to estimate the DOA is presented in Figures 6.1 and 6.2. The five-element ULA is employed. In the first simulation, the SNR is kept at 5 dB and the corresponding RMS errors are shown in Figure 6.1. In the second simulation, SNR is kept at 10 dB and the corresponding RMS errors are shown in Figure 6.2. As seen from Figures 6.1 and 6.2, the
Figure 6.1 RMS error in DOA estimation as a function of the number of snapshots (SNR = 5 dB, five-element ULA, trials = 50, three uncorrelated signals at 5°, 10°, and 20°).

Analysis of ESPRIT-Based DOA Estimation Algorithms |
127 |
|
|
Figure 6.2 RMS error in DOA estimation as a function of the number of snapshots (SNR = 10 dB, five-element ULA, trials = 50, three uncorrelated signals at 5°, 10°, and 20°).
RMS errors are reduced with the increase of the number of the snapshots. The RMS error with 250 snapshots is five times smaller than that with 50 snapshots. In other words, DOA estimation errors are reduced with the increase of the number of snapshots. Also, the total-least-square (TLS) version gives better results than the simple standard least square (LS) version when the number of snapshots is less than 100.
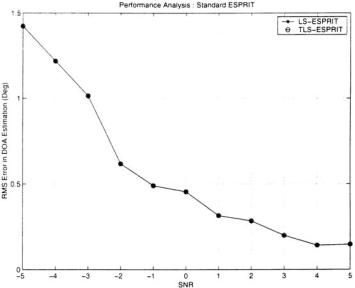
Figures 6.3 shows the performance with respect to SNR varied from −5 dB to 5 dB and with the number of snapshots equal to 250. Figure 6.4 shows the performance with respect to the same SNR variation but with the number of snapshots equal to 500. Again, a five-element ULA is employed. In both cases, the errors reduce with the increase of the SNR. With 250 snapshots, when the SNR is less than −3 dB, both the LS and TLS algorithms have an error of more than 6°. However, the errors reduce to about 0.5° when the SNR is larger than 3 dB. With 500 snapshots, when the SNR is less than −3 dB, both the LS and TLS algorithms have an error of slightly less than 3°. However, the errors reduce to about 0.5° when the SNR is larger than 3 dB. In other words, if SNR increases, the errors reduce.

128 |
Introduction to Direction-of-Arrival Estimation |
Figure 6.3 RMS error in DOA estimation as a function of the SNR (snapshots = 250, five-element ULA, trials = 50, three uncorrelated signals at 5°, 10°, and 20°).
Figure 6.4 RMS error in DOA estimation as a function of the SNR (snapshots = 500, five-element ULA, trials = 50, three uncorrelated signals at 5°, 10°, and 20°).
Analysis of ESPRIT-Based DOA Estimation Algorithms |
129 |
|
|
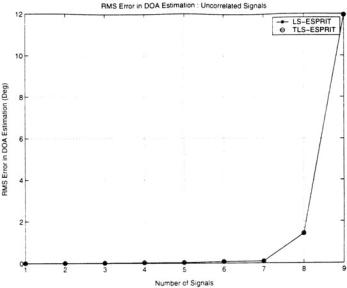
Figure 6.5 shows the errors of the standard ESPRIT versus number of signals with an SNR of 5 dB, while Figure 6.6 shows the errors of the standard ESPRIT versus number of signals with an SNR of 10 dB. A 10-element antenna array is employed and nine signals are impinging on the array. The two simulations are conducted taking 500 snapshots per trial and an SNR of 5 dB and 10 dB are assumed, respectively. It is observed that the standard ESPRIT can handle about seven signals very well with an error of less than 0.2° in both SNR = 5 dB and SNR = 10 dB cases. For the estimation of 8 signals, the standard ESPRIT present an RMS error of 2° under SNR = 5 dB and an error of 0.5° under SNR = 10 dB. For the estimation of nine signals, the errors increase dramatically: the standard ESPRIT presents an RMS error of 12° under SNR = 5 dB and an error of 4.5° under SNR = 10 dB. This is an indication that in a practical situation, the number of signals that the standard ESPRIT can handle is the number of array elements less than 3 for high accurate DOA estimations, rather than less than 1.
Figure 6.7 shows the estimation error versus the number of elements in an array under SNR = 5 dB, while Figure 6.8 shows the estimation error versus the number of elements in an array under SNR = 10 dB.
Figure 6.5 RMS error in a DOA estimation as a function of the number of signals (SNR = 5 dB, snapshots = 500, 10-element ULA, trials = 50).
130 |
Introduction to Direction-of-Arrival Estimation |
Figure 6.6 RMS error in a DOA estimation as a function of the number of signals (SNR = 10 dB, snapshots = 500, 10-element ULA, trials = 50).
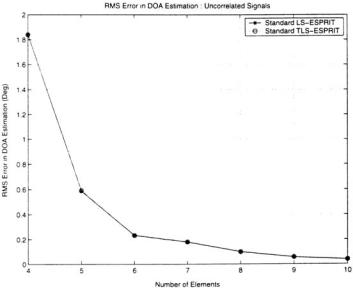
Figure 6.7 RMS error in a DOA estimation as a function of the number of elements (SNR = 5 dB, snapshots = 250, three uncorrelated signals at 5°, 10°, and 20°).
Analysis of ESPRIT-Based DOA Estimation Algorithms |
131 |
|
|
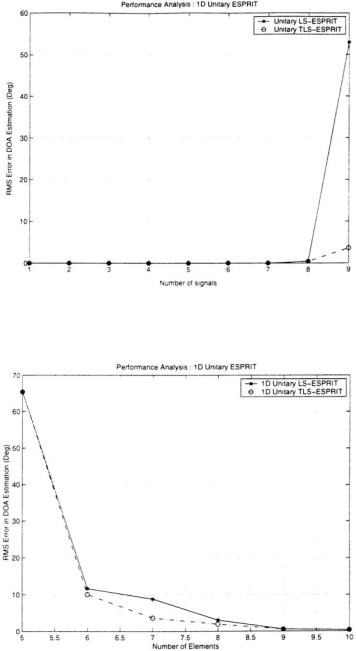
Again, the three signals are assumed to be impinging on the array at 5°, 10°, and 20°. The number of antenna elements is varied from 4 to 10 and two SNR scenarios, 5 dB and 10 dB, are assumed with 250 snapshots. It is observed that under SNR = 5 dB, a minimum of five elements is required to get the errors of less than 1.5° and seven elements to get an error of 0.6°. However, when the SNR is 10 dB, five elements are sufficient to have an error of less than 0.6° and seven elements to get an error of 0.2°. In short, when the number of elements increases, the RMS error is decreased.
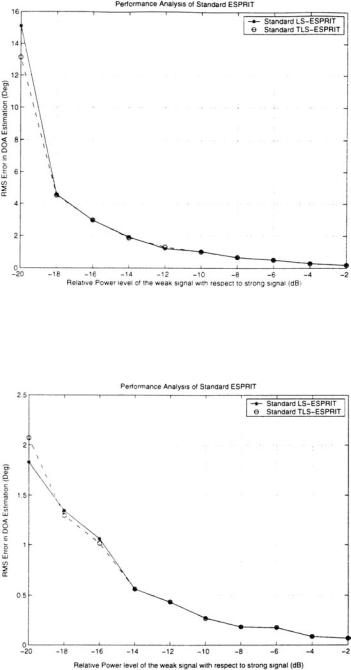
Figure 6.9 shows the estimation error versus power levels of the received signals with a 10-element antenna array under SNR = 5 dB, while Figure 6.10 shows the estimation error versus power levels of the received signals with a 10-element antenna array under SNR = 10 dB. Simulations were performed with the strong signal arriving at 5° and the weak signals arriving at 10° and 20° with the respective power levels of −20 dB to −2 dB less than the power of the strongest signal arriving at 5°. Simulations were conducted again in two different SNR scenarios, 5 dB and 10 dB. It can be seen from Figure 6.9 that when the SNR is 5 dB, the
Figure 6.8 RMS error in a DOA estimation as a function of the number of elements (SNR = 10 dB, snapshots = 250, three uncorrelated signals at 5°, 10°, and 20°).
132 |
Introduction to Direction-of-Arrival Estimation |
Figure 6.9 RMS error in a DOA estimation as a function of the power level (SNR = 5 dB, 10-element ULA, three uncorrelated signals at 5°, 10°, and 20°).
Figure 6.10 RMS error in a DOA estimation as a function of the power level (SNR = 10 dB, 10-element ULA, three uncorrelated signals at 5°, 10°, and 20°).
Analysis of ESPRIT-Based DOA Estimation Algorithms |
133 |
|
|
weak signal has to be higher than −14 dB of the strong signal in order to achieve less than 2° in error. However, when the SNR is 10 dB, the weak signals need only to be higher than −20 dB of the strong signal (see Figure 6.10). In general, the more even the signal power level received by array elements, the less DOA estimation errors there are.
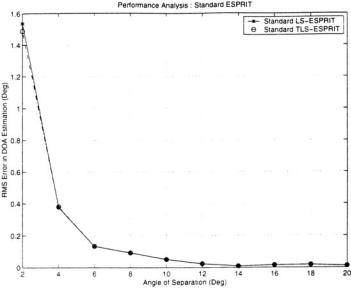
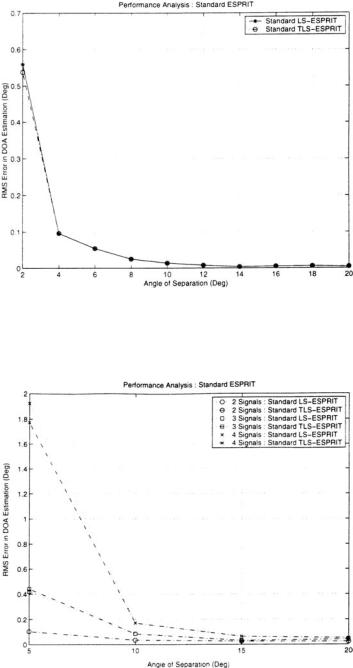
Figures 6.11, 6.12, and 6.13 show the resolution capability of the standard ESPRIT. Here three signals are impinging on a 10-element ULA with the angular separation among them varied from 2° to 20°. One signal is made to come from −40° and other signals are made to arrive from −40 + δ, −40 + 2δ, where δ is varied from 2° to 20°. Two hundred and fifty snapshots are taken in two scenarios of SNR = 5 dB and 10 dB, respectively. Figure 6.11 shows the results with SNR = 5 dB, and Figure 6.12 shows the results with SNR = 10 dB. When SNR = 5 dB, for an error of less than 1.5°, the angle of separation should be larger than 4°; for an error of less than 0.4°, the angle of separation should be larger than 4°. However, when SNR = 10 dB, for the angle of separation larger than 2°, the error is less than 0.75°; for the angle of separation larger than 4°, the
Figure 6.11 RMS error in a DOA estimation as a function of the separation of signals (SNR = 5 dB, snapshots = 250, trials = 50, 10-element ULA).
134 |
Introduction to Direction-of-Arrival Estimation |
Figure 6.12 RMS error in a DOA estimation as a function of the separation of signals (SNR = 10 dB, snapshots = 250, 10-element ULA, trials = 50).
Figure 6.13 RMS error in a DOA estimation as a function of the separation of signals (SNR = 5 dB, snapshots = 250, 10-element ULA).

Analysis of ESPRIT-Based DOA Estimation Algorithms |
135 |
|
|
error is less than 0.1°. In general, when the angle of separation of the signals is larger, the error is smaller.
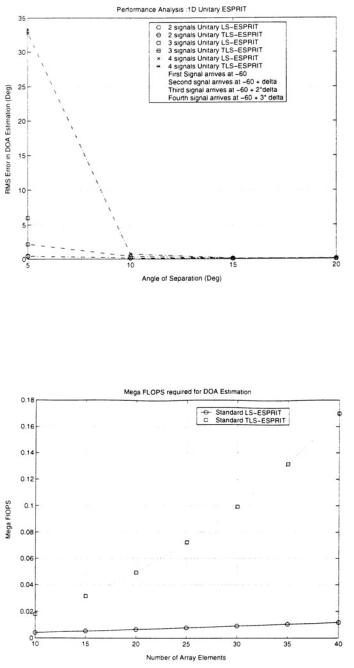
Another simulation is conducted where the number of signals is increased from 2 to 4, one at a time. Figure 6.13 shows the results versus the angle of separation with the increase of the number of elements. As seen, the larger number of the signals, the larger angle of separation required for a specified error. For instance, to have an error of less than 0.1°, the angle of separation needs to be larger than 5° in the case of two signals, 10° in the case of three signals, and 15° in the case of four signals.
Figure 6.14 shows FLOPS used in the MATLAB platform. It is observed that the TLS version demands more FLOPS as the number of elements increase, while the LS version does slightly. The needed FLOPS with the TLS are almost exponentially proportional to the number of the elements. Therefore, cautions need to be taken when the TLS version is used and the number of the array elements is to increase.
The above simulations are obtained with the uncorrelated signals. In the following, performance of the standard ESPRIT was evaluated in a
Figure 6.14 FLOPS as a function of the number of antenna array elements (SNR = 5 dB, snapshots = 250, 50 trials).
136 |
Introduction to Direction-of-Arrival Estimation |
coherent environment. A six-element ULA is considered and is divided into three subarrays, each of them having four elements. Then two coherent signals are impinged on the array from 5° and 10°.
Figure 6.15 shows the estimation error as a function of snapshots with an SNR of 5 dB, while Figure 6.16 shows the estimation error as a function of snapshots with SNR of 10 dB. As can be seen, the error with the number of snapshots being 250 is more than five times smaller than that when the number of snapshots is 50, an indication of strong benefits with increase of the number of the snapshots.
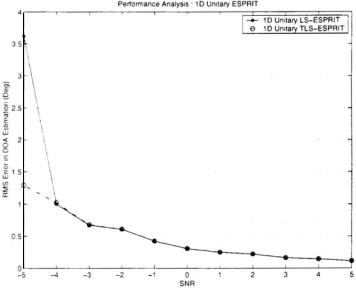
Figure 6.17 shows the error versus SNR with 250 snapshots, while Figure 6.18 shows the error versus SNR with 500 snapshots. As seen from the figures, the DOA errors reduce as SNR increases as well as the number of snapshots. For instance, when SNR is increased from −5 dB to +5 dB, the errors are reduced from 3.7° to 0.3° with 250 snapshots and 1.4° to 2° with 500 snapshots. In addition, in a low SNR environment, the larger number of snapshots improves the DOA estimation accuracy more than that in a high SNR environment.
Figure 6.15 RMS error in a DOA estimation as a function of the number of snapshots (SNR = 0 dB, six-element ULA, three subarrays, two coherent signals impinge at 5° and 10°).

Analysis of ESPRIT-Based DOA Estimation Algorithms |
137 |
|
|
Figure 6.16 RMS error in a DOA estimation as a function of the number of snapshots (SNR = 10 dB, six-element ULA, three subarrays, two coherent signals impinge at 5° and 10°).
Figure 6.17 RMS error in a DOA estimation as a function of the SNR (snapshots = 250, six-element ULA, three subarrays, two coherent signals impinge at 5° and 10°).
138 |
Introduction to Direction-of-Arrival Estimation |
Figure 6.18 RMS error in a DOA estimation as a function of the SNR (snapshots = 500, six-element ULA, three subarrays, two coherent signals impinge at 5° and 10°).
6.2.2The One-Dimensional Unitary ESPRIT
In this section, the performance of the unitary ESPRIT in one dimension is analyzed. Various simulation results run in both uncorrelated and coherent signal environments under a variety of signal conditions are presented. Simulations were conducted with a 10-element ULA with maximum overlap. Fifty trials were carried out, with each trial involving 250 snapshots. These simulation parameters are maintained throughout the experiments with the unitary one-dimensional ESPRIT unless otherwise mentioned. Four uncorrelated signals of equal power are considered to be arriving at θ1 = −10°, θ2 = −5°, θ3 = 5°, and θ4 = 10°.
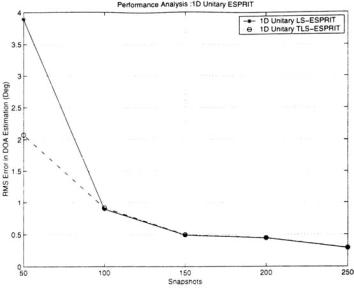
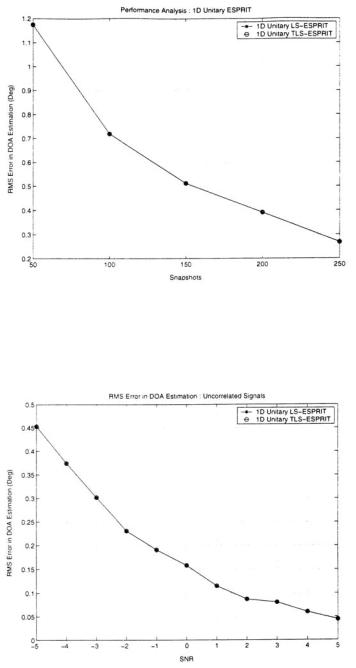
Figure 6.19 shows the results of the unitary one-dimensional ESPRIT simulation with respect to number of snapshots taken to estimate the DOA with SNR = 0 dB, while Figure 6.20 shows the results of the unitary one-dimensional ESPRIT simulation with respect to number of snapshots taken to estimate the DOA with SNR = 10 dB. The results show an error of about 4° or less at SNR of 0 dB and a smaller error of about 0.17° or less when the SNR is increased to 10 dB. The DOA estimation accuracy improves with the increase of the number of the
Analysis of ESPRIT-Based DOA Estimation Algorithms |
139 |
|
|
Figure 6.19 RMS error in a DOA estimation as a function of the snapshots (SNR = 0 dB, 10-element ULA, trials = 50, four uncorrelated signals at θ1 = −10°, θ2 = −5°, θ3 = 5°, and θ4 = 10°).
snapshots taken. The improvement is more than five times in the cases simulated when the number of the snapshots is increased from 50 to 250.
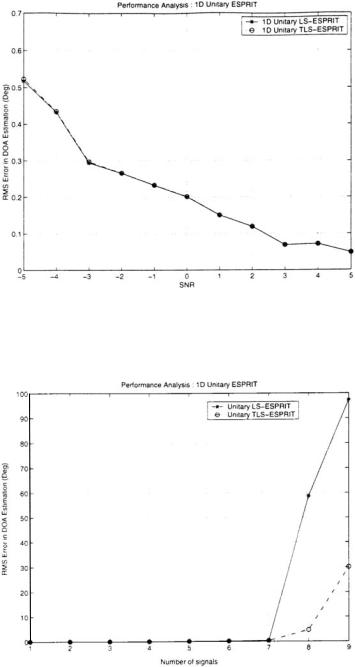
Figures 6.21 and 6.22 show the RMS errors with respect to different SNR values. SNR is varied from −5 dB to 5 dB. Figure 6.21 is obtained with 250 snapshots taken, while Figure 6.22 is obtained with 500 snapshots taken. As can be seen, when SNR is improved from −5 dB to 5 dB, the DOA estimation accuracy is improved more than 10 times in both figures. It is also observed that the unitary TLS-ESPRIT is performing better than the unitary LS-ESPRIT, giving a 1° error at SNR= −5 dB compared to a 4° error given by the LS version. However, when the SNR is above −4 dB or the numbers of snapshots are more than 500, both the TLSand LS-ESPRIT perform almost the same.
Figure 6.23 shows the RMS error versus number of the signals with SNR = 0 dB, while Figure 6.24 shows the RMS error versus number of the signals with SNR = 10 dB. A 10-element antenna array is employed and nine signals impinge on the array. Five hundred snapshots per trial are taken. It is observed that when the SNR is 0 dB, the LS version can
140 |
Introduction to Direction-of-Arrival Estimation |
Figure 6.20 RMS error in a DOA estimation as a function of the snapshots (SNR = 10 dB, 10-element ULA, trials = 50, four uncorrelated signals at θ1 = −10°, θ2 = −5°, θ3 = 5°, and θ4 = 10°).
estimate DOAs up to seven signals under a 10° accuracy, whereas the TLS version is able to estimate up to eight signals. When the SNR is 10 dB, the LS version is estimating eight signals, while the TLS version is estimating DOAs of all nine signals to a 10° accuracy. In general, the number of signals that the unitary ESPRIT algorithms can estimate is lower than the ideal case and the number of the array elements less than one, unless in a high SNR environment.
Figures 6.25 and 6.26 present the performance of the unitary one-dimensional ESPRIT with respect to the number of elements in the array. The four signals are impinging on the array and a minimum of five elements are theoretically needed to resolve them. The total number of antenna elements is varied from 5 to 10 and two SNRs are used, 0 dB and 10 dB. It is observed that with SNR = 0 dB, a minimum of six elements are needed to get an accuracy below 10°. When the SNR is increased to 10 dB, the error reduces to less than 1°. If the number of elements is less than 6, the algorithm is performing badly even at high SNRs. In short, in a practical noisy environment, the minimum number of the array elements required to achieve a good DOA estimation accuracy is normally
Analysis of ESPRIT-Based DOA Estimation Algorithms |
141 |
|
|
Figure 6.21 RMS error in a DOA estimation as a function of the SNR (snapshots = 250, 10-element ULA, trials = 50, four uncorrelated signals at θ1 = −10°, θ2 = −5°, θ3 = 5°, and θ4 = 10°).
higher than the theoretically predicted number, the number of the signals plus one.
Figures 6.27 and 6.28 present the performance of the unitary one-dimensional ESPRIT with respect to the power level of the received signal with a 10-element antenna array. The numbers of signals arriving at the array were taken to be 2, 3, and 4, respectively. In all cases, one signal is made to be strong, and the powers of the remaining signals are varied equally from −20 dB to −5 dB below the power of the strong signal. Simulations are conducted in two different SNR scenarios of 0 dB and 10 dB, respectively. The results indicate that the performance is bad when four signals are impinging with unequal power. When SNR = 0 dB, at a −20-dB relative power level, the error is 12° for four signals, 4° for three signals, and 2° for two signals. In general, with a lesser degree of inequality in the power levels received by the array elements, the DOA estimation accuracy improves. It is also observed that TLS version is performing better than the LS version; the performance of the TLS version is far better when SNR is 10 dB: the reduction in error at the −20-dB relative power level is about 90%.
142 |
Introduction to Direction-of-Arrival Estimation |
Figure 6.22 RMS error in a DOA estimation as a function of the SNR (snapshots = 500, 10-element ULA, trials = 50, four uncorrelated signals at θ1 = −10°, θ2 = −5°, θ3 = 5°, and θ4 = 10°).
Figure 6.23 RMS error in a DOA estimation as a function of the number of signals (10-element ULA, trials = 50, snapshots = 250, SNR = 0 dB).
Analysis of ESPRIT-Based DOA Estimation Algorithms |
143 |
|
|
Figure 6.24 RMS error in a DOA estimation as a function of the number of signals (10-element ULA, trials = 50, snapshots = 250, SNR = 10 dB).
Figure 6.25 RMS error in a DOA estimation as a function of the number of elements (snapshots = 250, SNR = 0 dB, four uncorrelated signals at θ1 = −10°, θ2 = −5°, θ3 = 5°, and θ4 = 10°).

144 |
Introduction to Direction-of-Arrival Estimation |
Figure 6.26 RMS error in a DOA estimation as a function of the number of elements (snapshots = 250, SNR = 10 dB, four uncorrelated signals θ1 = −10°, θ2 = −5°, θ3 = 5°, and θ4 = 10°).
Figure 6.27 RMS error in a DOA estimation as a function of the relative power level (10-element ULA, uncorrelated signals, snapshots = 250, SNR = 0 dB).

Analysis of ESPRIT-Based DOA Estimation Algorithms |
145 |
|
|
Figure 6.28 RMS error in a DOA estimation as a function of the relative power level (10-element ULA, uncorrelated signals, snapshots = 250, SNR = 10 dB).
Figures 6.29 and 6.30 show the resolution capability of the unitary one-dimensional ESPRIT. Initially, two signals were taken. One signal is arriving at 5° and other signal is made to come from 5° + δ, where δ is varied from 2° to 20°. There were 250 snapshots taken in two scenarios of SNR = 0 dB and 10 dB, respectively. As seen from Figures 6.29 and 6.30, the error in both scenarios is less than 0.45°, a small error mainly due to the use of 10 elements. It is observed that error in higher SNR scenario is four to five times less than the error at SNR = 0 dB.
Now the number of signals is increased to 2, 3, and 4 signals, respectively, on the 10-element ULA with the angular separation between them varied from 2° to 20°. One signal is made to come from 10° and other signals are made to arrive to come from 10° + δ, 10° + 2δ, and 10° + 3δ, where δ is varied from 2° to 20°. Figure 6.31 shows the simulation results. When SNR is 0 dB, as can be seen, the unitary ESPRIT is able to estimate DOAs of up to three signals placed as closely as 5° with an error less than 5°. If the separation is 10°, it is able to resolve all of the four signals to 2° accuracy.
The computational expenditure of the unitary ESPRIT is measured in terms of MATLAB FLOPS. Figure 6.32 shows the FLOPS usage. As

146 |
Introduction to Direction-of-Arrival Estimation |
Figure 6.29 RMS error in DOA estimation as a function of separation (10-element ULA, trials = 50, snapshots = 250, SNR = 0 dB, two uncorrelated signals).
Figure 6.30 RMS error in DOA estimation as a function of separation (10-element ULA, trials = 50, snapshots = 250, SNR = 10 dB, two uncorrelated signals).
Analysis of ESPRIT-Based DOA Estimation Algorithms |
147 |
|
|
Figure 6.31 RMS error in a DOA estimation as a function of the separation (10-element ULA, trials = 50, snapshots = 250, SNR = 0 dB).
Figure 6.32 FLOPS as a function of number of antenna array elements (SNR = 5 dB, snapshots = 250, 10-element ULA).

148 |
Introduction to Direction-of-Arrival Estimation |
expected, the unitary TLS version is demanding more FLOPS compared to the unitary LS.
The behavior of the algorithm in the coherent environment is studied next. A six-element linear array is considered. The array is divided into three subarrays, each of them having four elements. Two coherent signals are impinged on the array at −5° and 10°. The results are shown in Figures 6.33, 6.34, 6.35, and 6.36. In general, the performance in the coherent signal environment is worse than that in the uncorrelated environments; however, similar conclusions can be drawn on the relationship between the performance and various parameters.
6.2.3The Two-Dimensional Unitary ESPRIT
In this section, the performance of the two-dimensional unitary ESPRIT is evaluated. Simulations are performed in both uncorrelated and coherent signal environments under variety of signal conditions. Simulations are conducted using a 4 × 4 = 16 element uniform rectangular array with maximum overlap in both the x and y directions. As usual, the RMS error in the DOA estimation is used as the metric for measuring the
Figure 6.33 RMS error in a DOA estimation as a function of the number of snapshots (six-element ULA, trials = 50, SNR = 0 dB, two coherent signals at −5° and 10°).
Analysis of ESPRIT-Based DOA Estimation Algorithms |
149 |
|
|
Figure 6.34 RMS error in a DOA estimation as a function of snapshots (6-element ULA, trials = 50, SNR = 10 dB, two coherent signals at −5° and 10°).
Figure 6.35 RMS error in a DOA estimation as a function of the SNR (six-element ULA, trials = 50, snapshots = 250, two coherent signals at −5° and 10°).
150 |
Introduction to Direction-of-Arrival Estimation |
Figure 6.36 RMS error in a DOA estimation as a function of the SNR (six-element ULA, trials = 50, snapshots = 500, two coherent signals at −5° and 10°).
performance. Fifty trials were run. These simulation parameters are maintained throughout the experiments with the two-dimensional unitary ESPRIT unless otherwise mentioned. Two uncorrelated signals of equal power are chosen to be arriving from (θ1, φ1) = (−20°, −15°) and (θ2, φ2) = (20°, 15°).
In first simulation, the SNR is kept at 10 dB and 50 to 150 snapshots of data are taken. Figure 6.37 shows the DOA errors. It is observed that, like in the one-dimensional case, the RMS error reduces with the increased number of snapshots.
Next, performance with respect to the SNR is evaluated. The SNR is varied from −5 dB to 5 dB. In the first simulation, 250 snapshots of data are taken, and in the second simulation, 500 snapshots of the data are taken with the same variation in the SNR; the results are shown in Figures 6.38 and 6.39, respectively. As can be seen, the DOA estimation errors reduce with the increase of SNR. With 250 snapshots, the error is reduced from 12° to 0.1° when the SNR is increased from −5 dB to 5 dB; with 500 snapshots, the RMS error decreases from 9° to 0.1° when SNR is increased from −5 dB to 5 dB. It can also be noticed that to achieve an error of less than 2°, the SNR should be at minimum −1 dB.

Analysis of ESPRIT-Based DOA Estimation Algorithms |
151 |
|
|
Figure 6.37 RMS error in a DOA estimation as a function of snapshots (SNR = 10 dB, 16-element URA, trials = 50, two uncorrelated signals at (θ1, φ1) = (−20°, −15°) and (θ2, φ2) = (20°, 15°)).
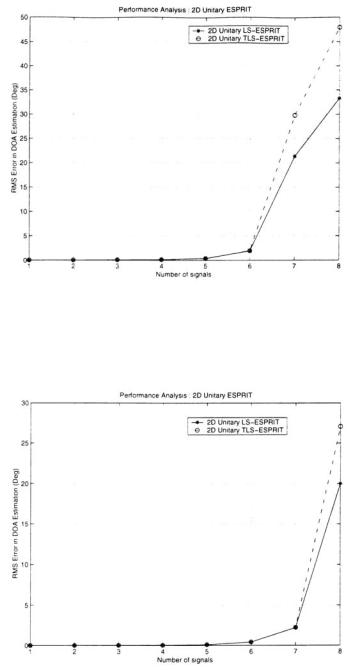
The performance of the two-dimensional unitary ESPRIT is further studied to check how many signals the algorithm can handle. Eight signals are made to impinge on the array. Two simulations are conducted, taking 250 snapshots per trial with an SNR of 5 dB and 10 dB, respectively. Figures 6.40 and 6.41 are the simulation results. It is observed that, with the given SNR value, the algorithms are able to estimate about seven signals under an error of 5° above which the accuracy degrades rapidly. In other words, the number of the signals that can be estimated is less than the ideally predicted limit, which is the number of the array elements less than one. Also, the LS version shows a better performance than TLS while TLS is computationally more intensive.
The performance of the two-dimensional unitary ESPRIT with respect to the number of elements of the array is shown in Figures 6.42 and 6.43. It can be seen that with the increase of the number of the array elements, the error reduces. For instance, when the number of the elements is increased from 4 to 25, the error is reduced from about 5.4° to 3.7° under SNR = 5 dB and from about 0.125° to 0.045° under SNR = 10 dB. It is also observed that the TLS version is performing slightly better than the LS version, especially for low SNR values.

152 |
Introduction to Direction-of-Arrival Estimation |
Figure 6.38 RMS error in a DOA estimation as a function of the SNR (snapshots = 250, 16-element ULA, trials = 50, two uncorrelated signals at (θ1, φ1) = (−20°, −15°) and (θ2, φ2) = (20°, 15°)).
Figure 6.39 RMS error in a DOA estimation as a function of the SNR (snapshots = 500, 16-element URA, trials = 50, two uncorrelated signals at (θ1, φ1) = (−20°, −15°) and (θ2, φ2) = (20°, 15°)).
Analysis of ESPRIT-Based DOA Estimation Algorithms |
153 |
|
|
Figure 6.40 RMS error in a DOA estimation as a function of the number of signals (SNR = 5 dB, 16-element URA, trials = 50, snapshots = 250).
Figure 6.41 RMS error in a DOA estimation as a function of the number of signals (SNR = 10 dB, 16-element URA, trials = 50, snapshots = 250).

154 |
Introduction to Direction-of-Arrival Estimation |
Figure 6.42 RMS error in a DOA estimation as a function of the number of elements (SNR = 5 dB, snapshots = 250, two uncorrelated signals at (θ1, φ1) = (−20°, −15°) and (θ2, φ2) = (20°, 15°)).
Figure 6.43 RMS error in a DOA estimation as a function of the number of elements (SNR = 10 dB, snapshots = 250, two uncorrelated signals at (θ1, φ1) = (−20°, −15°) and (θ2, φ2) = (20°, 15°)).
Analysis of ESPRIT-Based DOA Estimation Algorithms |
155 |
|
|
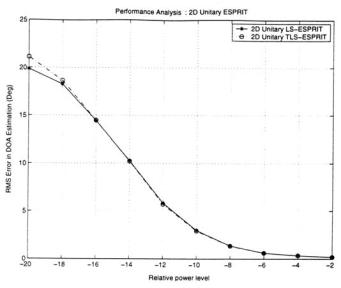
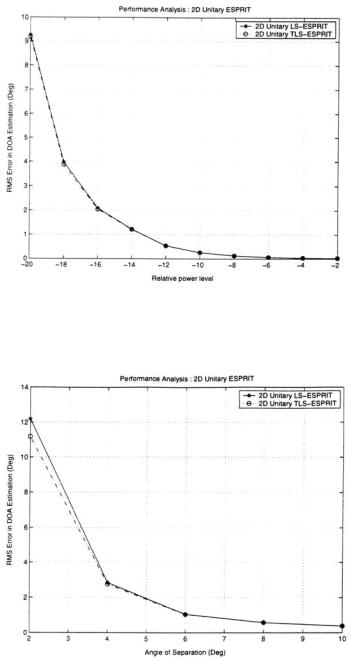
The performance of the two-dimensional unitary ESPRIT with respect to power levels of the received signals is also studied and the results are shown in Figures 6.44 and 6.45. Simulations are performed with one strong signal arriving at (θ1, φ1) = (−20°, −15°) and another weaker signal arriving at (θ2, φ2) = (20°, 15°) with a power level of −20 dB to −5 dB less than the power of the strong signal. Simulations are conducted in two different SNR scenarios of 5 dB and 10 dB, respectively. As can be seen, when the difference of the power levels is reduced, the DOA estimation error is reduced. For instance, under SNR = 5 dB, the error is about 20° when the weak signal has a power, which is −20 dB below that of the strong signal; the error reduces to less than 0.5° when the power is −2 dB below.
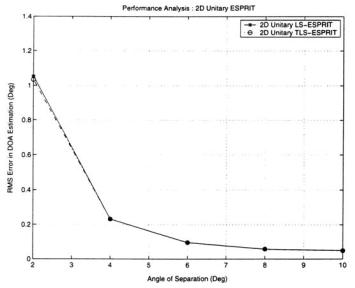
The resolution capability of the two-dimensional unitary ESPRIT is shown in Figures 6.46 and 6.47. Here two signals are impinged with the angular separation between them varied from 2° to 10°. There are 250 snapshots taken for DOA estimation in two scenarios of SNR = 5 dB and 10 dB, respectively. As observed, the larger the signal angles of separation, the smaller the errors.
Figure 6.44 RMS error in a DOA estimation as a function of the relative power level (SNR = 5 dB, 16-element URA, two uncorrelated signals at (θ1, φ1) = (−20°, −15°) and (θ2, φ2) = (20°, 15°)).
156 |
Introduction to Direction-of-Arrival Estimation |
Figure 6.45 RMS error in a DOA estimation as a function of the relative power level (SNR = 10 dB, 16-element URA, two uncorrelated signals at (θ1, φ1) = (−20°, −15°) and (θ2, φ2) = (20°, 15°)).
Figure 6.46 RMS error in a DOA estimation as a function of the separation (SNR = 5 dB, 16-element URA, trials = 50, two uncorrelated signals at (θ1, φ1) = (−20°, −15°) and (θ2, φ2) = (20°, 15°)).
Analysis of ESPRIT-Based DOA Estimation Algorithms |
157 |
|
|
Figure 6.47 RMS error in a DOA estimation as a function of the separation (SNR = 10 dB, 16-element URA, trials = 50, two uncorrelated signals at (θ1, φ1) = (−20°, −15°) and (θ2, φ2) = (20°, 15°)).
The computational expenditure measured in terms of MATLAB FLOPS is shown in Figure 6.48. The results show that the TLS version asks for more FLOPS than the LS version as the number of elements increase.
Finally, the performance of the algorithm in the coherent environment is presented in Figures 6.49 and 6.50. A 5 × 5 = 25 element uniform rectangular array is considered that is divided into nine rectangular subarrays, each of them having nine elements. Then two coherent signals are impinged on the array at (θ1, φ1) = (10°, 12°) and (θ2, φ2) = (12°, 25°). The effect of the SNR on the errors is shown by varying the SNR from −5 dB to 5 dB. It is observed from Figures 6.49 and 6.50 that the error is relatively more compared to uncorrelated sources, due to the reduction of the detection capability of the algorithm as explained in Chapter 3. However, the relationships between the DOA estimation accuracy and various parameters are similar to those in uncorrelated signal environments.