


518 |
Coherence-Domain Methods and Instruments for Biomedical Diagnostics and Imaging |
potential to help develop new drugs to combat not just the diseases of the eye,
such as cataract, but to diagnose and study those of the body, such as diabetes and possibly Alzheimer’s, as was recently claimed by Ansari. 849,1169
The coherent fiber-optic photon-correlation spectrometers for study of catarac-
togenesis and potentially useful for early diagnosis of cataract were designed about a decade ago.850,1173 The instrument described in Ref. 850 includes two optical
fibers. The first, a single-mode fiber, transmits a Gaussian beam of an He:Ne or diode laser to an object. The second, multimode or single-mode fiber is employed to collect backscattered radiation at a certain angle and to transmit this radiation to a photodetector [see Fig. 8.1(a)]. The power of the He:Ne laser radiation (at 633 nm) is on the order of 1 mW. The size of the laser beam on the crystalline lens is about 150 μm. Scattered radiation is detected at angles of 155 deg (detector 1) and 143 deg (detector 2). Figure 8.1(b) shows typical autocorrelation functions measured for bovine crystalline lens under conditions of temperature-induced cataract (reversible cold cataract). The results of the solution of the relevant inverse problem (determination of the sizes of scatterers in human crystalline lenses as functions of age), taking into account Eqs. (4.28), (4.30), and (4.31), are presented in Fig. 8.1(c). These data demonstrate that the method under consideration is sufficiently sensitive for the monitoring of age changes in the structure of the crystalline lens caused by growth in the sizes of aggregated protein components.
In Ref. 850, a clinical modification of the measuring system for the early diagnosis of cataract is presented. According to the estimates, the expected power density incident on a retina that is sufficient to measure the autocorrelation function of intensity fluctuations within a time interval of about 2 min is no higher than 0.05 mW/mm2, which is almost three orders of magnitude lower than the threshold of retinal damage.
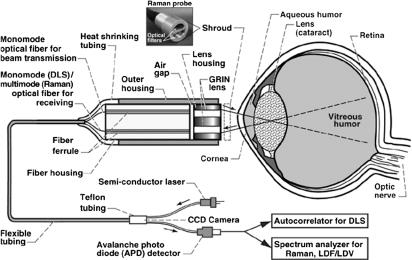
The fiber-optic QELS probe, shown in Fig. 8.2, combines the unique attributes of small size, low laser power, and high sensitivity.849,1169 The system is easy to
use because it does not require sensitive optical alignment nor vibration isolation devices. A low-power (50–100-μW) light from a semiconductor laser, interfaced with a monomode optical fiber, is tightly focused in a 20-μm diameter focal point in the tissue of interest via a GRIN (gradient index) lens. On the detection side, the scattered light is collected through another GRIN lens and guided onto an avalanche photodiode (APD) detector built into a photon-counting module. APD processed signals are then passed on to a digital correlator for analysis. The probe provides quantitative measurements of the pathologies of cornea, aqueous, lens, vitreous, and the retina. By suitable choice of optical filters, it can be converted into a device for spectral measurements (autofluoresence and Raman spectroscopy) and laser-Doppler flowmetry/velocimetry, providing measurements of oxidative stress and blood flow in the ocular tissues. The device also can easily be integrated into many conventional ophthalmic instruments such as slit lamps, Scheimpflug cameras, videokeratoscopes, and fluorometers.
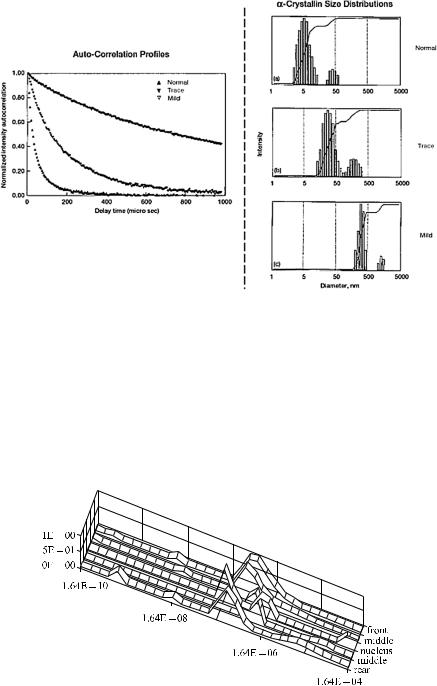
This compact probe (Fig. 8.2) was used for the monitoring of cataractogenesis in mice in vivo by examination of the measured autocorrelation function (AF)

520 |
Coherence-Domain Methods and Instruments for Biomedical Diagnostics and Imaging |
Figure 8.2 Schematic diagram of the sensitive, vibration protected, universal, and easy to use QELS fiber-optic probe.1169 The probe was originally developed at NASA to conduct fluid physics experiments in the absence of gravity onboard a space shuttle or space station orbiter.
trol FVB/N strain, which does not develop a cataract, and two Philly mice roughly 26–29 days old. Each measurement took 5 s at a laser power of 100 μW. The changing AF slope is an indication of cataractogenesis because the lens crystallins aggregate to form high molecular weight clumps and complexes. The QELS autocorrelation data is converted into particle size distributions using an exponential sampling program and is shown in Fig. 8.3. Although conversion of the QELS data into particle size distributions requires certain assumptions regarding the viscosity of the lens fluid, these size values do indicate a trend as the cataract progress. These measurements suggest that a developing cataract can be monitored quantitatively with reasonable reliability, reproducibility (5–10%), and accuracy.
Besides cataract monitoring, the QELS probe has been proposed and experimentally tested for early, noninvasive, and quantitative detection and monitoring of such disease and abnormalities as vitreopathy, pigmentary glaucoma, di-
abetic retinopathy, and corneal evaluation of wound healing after laser refractive surgery.849,1169
A portable fiber-optic photon-correlation spectrometer based on an He:Ne laser (633-nm), single-mode fibers, a photomultiplier operating in the regime of a photon counting mode, and a 288-channel real-time correlator with a sampling time of 200 ns is described in Ref. 851. This spectrometer allows in vivo studies of crystalline lenses of patients. These investigations also confirmed the bimodal character of the distribution of scatterers in the tissue of a human crystalline lens. Specifically, for healthy eyes of patients aged between 39 and 43 (six eyes, three female patients), the finely dispersed fraction has a mean radius of 4.25 ± 1.7 nm, whereas the mean radius of the coarsely dispersed fraction is 497 ± 142 nm. For cataractous
Tissue Optics: Light Scattering Methods and Instruments for Medical Diagnosis |
521 |
Figure 8.3 In vivo cataract measurements in Philly mice.1169 (a) Autocorrelation profiles.
(b) Particle size distribution for the normal eye, control mouse. (c) Particle size distribution for a mouse with trace cataract. (d) Particle size distribution for a mouse with mild cataract.
crystalline lenses, the mean radius of the finely dispersed fraction tends to 160 nm, whereas the mean radius of the coarsely dispersed fraction tends to 1000 nm. The spectrometer permits one to determine the size distribution of species for various localizations of the volume of the measurements. The bimodal size distributions of scatterers measured under conditions when the volume of measurements is shifted along the axis of a cataractous crystalline lens are presented in Fig. 8.4.
Figure 8.4 Bimodal distribution of the radii of scattering particles for a cataractous crystalline lens (female patient at the age of 76, in vivo measurements) with different localizations of the volume of measurements along the axis of the crystalline lens: the front part of the cortical layer, the middle part of the cortical layer, nucleus, the middle part of the rear cortical layer, and the rear part of the cortical layer.851
522 |
Coherence-Domain Methods and Instruments for Biomedical Diagnostics and Imaging |
8.1.3 Blood and lymph flow monitoring in microvessels
Parameters of blood or lymph flows in individual vessels can be measured with
the use of a technique based on the diffraction of a focused laser beam by moving scatterers (see Section 4.4.2).77,343,826,833,853,854 A diagram of the relevant speckle
microscope is presented in Fig. 8.5. Laser radiation focused into a spot of a small diameter on the order of 4.6λ is projected onto a segment of the microvessel under study. A photodetector whose entrance aperture is much smaller than the mean speckle size registers intensity fluctuations in the scattered light. The intensity fluctuations detected are analyzed with a low-frequency digital spectrum analyzer or converted into a digital signal for subsequent computer analysis. The typical spectra for blood and lymph flows in superficial vessels of rat mesentery averaged over 128 realizations of a random signal are displayed in Fig. 8.6.
Figure 8.5 Diagram of a speckle microscope for the investigation of blood and lymph flows in microvessels.853,854
For a blood microvessel, the spectrum of intensity fluctuations in the scattered field has a nearly Gaussian shape in the low-frequency range. The spectra of intensity fluctuations for lymphatic vessels are rather complicated, which indicates that the motion of lymph in microvessels is much more complex than the motion of blood. For example, lymph may be involved in a characteristic shuttlelike motion, be nonmovable near the vessel wall, or move in a direction opposite to the flow in the central part of a vessel. Such a behavior of lymph is associated with a complex

Tissue Optics: Light Scattering Methods and Instruments for Medical Diagnosis |
523 |
Figure 8.6 Spectra of intensity fluctuations in the scattered light (averaged over 128 realizations) for the diffraction of a focused laser beam on rat mesentery: 1, blood vessel (12 μm in diameter); 2–12, lymphatic vessels of various diameters for different rats. Measurements were performed within the frequency range of 30–1500 Hz. 853,854
contraction dynamics of smooth-muscle cells in vessel walls, governed by a local rhythm driver (pacemaker) and the behavior of the valves of lymphatic vessels.
To estimate the parameters of blood and lymph flows in microvessels, we introduce the following quantities:853,854
VV = F , DV
(8.1)
F |S(f ) − G(f )|4df
V = [ 0F0|S(f ) − G(f )|2df ]2/ F .
Here, F is the width of the averaged spectrum, DV is the diameter of a microvessel, S(f ) is the power spectrum of the intensity fluctuations for the speckle field studied, and G(f ) is the spectrum with a Gaussian envelope. The spectra S(f ) and G(f ) have equal bandwidths and powers. Parameter VV is directly proportional to the flow velocity, and V provides the information concerning spatial and temporal variations of the flow rate in the studied area of a vessel.
The characteristics given above have been employed to analyze the influence
of a lymphotropic agent (Staphylococcus toxin, ST) on the dynamics of lymph flow in mesentery microvessels of experimental animals (rats).853,854 It was found
that even at the fifth minute of ST action, all the vessels studied showed variations in the spectra of intensity fluctuations in scattered light, which indicates that the velocity characteristics of the flow change: 59% of the 17 vessels studied displayed a decrease in the mean velocity VV of lymph flow by 41 ± 8% and a growth in the
524 |
Coherence-Domain Methods and Instruments for Biomedical Diagnostics and Imaging |
V parameter by 33 ± 7%. The remaining 41% of the vessels displayed an increase in the mean rate of lymph flow by 63 ± 22% and a decrease in the V parameter by 35 ± 9%. In later stages (between the fifth and twentieth minutes), vasoconstriction progresses and the number of vessels contracting in phase decreases, which leads to changes in lymph dynamics. After the twentieth minute, lymph flow stopped in all the vessels studied.
The optical scheme of the setup providing detection of cell flow direction and
velocities in the range from 10 μm/s to 10 mm/s with a temporal resolution up to 50 ms is shown in Fig. 8.7.833,858 Radiation from a uniphase He:Ne laser (633 nm)
is delivered through the illuminator channel and focused by the objective of the microscope into a spot of a diameter of about 2 μm in a plane apart at a distance z = 100 μm from the axis of the microvessel. The radius of curvature of the wavefront of the beam illuminating the microvessel is quite small to ensure the acceptable translation length of biospeckles. The measuring volume is formed by the intersection of the diverging laser beam with the microvessel and has the shape of a truncated cone (whose elements have a slope of 10 deg and a mean diameter on the order of 30 μm). The laser radiation scattered by the cell flow is directed with the help of the beamsplitter to the photodetector placed at a distance of 300 mm from the objective plane of the microscope. The diameter of each photodetector is 3 mm, which corresponds to the mean speckle diameter in the observation plane. The distance between the centers of the photodetectors is about 7 mm. Signals from the photodetectors are amplified by the photocurrent transducers and digitized with the help of a two-channel 16-bit analogue-to-digital converter with a sampling frequency of 44.1 kHz. A PC is used to determine the cross-correlation function of the photodetector signals as well as the positions of its peaks.
Depending on the time resolution, the processing of the realization of photodetector signals of duration 60 s takes between 90 and 300 s. A digital video camera combined with a transmission microscope is used for analysis of microvessels’ functions in vivo in real time: estimate the mean flow velocity and its direction, measure the diameter of a microvessel, and register the appearance of phasic contraction in the investigated lymphatics. Dynamic digital images were processed with specially developed software. The cell velocity was determined as the ratio of the difference in cell coordinates in two consecutive frames to the time interval between the two frames. The mean flow velocity was calculated by averaging the velocities of four to six cells. Dynamic digital microscopy allows one to record cell flow velocity in the range from 25 μm/s to 2–2.5 mm/s with a time resolution of 40 ms.
The described setup was tested for in vivo measurements of lymph flow velocity in the mesentery vessels of narcotized white rats. Animals were placed on a thermostabilized stage (37.7◦C) of the microscope (see Fig. 8.7) and the mesentery and intestine was kept moist with Ringer’s solution at 37◦C (pH 7.4). The images of microvessels were evaluated by transmission microscopy and laser specklevelocimeter simultaneously. Figure 8.8 shows the temporal dependences of the flow velocity in the investigated microlymphatic with mean diameter 170 ± 5 μm

Tissue Optics: Light Scattering Methods and Instruments for Medical Diagnosis |
525 |
||||||||||||||||||||||||||||||||||||||||||||
|
|
|
|
|
|
|
|
|
|
|
|
|
|
|
|
|
|
|
|
|
|
|
|
|
|
|
|
|
|
|
|
|
|
|
|
|
|
|
|
|
|
|
|
|
|
|
|
|
|
|
|
|
|
|
|
|
|
|
|
|
|
|
|
|
|
|
|
|
|
|
|
|
|
|
|
|
|
|
|
|
|
|
|
|
|
|
|
|
|
|
|
|
|
|
|
|
|
|
|
|
|
|
|
|
|
|
|
|
|
|
|
|
|
|
|
|
|
|
|
|
|
|
|
|
|
|
|
|
|
|
|
|
|
|
|
|
|
|
|
|
|
|
|
|
|
|
|
|
|
|
|
|
|
|
|
|
|
|
|
|
|
|
|
|
|
|
|
|
|
|
|
|
|
|
|
|
|
|
|
|
|
|
|
|
|
|
|
|
|
|
|
|
|
|
|
|
|
|
|
|
|
|
|
|
|
|
|
|
|
|
|
|
|
|
|
|
|
|
|
|
|
|
|
|
|
|
|
|
|
|
|
|
|
|
|
|
|
|
|
|
|
|
|
|
|
|
|
|
|
|
|
|
|
|
|
|
|
|
|
|
|
|
|
|
|
|
|
|
|
|
|
|
|
|
|
|
|
|
|
|
|
|
|
|
|
|
|
|
|
|
|
|
|
|
|
|
|
|
|
|
|
|
|
|
|
|
|
|
|
|
|
|
|
|
|
|
|
|
|
|
|
|
|
|
|
|
|
|
|
|
|
|
|
|
|
|
|
|
|
|
|
|
|
|
|
|
|
|
|
|
|
|
|
|
|
|
|
|
|
|
|
|
|
|
|
|
|
|
|
|
|
|
|
|
|
|
|
|
|
|
|
|
|
|
|
|
|
|
|
|
|
|
|
|
|
|
|
|
|
|
|
|
|
|
|
|
|
|
|
|
|
|
|
|
|
|
|
|
|
|
|
|
|
|
|
|
|
|
|
|
|
|
|
|
|
|
|
|
|
|
|
|
|
|
|
|
|
|
|
|
|
|
|
|
|
|
|
|
|
|
|
|
|
|
|
|
|
|
|
|
|
|
|
|
|
|
|
|
|
|
|
|
|
|
|
|
|
|
|
|
|
|
|
|
|
|
|
|
|
|
|
|
|
|
|
|
|
|
|
|
|
|
|
|
|
|
|
|
|
|
|
|
|
|
|
|
|
|
|
|
|
|
|
|
|
|
|
|
|
|
|
|
|
|
|
|
|
|
|
|
|
|
|
|
|
|
|
|
|
|
|
|
|
|
|
|
|
|
|
|
|
|
|
|
|
|
|
|
|
|
|
|
|
|
|
|
|
|
|
|
|
|
|
|
|
|
|
|
|
|
|
|
|
|
|
|
|
|
|
|
|
|
|
|
|
|
|
|
|
|
|
|
|
|
|
|
|
|
|
|
|
|
|
|
|
|
|
|
|
|
|
|
|
|
|
|
|
|
|
|
|
|
|
|
|
|
|
|
|
|
|
|
|
|
|
|
|
|
|
|
|
|
|
|
|
|
|
|
|
|
|
|
|
|
|
|
|
|
|
|
|
|
|
|
|
|
|
|
|
|
|
|
|
|
|
|
|
|
|
|
|
|
|
|
|
|
|
|
|
|
|
|
|
|
|
|
|
|
|
|
|
|
|
|
|
|
|
|
|
|
|
|
|
|
|
|
|
|
|
|
|
|
|
|
|
|
|
|
|
|
|
|
|
|
|
|
|
|
|
|
|
|
|
|
|
|
|
|
|
|
|
|
|
|
|
|
|
|
|
|
|
|
|
|
|
|
|
|
|
|
|
|
|
|
|
|
|
|
|
|
|
|
|
|
|
|
|
|
|
|
|
|
|
|
|
|
|
|
|
|
|
|
|
|
|
|
|
|
|
|
|
|
|
|
|
|
|
|
|
|
|
|
|
|
|
|
|
|
|
|
|
|
|
|
|
|
|
|
|
|
|
|
|
|
|
|
|
|
|
|
|
|
|
|
|
|
|
|
|
|
|
|
|
|
|
|
|
|
|
|
|
|
|
|
|
|
|
|
|
|
|
|
|
|
|
|
|
|
|
|
|
|
|
|
|
|
|
|
|
|
|
|
|
|
|
|
|
|
|
|
|
|
|
|
|
|
|
|
|
|
|
|
|
|
|
|
|
|
|
|
|
|
|
|
|
|
|
|
|
|
|
|
|
|
|
|
|
|
|
|
|
|
|
|
|
|
|
|
|
|
|
|
|
|
|
|
|
|
|
|
|
|
|
|
|
|
|
|
|
|
|
|
|
|
|
|
|
|
|
|
|
|
|
|
|
|
|
|
|
|
|
|
|
|
|
|
|
|
|
|
|
|
|
|
|
|
|
|
|
|
|
|
|
|
|
|
|
Figure 8.7 Scheme of the experimental setup of a laser speckle velocimeter integrated with dynamic digital microscopy providing measurements of absolute values of cell flow velocity and its direction: 1, digital video camera; 2, microobjective; 3, He:Ne laser (633 nm); 4, beamsplitter; 5, photodiodes; 6, red light filter; 7, photocurrent converters; 8, PC; 9, green light filters; 10, mirror; 11, illuminator; 12, thermally stabilized table; 13, lymph microvessel of mesentery. The inset shows the illumination of a lymphatic vessel by a focused Gaussian laser beam (a is the length of the laser beam waist and z is the separation between the flow axis and the waist plane of the laser beam).858
Figure 8.8 Time dependence of the lymph flow velocity in a lymphatic vessel of mean diameter 170 ± 5 μm of white rat mesentery: 1, recorded with a speckle velocimeter; and 2, with dynamic digital microscopy (see Fig. 8.7).858
526 |
Coherence-Domain Methods and Instruments for Biomedical Diagnostics and Imaging |
and mean lymph flow velocity 169 ± 4.6 μm/s.833,858 These dependences were obtained concurrently by laser speckle velocimeter and by processing of the video images. A laser speckle velocimeter allows one to measure the lymphocyte velocity in relative units only. The proportionality coefficient between the data of laser speckle velocimetry and the mean flow velocity, measured by dynamic digital microscopy, was determined from the slope of the line of linear regression between the velocities (measured by these two methods). The correlation coefficient of linear regression was equal to 0.723 for measurements in the lymph vessel and 0.966 for calibration measurements in the glass capillary.
8.2Diffusion-wave spectroscopy and interferometry: measurement of blood microcirculation
Experimental implementation of diffusion-wave spectroscopy is very simple: a measuring system should irradiate the scattering object under investigation with a light beam produced by a continuous wave laser and measure intensity fluctuations in scattered radiation within a single speckle with the use of a photomultiplier and
an electronic correlator. A typical setup employed for model experiments is presented in Fig. 8.9.80,81,875,1174,1175 Radiation (with a wavelength of 514 nm and a
power on the order of 2 W) produced by an argon laser with an intracavity etalon passes through a multimode fiber-optic cable and irradiates the surface of a solidstate bulk sample (finely dispersed TiO2 powder suspended in resin). The sizes of the sample are 15 × 15 × 8 cm. A spherical cavity 2.5 cm in diameter filled with a 0.2% aqueous suspension of polystyrene spheres 0.296 μm in diameter at the temperature of 25◦C is placed at the center of the sample 1.8 cm below its upper surface. The transport MFP lengths of photons for the suspension and the sample are lt = 0.15 and 0.22 cm, respectively. The absorption coefficients of these media are equal to each other, μa = 0.002 cm−1. The diffusion coefficient of Brownian motion in suspension is DB = 1.5 × 10⁻⁸ cm2/s. The single-mode fiber collects light emerging from a certain area of the object and transmits it to the photomultiplier. The output signal of the photomultiplier is fed to a digital autocorrelator, which reconstructs the time-domain autocorrelation function (AF) of the intensity fluctuations. This AF is related to the time-domain autocorrelation function of the field by the Siegert formula [see Eq. (4.28)]. Optical fibers were designed in such a manner as to pick up radiation from any area at the surface of the sample.
Figure 8.10 displays the experimental results for the normalized time-domain AF of the field for three different arrangements of optical fibers connected to a source of radiation and the detector, and compares these experimental data with theoretical predictions. Since the origin of the x–y coordinate frame lies on the surface of the sample above the center of the dynamic cavity, the source of radiation and the detector were placed along the y-axis in such a manner that the coordinate of the source was y = 1.0 cm, and the coordinate of the detector was y = −0.75 cm. Measurements were performed for x = 0.0, 1.0, and 2.0 cm. The distance between the source and the detector remained constant. The error of these

Tissue Optics: Light Scattering Methods and Instruments for Medical Diagnosis |
527 |
||||||||
|
|
|
|
|
|
|
|
|
|
|
|
|
|
|
|
|
|
|
|
|
|
|
|
|
|
|
|
|
|
|
|
|
|
|
|
|
|
|
|
|
|
|
|
|
|
|
|
|
|
|
|
|
|
|
|
|
|
|
|
|
|
|
|
|
|
|
|
|
|
|
|
|
|
|
|
|
|
|
|
Figure 8.9 Typical experimental setup for diffusion-wave (correlation) spectroscopy of scattering media.1175
Figure 8.10 Experimental and theoretical normalized autocorrelation functions of intensity fluctuations in light scattered from a TiO2 sample with a spherical cavity filled with a suspension of polystyrene spheres (see the text for the details).1175
measurements was estimated as 3%. The main source of errors was associated with uncertainties in the positioning of the optical fibers. Theoretical curves represent
the results of simulations based on the diffusion theory of autocorrelation with allowance for the experimental data.875,1174,1175 It can be easily seen that the AF
decays faster when the source of radiation and the detector are located close to the dynamic sphere, which gives rise to fluctuations in the time domain. It is in this area that most of the detected photons pass through the dynamic volume. Such a behavior of AFs allows one to employ the variation in their slopes (decay rates)
528 |
Coherence-Domain Methods and Instruments for Biomedical Diagnostics and Imaging |
as a parameter for the imaging of dynamic inhomogeneities in a medium. This model corresponds to a situation where the microcirculation rate of blood locally increases near by, e.g., a growing tumor. Using a similar approach, one can also model a directed blood flow. For this purpose, a through hole should be drilled in
a solid sample at a certain depth, and scattering fluid (e.g., Intralipid) should be circulated through this hole with a definite flow rate.1174,1175
To determine the AF of the field on nanosecond and subnanosecond time scales,
we should replace an electronic correlator by a Michelson interferometer with a large difference in arm lengths, which should be on the order of 3 m.80,1176 In this
case, the intensity I (τ) averaged in time depends on the delay time τ between the interfering fields in the interferometer, the carrier frequency ω of the optical signal, the average intensity Iave of speckles, and the time-domain AF g1(τ) of the field as
|
I (τ) |
= |
I |
ave |
1 + g1(τ) cos(ωτ) |
. |
(8.2) |
|
2 |
||||||||
|
|
|
|
A diagram of the experimental setup and the results of model experiments are presented in Fig. 8.11. Radiation of a continuous-wave laser scattered in the forward direction by an object within a single speckle is coupled into a long Michelson interferometer. The difference between arm lengths of this interferometer can be smoothly adjusted by variation of air pressure in the short arm. Effects arising due to a finite correlation length of laser radiation and geometric factors were excluded through the calibration of the measuring system with the use of diluted samples whose AFs do not decay on the time scales studied.
The possibilities of the DWS technique for medical applications have been demonstrated in Ref. 1177. The experimental setup employed in this study is shown in Fig. 8.12(a). The experimental system was based on a titanium:sapphire laser with a power of about 100 mW and a wavelength of 800 nm. Laser radiation was transmitted onto an object through a multimode optical fiber with a core 200 μm in diameter. Radiation was detected within a single speckle with the use of a singlemode fiber 5 μm in diameter. The distance between the optical fibers on the surface of an object remained constant and was equal to 6 mm. The rate of blood flow in the bulk of a tissue from a human forearm was adjusted with the use of a medical tonometer. A digital autocorrelator coupled with a photomultiplier in the regime of a photon counter was used to measure the time-domain AF of intensity fluctuations and the dependence of the AF shape on the pressure P produced by the tonometer. Such dependences for the AF of the field, which is related to the intensity AF by the Siegert formula, are presented in the logarithmic scale in Fig. 8.12(b). These dependencies show a sufficiently high sensitivity of the AF slope to variations in the applied pressure, i.e., changes in the rate of volume blood flow. In accordance with Eqs. (4.30) and (4.43), the normalized AF of field fluctuations can be represented in terms of two components related to the Brownian and directed motion of

Tissue Optics: Light Scattering Methods and Instruments for Medical Diagnosis |
529 |
|||||||||||||||||||||||||
|
|
|
|
|
|
|
|
|
|
|
|
|
|
|
|
|
|
|
|
|
|
|
|
|
|
|
|
|
|
|
|
|
|
|
|
|
|
|
|
|
|
|
|
|
|
|
|
|
|
|
|
|
|
|
|
|
|
|
|
|
|
|
|
|
|
|
|
|
|
|
|
|
|
|
|
|
|
|
|
|
|
|
|
|
|
|
|
|
|
|
|
|
|
|
|
|
|
|
|
|
|
|
|
|
|
|
|
|
|
|
|
|
|
|
|
|
|
|
|
|
|
|
|
|
|
|
|
|
|
|
|
|
|
|
|
|
|
|
|
|
|
|
|
|
|
|
|
|
|
|
|
|
|
|
|
|
|
|
|
|
|
|
|
|
|
|
|
|
|
|
|
|
|
|
|
|
|
|
|
|
|
|
|
|
|
|
|
|
|
|
|
|
|
|
|
|
|
|
|
|
|
|
|
|
|
|
|
|
|
|
|
|
|
|
|
|
|
|
|
|
|
|
|
|
|
|
|
|
|
|
|
|
|
|
|
|
|
|
|
|
|
|
|
|
|
|
|
|
|
|
|
|
|
|
|
|
|
|
|
|
|
|
|
|
|
|
|
|
|
|
|
|
|
|
|
|
|
|
|
|
|
|
|
|
|
|
|
|
|
|
|
|
|
|
|
|
|
|
|
|
|
|
|
|
|
|
|
|
|
|
|
|
|
|
|
|
|
|
|
|
|
|
|
|
|
|
|
|
|
|
|
|
|
|
|
|
|
|
|
|
|
|
|
|
|
|
|
|
|
|
|
|
|
|
|
|
|
|
|
|
|
|
|
|
|
|
|
|
|
|
|
|
|
|
|
|
|
|
|
|
|
|
|
|
|
|
|
|
|
|
|
|
|
|
|
|
|
|
|
|
|
|
|
|
|
|
|
|
|
|
|
|
|
|
|
|
|
|
|
|
|
|
|
|
|
|
|
|
|
|
|
|
|
|
|
|
|
|
|
|
|
|
|
|
|
|
|
|
|
|
|
|
|
|
|
|
|
|
|
|
|
|
|
|
|
|
|
|
|
|
|
|
|
|
|
|
|
|
|
|
|
|
|
|
|
|
|
|
|
|
|
|
|
|
|
|
|
|
|
|
|
|
|
|
|
|
|
|
|
|
|
|
|
|
|
|
|
|
|
|
|
|
|
|
|
|
|
|
|
|
|
|
|
|
|
|
|
|
|
|
|
|
|
|
|
|
|
|
|
|
|
|
|
|
|
|
|
|
|
|
|
|
|
|
|
|
|
|
|
|
|
|
|
|
|
|
|
|
|
|
|
|
|
|
|
|
|
|
|
|
|
|
|
|
|
|
|
|
|
|
|
|
|
|
|
|
|
|
|
|
|
|
|
|
|
|
|
|
|
|
Figure 8.11 Diffusion-wave interferometry:1176 (a) Experimental setup. (b) Normalized output signal (interference fringes) for (dots) τ = 0 and (squares) 20 ns for two-phase aqueous suspensions of polystyrene spheres 0.0385 and 0.299 μm in diameter. (c) The relevant autocorrelation function of the field g1(τ).
scatterers as1177 |
|
|
|
|
|
|
|
|
|
|
|
|
|
||
|
|
|
∞ p(s) exp −2 |
τ |
|
τ |
|
2 |
|
s |
|
|
|||
|
|
g1(τ) = 0 |
|
+ |
|
|
|
|
|
ds, |
(8.3) |
||||
|
|
τB |
τS |
lt |
|||||||||||
where τB−1 |
≡ |
|
|
|
= |
|
|
|
| ¯ | |
|
|
|
|||
|
T is defined in Eq. (4.30), |
τS−1 0.18GV |
q |
lt characterizes the di- |
|||||||||||
rected flow, and GV is the gradient of the flow rate. The other quantities involved in Eq. (8.3) are defined in Eqs. (4.26) and (4.43). The above relationship allows one to express the slope of the AF in terms of the diffusion coefficient and the gradient of the directed velocity of scatterers. When shear flow significantly dominates under Brownian motion, a semilogarithmic plot of g1(τ) versus τ1/2 gives a straight line with a slope proportional to the velocity of the scattering particles flow.
Figure 8.12(c) displays the measured velocity of blood flow as a function of the applied pressure. If we neglect the Brownian component, this dependence is characterized by the variation in the AF slope [see Eq. (8.3)]. Since measurements were performed at the wavelength close to the isosbestic point (805 nm), changes in the degree of oxygenation of the blood due to the variation in the applied pressure only slightly influence the AF slope (the velocity of blood flow). This circumstance allows us to find the correlation between the velocity of blood flow and variations in the diameter of vessels by means of simultaneous and independent measurements

530 |
Coherence-Domain Methods and Instruments for Biomedical Diagnostics and Imaging |
|||||||||||||||||||||||||||||||||||||||||||||||||||||||||||||||||||||||||||||||||||||||||||||||||||||
|
|
|
|
|
|
|
|
|
|
|
|
|
|
|
|
|
|
|
|
|
|
|
|
|
|
|
|
|
|
|
|
|
|
|
|
|
|
|
|
|
|
|
|
|
|
|
|
|
|
|
|
|
|
|
|
|
|
|
|
|
|
|
|
|
|
|
|
|
|
|
|
|
|
|
|
|
|
|
|
|
|
|
|
|
|
|
|
|
|
|
|
|
|
|
|
|
|
|
|
|
|
|
|
|
|
|
|
|
|
|
|
|
|
|
|
|
|
|
|
|
|
|
|
|
|
|
|
|
|
|
|
|
|
|
|
|
|
|
|
|
|
|
|
|
|
|
|
|
|
|
|
|
|
|
|
|
|
|
|
|
|
|
|
|
|
|
|
|
|
|
|
|
|
|
|
|
|
|
|
|
|
|
|
|
|
|
|
|
|
|
|
|
|
|
|
|
|
|
|
|
|
|
|
|
|
|
|
|
|
|
|
|
|
|
|
|
|
|
|
|
|
|
|
|
|
|
|
|
|
|
|
|
|
|
|
|
|
|
|
|
|
|
|
|
|
|
|
|
|
|
|
|
|
|
|
|
|
|
|
|
|
|
|
|
|
|
|
|
|
|
|
|
|
|
|
|
|
|
|
|
|
|
|
|
|
|
|
|
|
|
|
|
|
|
|
|
|
|
|
|
|
|
|
|
|
|
|
|
|
|
|
|
|
|
|
|
|
|
|
|
|
|
|
|
|
|
|
|
|
|
|
|
|
|
|
|
|
|
|
|
|
|
|
|
|
|
|
|
|
|
|
|
|
|
|
|
|
|
|
|
|
|
|
|
|
|
|
|
|
|
|
|
|
|
|
|
|
|
|
|
|
|
|
|
|
|
|
|
|
|
|
|
|
|
|
|
|
|
|
|
|
|
|
|
|
|
|
|
|
|
|
|
|
|
|
|
|
|
|
|
|
|
|
|
|
|
|
|
|
|
|
|
|
|
|
|
|
|
|
|
|
|
|
|
|
|
|
|
|
|
|
|
|
|
|
|
|
|
|
|
|
|
|
|
|
|
|
|
|
|
|
|
|
|
|
|
|
|
|
|
|
|
|
|
|
|
|
|
|
|
|
|
|
|
|
|
|
|
|
|
|
|
|
|
|
|
|
|
|
|
|
|
|
|
|
|
|
|
|
|
|
|
|
|
|
|
|
|
|
|
|
|
|
|
|
|
|
|
|
|
|
|
|
|
|
|
|
|
|
|
|
|
|
|
|
|
|
|
|
|
|
|
|
|
|
|
|
|
|
|
|
|
|
|
|
|
|
|
|
|
|
|
|
|
|
|
|
|
|
|
|
|
|
|
|
|
|
|
|
|
|
|
|
|
|
|
|
|
|
|
|
|
|
|
|
|
|
|
|
|
|
|
|
|
|
|
|
|
|
|
|
|
|
|
|
|
|
|
|
|
|
|
|
|
|
|
|
|
|
|
|
|
|
|
|
|
|
|
|
|
|
|
|
|
|
|
|
|
|
|
|
|
|
|
|
|
|
|
|
|
|
|
|
|
|
|
|
|
|
|
|
|
|
|
|
|
|
|
|
|
|
|
|
|
|
|
|
|
|
|
|
|
|
|
|
|
|
|
|
|
|
|
|
|
|
|
|
|
|
|
|
|
|
|
|
|
|
|
|
|
|
|
|
|
|
|
|
|
|
|
|
|
|
|
|
|
|
|
|
|
|
|
|
|
|
|
|
|
|
|
|
|
|
|
|
|
|
|
|
|
|
|
|
|
|
|
|
|
|
|
|
|
|
|
|
|
|
|
|
|
|
|
|
|
|
|
|
|
|
|
|
|
|
|
|
|
|
|
|
|
|
|
|
|
|
|
|
|
|
|
|
|
|
|
|
|
|
|
|
|
|
|
|
|
|
|
|
|
|
|
|
|
|
|
|
|
|
|
|
|
|
|
|
|
|
|
|
|
|
|
|
|
|
|
|
|
|
|
|
|
|
|
|
|
|
|
|
|
|
|
|
|
|
|
|
|
|
|
|
|
|
|
|
|
|
|
|
|
|
|
|
|
|
|
|
|
|
|
|
|
|
|
|
|
|
|
|
|
|
|
|
|
|
|
|
|
|
|
|
|
|
|
|
|
|
|
|
|
|
|
|
|
|
|
|
|
|
|
|
|
|
|
|
|
|
|
|
|
|
|
|
|
|
|
|
|
|
|
|
|
|
|
|
|
|
|
|
|
|
|
|
|
|
|
|
|
|
|
|
|
|
|
|
|
|
|
|
|
|
|
|
|
|
|
|
|
|
|
|
|
|
|
|
|
|
|
|
|
|
|
|
|
|
|
|
|
|
|
|
|
|
|
|
|
|
|
|
|
|
|
|
|
|
|
|
|
|
|
|
|
|
|
|
|
|
|
|
|
|
|
|
|
|
|
|
|
|
|
|
|
|
|
|
|
|
|
|
|
|
|
|
|
|
|
|
|
|
|
|
|
|
|
|
|
|
|
|
|
|
|
|
|
|
|
|
|
|
|
|
|
|
|
|
|
|
|
|
|
|
|
|
|
|
|
|
|
|
|
|
|
|
|
|
|
|
|
|
|
|
|
|
|
|
|
|
|
|
|
|
|
|
|
|
|
|
|
|
|
|
|
|
|
|
|
|
|
|
|
|
|
|
|
|
|
|
|
|
|
|
|
|
|
|
|
|
|
|
|
|
|
|
|
|
|
|
|
|
|
|
|
|
|
|
|
|
|
|
|
|
|
|
|
|
|
|
|
|
|
|
|
|
|
|
|
|
|
|
|
|
|
|
|
|
|
|
|
|
|
|
|
|
|
|
|
|
|
|
|
|
|
|
|
|
|
|
|
|
|
|
|
|
|
|
|
|
|
|
|
|
|
|
|
|
|
|
|
|
|
|
|
|
|
|
|
|
|
|
|
|
|
|
|
|
|
|
|
|
|
|
|
|
|
|
|
|
|
|
|
|
|
|
|
|
|
|
|
|
|
|
|
|
|
|
|
|
|
|
|
|
|
|
|
|
|
|
|
|
|
|
|
|
|
|
|
|
|
|
|
|
|
|
|
|
|
|
|
|
|
|
|
|
|
|
|
|
|
|
|
|
|
|
|
|
|
|
|
|
|
|
|
|
|
|
|
|
|
|
|
|
|
|
|
|
|
|
|
|
|
|
|
|
|
|
|
|
|
|
|
|
|
|
|
|
|
|
|
|
|
|
|
|
|
|
|
|
|
|
|
|
|
|
|
|
|
|
|
|
|
|
|
|
|
|
|
|
|
|
|
|
|
|
|
|
|
|
|
|
|
|
|
|
|
|
|
|
|
|
|
|
|
|
|
|
|
|
|
|
|
|
|
|
|
|
|
|
|
|
|
|
|
|
|
|
|
|
|
|
|
|
|
|
|
|
|
|
|
|
|
|
|
|
|
|
|
|
|
|
|
|
|
|
|
|
|
|
|
|
|
|
|
|
|
|
|
|
|
|
|
|
|
|
|
|
|
|
|
|
|
|
|
|
|
|
|
|
|
|
|
|
|
|
|
|
|
|
|
|
|
|
|
|
|
|
|
|
|
|
|
|
|
|
|
|
|
|
|
|
|
|
|
|
|
|
|
|
|
|
|
|
|
|
|
|
|
|
|
|
|
|
|
|
|
|
|
|
|
|
|
|
|
|
|
|
|
|
|
|
|
|
|
|
|
|
|
|
|
|
|
|
|
|
|
|
|
|
|
|
|
|
|
|
|
|
|
|
|
|
|
|
|
|
|
|
|
|
|
|
|
|
|
|
|
|
|
|
|
|
|
|
|
|
|
|
|
|
|
|
|
|
|
|
|
|
|
|
|
|
|
|
|
|
|
|
|
|
|
|
|
|
|
|
|
|
|
|
|
|
|
|
|
|
|
|
|
|
|
|
|
|
|
|
|
|
|
|
|
|
|
|
|
|
|
|
|
|
|
|
|
|
|
|
|
|
|
|
|
|
|
|
|
|
|
|
|
|
|
|
|
|
|
|
|
|
|
|
|
|
|
|
|
|
|
|
|
|
|
|
|
|
|
|
|
|
|
|
|
|
|
|
|
|
|
|
|
|
|
|
|
|
|
|
|
|
|
|
|
|
|
|
|
|
|
|
|
|
|
|
|
|
|
|
|
|
|
|
|
|
|
|
|
|
|
|
|
|
|
|
|
|
|
|
|
|
|
|
|
|
|
|
|
|
|
|
|
|
|
|
|
|
|
|
|
|
|
|
|
|
|
|
|
|
|
|
|
|
|
|
|
|
|
|
|
|
|
|
|
|
|
|
|
|
|
|
|
|
|
|
|
|
|
|
|
|
|
|
|
|
|
|
|
|
|
|
|
|
|
|
|
|
|
|
|
|
|
|
|
|
|
|
|
|
|
|
|
|
|
Figure |
8.12 In |
vivo |
measurements of blood flow velocity by means of the DWS |
technique:1177 (a) Experimental setup. (b) Experimental AFs of field fluctuations in backward scattering for different pressures applied to an arm (the pressure increases from 1 to 4). (c) Dynamics of the relative slope of the AFs for various pressures applied to an arm, P is the tonometer pressure. The arrows indicate the moments of time that correspond to the narrowing (ischemia) and broadening (hyperemia) of the vessels.
Tissue Optics: Light Scattering Methods and Instruments for Medical Diagnosis |
531 |
of the oxygenation degree and the volume of blood in a tissue with the use of a twofrequency Runman spectrometer (NIM Inc., Philadelphia). These measurements provide a pictorial illustration of the high efficiency of the DWS technique for in vivo studies of blood flow in bulk tissues.
We should also note that if the parameters of blood flow remain constant, the measured AFs provide information concerning the static optical parameters of a multiply scattering medium, i.e., lt or μs, μa, and g [see Eq. (4.43)]. Indeed, as shown in Ref. 1178, the half-width of the spectrum of time-domain intensity fluctuations under conditions of multiple scattering depends not only on dynamic and geometric parameters of scattering particles, but also on the absorptivity of erythrocytes in blood, which allows us to estimate the degree of blood oxygenation from the results of measurements performed far from the isobestic wavelength.
The hybrid instrument and measuring protocol based on diffuse correlation spectroscopy (blood flow information) and diffuse reflectance spectroscopy (blood oxygenation information) described in Ref. 1179 provide the evaluation of microcirculation and muscle metabolism in patients with vascular diseases. A CW laser (800 nm) with a long coherence length and an avalanche photodiode were used for correlation measurements; source-detector separations ranged from 0.5 to 3 cm and the sampling time was 1.5 s. A complete frame of data, cycling through all sourcedetector pairs, was acquired in 2.5 s. Ten healthy subjects and one patient with peripheral arterial disease were studied during 3-min arterial cuff occlusions of the arm and leg, and during 1-min plantar flexion exercises. Signals from different layers (cutaneous tissues and muscles) during cuff occlusion were differentiated, revealing strong hemodynamic responses from muscle layers. During exercise in healthy legs, the observed approximately 4.7-fold increase in relative blood flow was significantly lower than the corresponding increase in relative muscle oxygen consumption, which was approximately sevenfold. In the diseased patient, during exercise the magnitudes of both these physiological parameters were 1/2 of the healthy controls, and the oxygen saturation recovery time was twice that of the controls.
8.3 Blood flow imaging
It can be easily shown that the methods of Doppler flowmetry, which have been extensively developed within the past three decades, are, in general, identical to comparatively new speckle methods (which were proposed in the 1980s) in their applications to the analysis of the parameters of blood microcirculation because these two approaches provide an opportunity to determine the velocity of blood flow at a certain point.82 The review of Doppler methods for the monitoring of blood microcirculation in tissues is provided in Refs. 5, 22, 112, 826, 827, 831, 833, 838, 841, 842, and 1180–1182 and in several original papers, e.g., Refs. 67, 839, 840, and 1183–1193. Note that the extension of the Doppler method to the investigation of blood microcirculation in thick tissues has stimulated the development of the theory of Doppler signals and the methods of simulations and detection
Tissue Optics: Light Scattering Methods and Instruments for Medical Diagnosis |
533 |
on the concept that the region of single scattering within the tissue (volume occupied by a focused laser beam) will produce large correlated areas (speckles) in a transverse dimension, whereas the comparably large halo of multiple scattered photons produced by this beam will give rise to small speckles. Thus, the crosscorrelation function of the intensity fluctuations in two spatial points (CCD camera pixels) with the separation x larger than the size of the multiscattered speckles will reflect the form of single-scattered AF. The profile of a single-scattering AF will provide information about blood or lymph flow in a volume occupied by a focused laser beam. The attractiveness of this approach is defined by its applicability to the intermediate scattering regimes, whereas QELS provides accurate information only for a single scattering regime and DWS can be applied only for a case of diffusive photon propagation.
A typical approach to improve the performance of blood flow imagers, particularly to increase the imaging speed, is to parallelize measurements by using 1D or 2D arrays of photodetectors. A new generation of high-speed instruments for
full-field blood flow laser Doppler imaging (LDI) was recently developed on the basis of CMOS image sensors.1191–1193 The LDI system employing an integrating
CMOS image sensor delivers high-resolution blood flow images every 0.7–11 s, depending on the number of points in the acquired time-domain signal (32–512 points) and the image resolution (256 × 256 or 512 × 512 pixels). For the integrating imager, a digital CMOS camera based on the VCA1281 monochrome CMOS image sensor from Symagery (Canada) was utilized. This sensor operates in a rolling shutter mode; it has 280 horizontal × 1024 vertical resolution, a 7 × 7- μm pixel size, a 40-MHz sampling rate, and an 8-bit amplitude digital converter (ADC). The sensor has a specified flat spectral response in the range between 500 and 750 nm. The camera was connected to the host PC via a fast LVDS (lowvoltage differential signaling) interface providing for a high-speed transfer of the obtained frames.
For the object illumination, a solid-state-diode-pumped laser of 250-mW output optical power emitting at 671 nm was used. The laser beam was coupled to a 1.5-mm diameter plastic optical fiber. A GRIN (gradient index) lens of 1.8-mm diameter was placed at the distal end of the fiber. This configuration produced a uniform illumination of the object. The illuminated area was up to a 170-mm diameter. The backscattered light was collected with an objective (f = 6 mm) with a low f -number (1.2), providing the system with the superior photon collection efficiency that becomes critical for short integration times (in the range of a few tens of milliseconds). Typically, the imager head was placed at a distance of 150–250 mm from the investigated tissue surface (see Fig. 8.14).
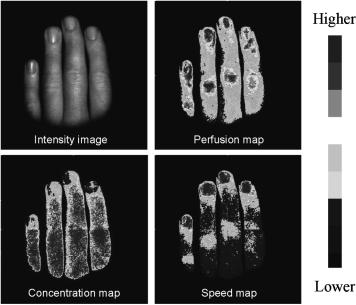
The specially developed software allows for changing the sensor parameters for control of the data acquisition mode, for acquisition of the data, and for display of the flow-related (perfusion, concentration, speed) maps. A photographic image of the sample and flow-related maps displayed on the monitor are obtained with the same image sensor; therefore, the obtained flow maps can be easily associated with an area of interest on the sample. The signal sampling frequency is inversely

536 |
Coherence-Domain Methods and Instruments for Biomedical Diagnostics and Imaging |
Figure 8.15 Flow-related maps obtained with a CMOS integrated imager on finger skin (ROI = 512 × 512 pixels): image of the object (intensity image); perfusion map (lower is 200 a.u. and higher is 700 a.u.); blood concentration map (lower is 140 a.u. and higher is 310 a.u.); flow speed map (lower is 400 a.u. and higher is 1500 a.u.). The imaging area is 11 × 11 cm. The imaging time is 5 s total.1193
normalized M0 value that is measured by laser Doppler with integrating photodetectors. The images shown in Fig. 8.15 demonstrate a difference between the perfusion (M1) and concentration (M0) maps. It looks like LDI provides more objective information rather that the LSI method because with the LDI technique, the concentration and speed signals can be measured independently. In LSI, these two signals are typically mixed and it can thus be hard to attribute an exact cause for the changes in the contrast signal.1204 However, a good correlation (R2 = 0.98) between LDI and LSI measurements of the same area of regional cerebral blood flow (CBF) for different animals (male Wistar rats) was found.1197 A detailed comparison of the laser-Doppler and speckle contrast methods of blood flow imaging can be found in Ref. 1199. It follows from this analysis that the speckle contrast technique can provide an image of tissue vascular structure with the relative distribution of blood velocity [correspondingly to a nonlinear response, described by Eq. (4.34)], but it does not provide a linear measurement of perfusion in comparison with LDI.
However, the speckle-contrast technique LASCA, whose fundamentals are dis-
cussed in Section 4.4.3, is a conceptually simple high-performance technique for
blood flow imaging.82,83,112,821,827,829–831,863,865–868,1194–1201 The measuring sys-
tem employs a CCD camera, a frame grabber, and dedicated software for the computation of the local contrast of a speckle pattern and conversion of the contrast into a color map (which gives a map of flow velocities). The resulting image represents

Tissue Optics: Light Scattering Methods and Instruments for Medical Diagnosis |
537 |
the contrast of the speckle field averaged in time. However, such an averaging is performed rather quickly (the averaging time is usually 5–30 ms) in order to permit real-time measurements.
Equation (4.34) gives an expression for the speckle contrast in the timeaveraged speckle pattern as a function of the exposure time T and the correlation time,
1 |
|
τc = ak0v , |
(8.7) |
where v is the mean velocity of the scatterers, k0 is the lightwave number, and a is a factor that depends on the Lorentzian width and scattering properties of the tissue.1205 As in LDI, it is theoretically possible to relate the correlation times, τc, to the absolute velocities of the red blood cells, but this is difficult to do in practice because the number of moving particles that light interacted with and their orientations are unknown.1205 However, relative spatial and temporal measurements
of velocity can be obtained from the ratios of 2T /τc, which is proportional to the velocity and defined as the measured velocity.831,866,867
The schematic diagram of the experimental setup is shown in Fig. 4.14.
A He:Ne laser beam (λ = 633 nm, 3 mW) was coupled into an 8-mm diameter fiber bundle, which was adjusted to illuminate the area of interest evenly.831,866,867
The illuminated area was imaged through a zoom stereo microscope (SZ6045TR, Olympus, Japan) onto a CCD camera (PIXELFLY, PCO Computer Optics, Germany) with 480 × 640 pixels, yielding an image of 0.8 to 7 mm, depending on the magnification; the exposure time T of the CCD was 20 ms. Images were acquired through easily controlled software (PCO Computer Optics, Germany) at 40 Hz.
The raw speckle images were acquired to compute the speckle contrast image. The number of pixels used to compute the local speckle contrast can be selected by the user: lower numbers reduce the validity of the statistics, whereas higher numbers limit the spatial resolution of the technique. To ensure proper sampling of the speckle pattern, the size of a single speckle should be approximately equal to the size of a single pixel in the image, which is equal to the width of the diffractionlimited spot size and is given by 2.44 λf/D, where λ is the wavelength and f/D is the f -number of the system. In the system, the pixel size was 9.9 μm. With a magnification of unity, the required f/D is 6.4 at a wavelength of 633 nm. Squares of 5 × 5 pixels were used according to the theoretical studies.83 The software calculated the speckle contrast for any given square of 5 × 5 pixels and assigned this value to the central pixel of the square. This process was then repeated to obtain a speckle contrast map. To each pixel in the speckle contrast map, the measured velocity (2T /τc) was obtained through Eq. (4.34) that describes the relationship between the correlation time and velocity and therefore measures the velocity map.
To compute the relative blood flows in vessels of interest, first a threshold was set in a region of interest from the measured velocity image and then the vessels of interest were identified by the pixels with values above this threshold. The mean values of the measured velocity in those pixels were computed at each time point.
538 |
Coherence-Domain Methods and Instruments for Biomedical Diagnostics and Imaging |
The relative velocity in the vessel of interest was expressed as the ratio of the measured velocity in the condition of stimuli to that of the control condition.
LSI is a noninvasive full-field optical imaging method with high spatial and
temporal resolution, which is a convenient technique in measuring the dynamics of CBF.831,866,867,1197,1198,1201,1203,1206 In particular, in Ref. 831, the LSI method was
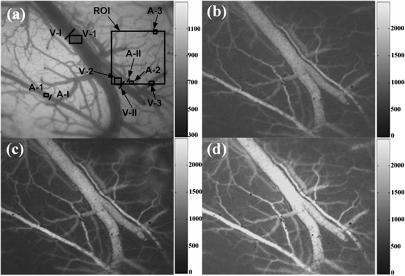
used to monitor the dynamics of CBF in several animal models during sciatic stimulation. Stimulation of the sciatic nerve was similar to that used in conventional physiological studies. Blood flow was monitored in the somatosensory cortex in a total of 16 rats under electrical stimulation of the sciatic nerve, and the activated blood flow distribution was obtained at different levels of arteries/veins and at the change of activated areas. One example of the results is shown in Fig. 8.16, in which the brighter areas correspond to the area of increased blood flow. In comparison with LDI, an area of 1 mm2 ROI in Fig. 8.16(a) was chosen to evaluate its mean velocity (Fig. 8.17): the evoked CBF started to increase at 0.7 ± 0.1 s,
peaked at 3.1 ± 0.2 s, and then returned to the baseline level. It is consistent with the conclusions obtained from the LDI technique.1208,1209 In order to differenti-
ate the response patterns of artery/vein under the same stimulus, six distinct levels of vessels were labeled in Fig. 8.16(a) and their changes of blood flow displayed. The results clearly showed that the response patterns of arteries and veins in the somatosensory cortex were totally different: vein 1 (V-1, 140 μm in diameter) remained almost unaffected, and arteriole 1 (A-1, 35 μm in diameter) responded slowly; arteriole 2 (A-2, 35 μm in diameter) peaked at 3.5 ± 0.5 s after the onset of stimulation and then reached the steady-state plateau; vein 2 (V-2, 70 μm in diameter) presented a delay and mild response; blood flow in the capillaries (A-3 and V-3, 10 μm in diameter) surged readily and increased significantly. The changes in arteries and veins with different diameters were also measured.831 The activation pattern of cerebral blood flow was discrete in spatial distribution and highly
localized in the evoked cortex with the temporal evolution. This is consistent with the hypothesis of Roy and Sherrington.1207–1209
The influence of epidurally applied hyperosmotic glycerol on in vivo the resting CBF was also investigated using the LSI technique (see Section 5.81).831 The skull was removed, and intact dura mater was exposed. To study the influence of glycerol on in vivo CBF, a small area of dura mater was removed. Warm dehydration glycerol was administrated near the exposed area. Velocity images of CBF under the effect of glycerol are shown in Fig. 5.44. When glycerol diffused in brain tissue and influenced CBF under the dura mater, the CBF in the exposed area would also change. Figure 5.45 gives the time course of changes in four different vessels.
As described above, LSI is based on the first-order spatial statistics of timeintegrated speckle. The main disadvantage of LASCA is the loss of resolution caused by the need to average over a block of pixels to produce the spatial statistics used in the analysis, although it actually has higher resolution than other techniques such as scanning laser Doppler. A modified LSI method utilizing the temporal statistics of time-integrated speckle was recently suggested.1210 In this method, each pixel in the speckle image can be viewed as the single-point area.
Tissue Optics: Light Scattering Methods and Instruments for Medical Diagnosis |
539 |
Figure 8.16 Blood flow change in the contralateral somatosensory cortex of rats under unilateral sciatic nerve stimulation.1207 (a) A vascular topography illuminated with green light (540 ± 20 nm); (b) blood activation map at prestimulus; (c) 1 s and (d) 3 s after the onset of stimulation. The relative blood flow images are shown and converted from the speckle-contrast images, in which the brighter areas correspond to the area of increased blood flow. A-1, A-2, A-3 and V-1, V-2, V-3 represent the arbitrarily selected regions of interest (ROI) for monitoring changes in blood flow. A-I, A-II and V-I, V-II represent the selected loci on the vessel whose diameters are measured in the experiment.
Then, the signal processing consists of calculating the temporal statistics of the intensity of each pixel in the image as
Ni,j = |
Ii,j,t2 t − Ii,j,t t2 |
, |
|
|
|
Ii,j,t t2 |
|
||
i = 1–480, |
j = 1–640, |
t = 1 − m, |
(8.8) |
|
where Ii,j,t is the instantaneous intensity of the ith and j th pixels at the t frame of raw speckle images, and Ii,j,t t is the average intensity of the ith and j th pixels over the consecutive m frames. Ni,j is inversely proportional to the velocity of the scattering particles. The value Ni,j of each pixel in the consecutive m frames (Ii,j,t ) of the raw speckle pattern is computed according to Eq. (8.8). The process is then repeated for the next group of m frames. The results are given as 2D grayscale (65,536 shades) or false-color (65,536 colors) coded maps that describe the spatial variation of the velocity distribution in the area examined.
Other approaches of LASCA technique improvement, in particular noise reduc-
tion, based on an active speckle averaging scheme that ensures perfect ensemble averaging are also described.1199,1202 These approaches can use various methods
to generate speckle images in reduced processing time, such as the use of sec-

540 |
Coherence-Domain Methods and Instruments for Biomedical Diagnostics and Imaging |
Figure 8.17 The relative change of blood flow in the six areas indicated in Fig. 8.16(a) (divided by the values of the prestimuli).1207
ondary low-coherence light sources (illumination with a dispersed laser beam that has passed a rotating diffuser) or vibration techniques.
8.4Interferometric and speckle-interferometric methods for the measurement of biovibrations
A large number of optical methods have been proposed to date for the monitoring of biovibrations. Specifically, a fiber-optic sensor based on a single-mode x-coupler was successfully employed for the monitoring of heartbeats of patients examined with the use of a magnetic resonance tomograph.1211 Contactless biovibrometers with an ultrahigh sensitivity based on heterodyne laser interferometers with
a high automation degree and well-developed software were described in detail by Khanna et al.1212,1213 Their investigations have been devoted to the measurement
of vibrations of different components in the inner ear of animals. The confocal scheme of the heterodyne interference microscope employed in these studies made it possible to investigate vibrations of various layers of the tissue. This approach provided a record sensitivity with respect to small displacements of objects with low reflectivities (on the order of 10−4–10−5). The sensitivity achieved in these experiments within the range of vibration frequencies from 50 to 2000 Hz was 10−11 m. A conceptually similar but much simpler laser system for the investigation of biovibrations was described in Ref. 1214. This system also employs a heterodyne
Tissue Optics: Light Scattering Methods and Instruments for Medical Diagnosis |
541 |
interferometer and is referred to as a laser Doppler vibrometer. This instrument, which operates within a frequency range up to 10 kHz, was used to monitor vibration spectra of a tympanic membrane under various disorders of the inner ear. Holographic analysis of vibrations of a tympanic membrane is also described in the literature (e.g., see Ref. 1215). An optical system for remote monitoring of cardiovibrations is presented in Ref. 864. An optical interferometer with a 633-nm
He:Ne laser was utilized to detect micrometer displacements (sensitivity of 366.2 μm/s) of the skin surface.1216 The detected velocity of skin movement is related
to the time derivative of the blood pressure. Motion velocity profiles of the skin surface, near each superficial artery and auscultation point on a chest for the two heart valve sounds, exhibited distinctive profiles. The designed optical cardiovascular vibrometer has the potential to become a simple noninvasive approach to cardiovascular screening.
A laser Doppler technique based on the self-mixing effect in the diode laser840,841 was used for cardiovascular pulse measurements above the radial artery in the wrist.1217,1218 The developed self-mixing interferometer was used to mea-
sure the skin displacement, which was induced by a cardiovascular pulse. The reconstructed Doppler spectrograms followed the first derivative of the corresponding blood pressure pulse for both normal and abnormal pulse conditions. The correlation coefficient between the shapes of the Doppler spectrograms and the first derivative of the blood pressure pulse for ten investigated volunteers (738 cardiovascular pulsegrams) was found as 0.95 with a standard deviation of 0.05. A selfmixing interferometer was also used to measure the baroreflex effect and the elastic modulus of the arterial wall.
The fact that the interaction of laser radiation with tissues gives rise to the formation of speckle structures did not receive an adequate consideration in biovibrometry. The interference between speckle-modulated (reflected from a tissue) and reference fields has many specific features in this case. In designing biovi-
brometers, one should take into account these specific features and sometimes even make use of them76,836,1219–1222 (see Chapter 4). The development of coherent op-
tical contactless biovibrometers for the purpose of medical diagnostics is closely related to the solution of the problem of diffraction of laser beams propagating
in nonstationary, randomly nonuniform media.76 Several speckle techniques have been developed thus far for medical applications.76,836,1219–1222 A diagnostic probe
based on a miniature speckle/electronic-interference system, including a fiber-optic speckle interferometer and a matrix photodetector, was described in Ref. 1221. Sequential frame-by-frame analysis of the distribution of electron speckles makes it possible to image vibrations in three dimensions with a high quality. The probe was designed for the quantitative analysis of vibrations of the tympanic membrane and vocal chords.
The possibility of applying a Michelson speckle interferometer to the investigation of cardiovibrations and the detection of pulse waves was substantiated in Refs. 836, 1219, and 1220. Here, we briefly consider the main results of these studies and present some results on the detection of pulse waves with the use of the
542 |
Coherence-Domain Methods and Instruments for Biomedical Diagnostics and Imaging |
speckle technique based on the diffraction of focused laser beams. Medical diagnostics require simple and noise-resistant optical systems. The homodyne speckle interferometer shown in Fig. 8.18 meets these requirements. The output signal of this interferometer reaches its maximum when the speckle fields are matched (see Section 4.2). For focused laser beams, such matching can be easily achieved by the equalization of the arms of the interferometer. The speckle vibrometer can operate in two regimes: with comparatively large vibration amplitudes (l0 > λ/4, the regime of fringe counting) and with small vibration amplitudes (l0 < λ/4, when the random amplitude of the output signal displays an additional dependence on the initial phase). If the number of speckles within the receiving aperture satisfies the condition Nsp > 4, then the output signal of the interferometer has Gaussian statistics of the first order, i.e., the amplitude of this signal is characterized by a Rayleigh distribution.836 The relevant experimental and theoretical dependencies of the averaged amplitude U and variance σ2U of the output signal on the number of speckles within the aperture of the photodetector show a way to improve the signal-to-noise ratio in homodyne interferometers (see Fig. 8.19). It can be demonstrated that in the case of vibrations with large amplitudes, we have
U |
dav2 |
(Nsp)0.5, σU2 |
≈ |
Nsp, |
(8.9) |
|
= |
|
|
|
where dav is the mean transverse size of a speckle and Nsp = (2Ra/dav)2 for a circular aperture with a diameter 2Ra. In writing Eq. (8.9), we assume that variations in speckle sizes do not change the intensities of the interfering beams.
Figure 8.18 Diagram of a homodyne speckle interferometer for the investigation of biovibrations.836
Thus, to increase the amplitude of the output signal of a speckle interferometer, one should choose schemes that would ensure the detection of a large number of speckles with a maximum mean size, i.e., employ focused beams and a photodetector with a wide aperture. Considerable longitudinal displacements are usually accompanied by transverse and angular shifts of an object surface. As demonstrated

Tissue Optics: Light Scattering Methods and Instruments for Medical Diagnosis |
543 |
Figure 8.19 Experimental and theoretical dependencies of (a) the averaged amplitudeU of the output signal of a speckle interferometer and (b) its variance σ2U on the number of speckles Nsp within the receiving aperture (the rough surface is characterized by a considerable amplitude of vibrations, l0 λ; the sizes of speckles remain unchanged, and averaging is performed over 300 realizations of the reference speckle field).836
in Ref. 836, these shifts give rise to low-frequency modulation of the output signal of an interferometer. The depth of this modulation varies within a broad range from 0 to 100%, depending on specific realizations of the signal and reference speckle fields. Since it was demonstrated that such a modulation is caused by intensity fluctuations in a group of closely located speckles, one can considerably weaken spurious modulation by blocking the relevant group of speckles with a small opaque screen.
For vibrations with small amplitudes, the output signal of an interferometer has substantially different statistics. The modulus of the output signal in this case has an exponential distribution function with a maximum probable value equal to zero. However, the mean value of the modulus of the signal and its variance are characterized by the same dependencies on Nsp as in the case of vibrations with large amplitudes836 [see Eq. (8.9)].
Taking into account the aforesaid and using Eqs. (4.22) and (4.23), we can represent the output signal of a homodyne interferometer in the following form:
Ui (t) = Ai sin[φi + ALH (t)], |
(8.10) |
where H (t) is the normalized signal with a variance equal to unity that describes the waveform of vibrations on the surface of a bioobject, Ai and φi are random quantities determined by the conditions of detection of speckle interferograms and the chosen realization of the surface with an index i, and AL is the amplitude of vibrations. Equation (8.10) also holds true for a differential interferometer if the quantity AL is defined as the difference of the vibration amplitudes at two points. A laser differential speckle interferometer with two beams focused onto the surface of an object has been successfully employed for the detection of the human pulse at various points of skin surface in the wrist area.836 As demonstrated in
544 |
Coherence-Domain Methods and Instruments for Biomedical Diagnostics and Imaging |
Ref. 1222, the investigation of pulse waves through the analysis of phase portraits of the output signal of a differential speckle interferometer holds much promise for cardiodiagnostics. However, an appropriate filtration of the signal should be carried out in order to efficiently eliminate the influence of lateral shifts of skin surface caused by the pulse wave.
Basing on the speckle technology developed, a robust vibrometer for medical applications can be designed1220 (see Fig. 8.20). However, the simplicity of the instrument is achieved at the cost of a nontrivial description of the response function of the vibrometer. Intensity fluctuations in scattered light in the case of diffraction of a focused Gaussian beam are related to vibrations of an object by some nonlinear random function. Nevertheless, due to regular variations in the speckle field (displacement and decorrelation of speckles) caused by vibrations of the scattering surface, the signal at the output of the photodetector contains spectral components that correspond to vibrations of the surface. The complex motion of the surface gives rise to additional nonlinearities in the response function. For example, a periodic motion of skin surface caused by a pulse wave can be considered as a superposition of at least three displacements: displacement normal to the surface, angular displacement, and transverse displacement (along the surface). For the measuring system shown in Fig. 8.20, normal vibrations do not contribute to the output signal. Comparatively small angular vibrations are responsible for transverse oscillations of speckles in the observation plane (without decorrelation of speckles), whereas the small transverse surface shifts lead to a partial decorrelation of the speckle field. Thus, time-domain intensity fluctuations of the scattered field in the case of periodic vibrations of a surface also involve a periodic component. In such a situation, the nonlinear random operator that relates intensity fluctuations to the displacement of the scattering surface depends on the sizes of the irradiated surface area, conditions of speckle observation, and the specific realization of the surface under study. However, numerical analysis of the diffraction of a focused Gaussian beam from a moving rough surface with Gaussian statistics within the framework of the Kirchhoff approximation shows that when the amplitudes of transverse shifts are less than the surface correlation length (for example, for human skin, Lc 60– 80 μm) and the amplitudes of angular vibrations are less than one degree, statistical and nonlinear properties of the signal do not exert a considerable influence on the detection of the motion law of a rough surface.1220
A fiber-optic sensor based on these principles is shown in Fig. 8.20(a). This sensor transforms skin vibrations caused by a pulse wave into the corresponding motion of speckles, which is detected in the observation plane. To standardize the reflective properties of the surface and exclude bulk scattering in tissues, the device employs a thin rubber membrane, which is attached to the surface of the skin in such a manner that it does not perturb the motion of the skin surface. Various thin backscattering films produced by the spraying of a substance on the skin surface can also be employed as standard reflectors. It should be noted that this method also provides a sufficient efficiency in the case of an open skin surface, because the contribution of bulk scattering is suppressed to a considerable extent due to a
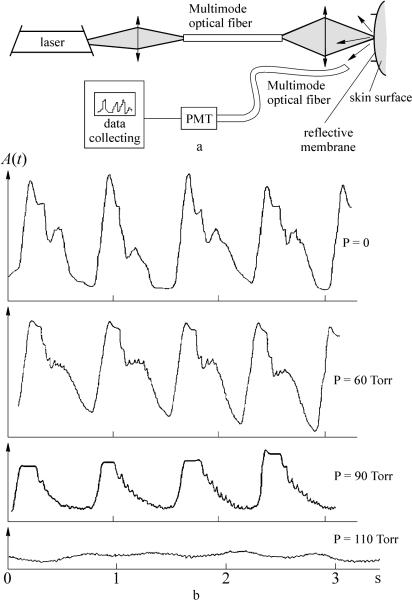
Tissue Optics: Light Scattering Methods and Instruments for Medical Diagnosis |
545 |
Figure 8.20 Fiber-optic laser speckle vibrometer.1220 (a) Diagram of the instrument. (b) Pulsograms detected in the wrist area of a young man (24 yr) for various pressures P in the arm cuff of a tonometer.
sharp focusing of radiation onto the skin surface, and the skin surface itself can be satisfactorily described in terms of Gaussian statistics. Figures 8.20(b)–(e) present typical pulsograms measured with the use of a fiber-optic speckle vibrometer in the wrist area of a healthy young man for different external pressures in the forearm area (as before, a medical tonometer was used for these measurements). Obviously,
546 |
Coherence-Domain Methods and Instruments for Biomedical Diagnostics and Imaging |
this device can be considered an advanced prototype of a compact, simple, and reliable remote probe of biovibrations with a high spatial resolution, which can be assembled with the use of a diode laser and a photodiode integrated with segments of multimode optical fibers. Such a probe would be useful in cardiology, for a diagnosis of vascular diseases, and in sport medicine (monitoring of self-contractions of muscles and other tissues).
8.5 Optical speckle topography and tomography of tissues
Methods of speckle topography and tomography are rapidly progressing at
the moment.76,135,136,138,139,155,343,395,396,566,799,825,827–832,834,835,843–846,1196,1202,
1223–1228,1239 Local statistical and correlation analysis offers much promise as a method for topographic mapping and structure monitoring of scattering objects. Local estimates of correlation characteristics [correlation or structure functions or their parameters, see Eqs. (4.20) and (4.21), and Figs. 4.5 and 4.6] and normalized statistical moments [the contrast VI and asymmetry coefficient Qa are usually employed, see Eqs. (4.5)–(4.7)] are highly sensitive to the structure parameters of an object, such as the correlation length Lc and the standard deviation σL of optical altitudes (thicknesses) of inhomogeneities or the relevant correlation length Lφ and the standard deviation σφ of phase fluctuations of the
boundary field (see Section 4.1) in the case of the diffraction of focused laser
beams.76,155,343,825,827,829,830,834,835,1224–1233 An object under study can be consid-
ered as an irregular system of lenslets with definite statistical characteristics that display intensity fluctuations similar to those observed when a focused laser beam is scanned over the surface of an object.835
Intensity fluctuations include two components (see Fig. 8.21). The first component is a background with a relatively small and comparatively smooth varying amplitude. The second component is represented by infrequent high-intensity pulses related to matched inhomogeneities (the distances between the plane of the waist of the incident laser beam and the object, and between the object and the photodetector are matched with the effective focal length of the inhomogeneity, which ensures effective reimaging of the waist of the laser beam into the observation plane).
We can classify the inhomogeneities by analyzing the contrast VI and the asymmetry coefficient Qa as functions of the distance between the waist plane of the laser beam and the surface of an object. Using this approach, we can reconstruct statistical distributions of fluctuations of the refractive index of a medium.77 The fact that VI and Qa abruptly increase when the ratio of the radius of the laser beam
to the correlation length satisfies the condition w/Lφ 1 is a direct manifestation of the microfocusing effect in the far-field diffraction zone835,1229 (see Fig.
8.22 for VI, z = ±0.4 mm). The growth in the ratio w/Lφ(| z| > 0.4 mm) is accompanied by a decrease in the quantities VI and Qa , which reach values corresponding to completely developed speckles. These effects can occur in the case of weakly scattering objects, such as thin tissue layers or cellular monolayers, when Lc Lφ d (where d is the thickness of the sample), Lc λ, and the standard

Tissue Optics: Light Scattering Methods and Instruments for Medical Diagnosis |
547 |
Figure 8.21 Realizations of speckle intensity fluctuations obtained with a focused laser beam scanned over an epidermis sample of psoriatic human skin (epidermal stripping).343 The upper and lower realizations were obtained with a laser beam focused in front of and behind the sample surface, respectively. The middle realization corresponds to a laser beam focused exactly on the surface.
deviation σφ related to phase fluctuations of the field is completely determined by fluctuations of the refractive index δn.
Multiple scattering is characteristic of optically thick tissue layers. In this case, the spatial distribution of scattered light has a broad angular spectrum, and depolarization effects play an important role. The spatial distribution of the correlation properties of the scattered field, which is related to the structure of an object, can be considered in a manner similar to diffusion-wave spectroscopy [see Eq. (4.43)] with allowance for the fact that an object has a static structure, and a laser beam (or the object itself) is scanned over the surface of the object at a definite rate. Along with the chosen beam radius and the character of the optical inhomogeneities of the medium, the rate of scanning determines the fluctuations of the scattered field in the time domain. In such a situation, the normalized autocorrelation function of the intensity fluctuations is generally defined by Eq. (4.20) with ξ ≡ t and ξ ≡ τ. The behavior of the structure function [see Eq. (4.21)] near the zero value of its argument, which corresponds to the highest efficiency of the high-frequency spatial
intensity fluctuations, can be conveniently characterized in this case in terms of the exponential factor νI as835,1224
ν |
I = |
ln[DI ( τ2)/DI ( τ1)] |
. |
(8.11) |
|
||||
|
ln(| τ2|/| τ1|) |
|
||
To analyze the polarization properties of speckle fields, we can employ the following time-domain firstand second-order statistical characteristics of the intensity
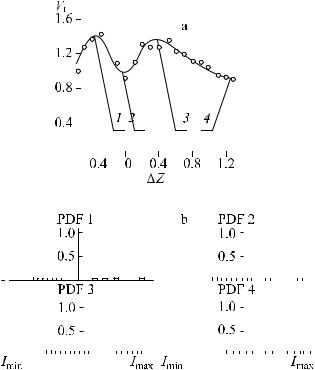
548 |
Coherence-Domain Methods and Instruments for Biomedical Diagnostics and Imaging |
|||||||||||||||||||||||||||||||||||||||||||||||||||||||||||||||
|
|
|
|
|
|
|
|
|
|
|
|
|
|
|
|
|
|
|
|
|
|
|
|
|
|
|
|
|
|
|
|
|
|
|
|
|
|
|
|
|
|
|
|
|
|
|
|
|
|
|
|
|
|
|
|
|
|
|
|
|
|
|
|
|
|
|
|
|
|
|
|
|
|
|
|
|
|
|
|
|
|
|
|
|
|
|
|
|
|
|
|
|
|
|
|
|
|
|
|
|
|
|
|
|
|
|
|
|
|
|
|
|
|
|
|
|
|
|
|
|
|
|
|
|
|
|
|
|
|
|
|
|
|
|
|
|
|
|
|
|
|
|
|
|
|
|
|
|
|
|
|
|
|
|
|
|
|
|
|
|
|
|
|
|
|
|
|
|
|
|
|
|
|
|
|
|
|
|
|
|
|
|
|
|
|
|
|
|
|
|
|
|
|
|
|
|
|
|
|
|
|
|
|
|
|
|
|
|
|
|
|
|
|
|
|
|
|
|
|
|
|
|
|
|
|
|
|
|
|
|
|
|
|
|
|
|
|
|
|
|
|
|
|
|
|
|
|
|
|
|
|
|
|
|
|
|
|
|
|
|
|
|
|
|
|
|
|
|
|
|
|
|
|
|
|
|
|
|
|
|
|
|
|
|
|
|
|
|
|
|
|
|
|
|
|
|
|
|
|
|
|
|
|
|
|
|
|
|
|
|
|
|
|
|
|
|
|
|
|
|
|
|
|
|
|
|
|
|
|
|
|
|
|
|
|
|
|
|
|
|
|
|
|
|
|
|
|
|
|
|
|
|
|
|
|
|
|
|
|
|
|
|
|
|
|
|
|
|
|
|
|
|
|
|
|
|
|
|
|
|
|
|
|
|
|
|
|
|
|
|
|
|
|
|
|
|
|
|
|
|
|
|
|
|
|
|
|
|
|
|
|
|
|
|
|
|
|
|
|
|
|
|
|
|
|
|
|
|
|
|
|
|
|
|
|
|
|
|
|
|
|
|
|
|
|
|
|
|
|
|
|
|
|
|
|
|
|
|
|
|
|
|
|
|
|
|
|
|
|
|
|
|
|
|
|
|
|
|
|
|
|
|
|
|
|
|
|
|
|
|
|
|
|
|
|
|
|
|
|
|
|
|
|
|
|
|
|
|
|
|
|
|
|
|
|
|
|
|
|
|
|
|
|
|
|
|
|
|
|
|
|
|
|
|
|
|
|
|
|
|
|
|
|
|
|
|
|
|
|
|
|
|
|
|
|
|
|
|
|
|
|
|
|
|
|
|
|
|
|
|
|
|
|
|
|
|
|
|
|
|
|
|
|
|
|
|
|
|
|
|
|
|
|
|
|
|
|
|
|
|
|
|
|
|
|
|
|
|
|
|
|
|
|
|
|
|
|
|
|
|
|
|
|
|
|
|
|
|
|
|
|
|
|
|
|
|
|
|
|
|
|
|
|
|
|
|
|
|
|
|
|
|
|
|
|
|
|
|
|
|
|
|
|
|
|
|
|
|
|
|
|
|
|
|
|
|
|
|
|
|
|
|
|
|
|
|
|
|
|
|
|
|
|
|
|
|
|
|
|
|
|
|
|
|
|
|
|
|
|
|
|
|
|
|
|
|
|
|
|
|
|
|
|
|
|
|
|
|
|
|
|
|
|
|
|
|
|
|
|
|
|
|
|
|
|
|
|
|
|
|
|
|
|
|
|
|
|
|
|
|
|
|
|
|
|
|
|
|
|
|
|
|
|
|
|
|
|
|
|
|
|
|
|
|
|
|
|
|
|
|
|
|
|
|
|
|
|
|
|
|
|
|
|
|
|
|
|
|
|
|
|
|
|
|
|
|
|
|
|
|
|
|
|
|
|
|
|
|
|
|
|
|
|
|
|
|
|
|
|
|
|
|
|
|
|
|
|
|
|
|
|
|
|
|
|
|
|
|
|
|
|
|
|
|
|
|
|
|
|
|
|
|
|
|
|
|
|
|
|
|
|
|
|
|
|
|
|
|
|
|
|
|
|
|
|
|
|
|
|
|
|
|
|
|
|
|
|
|
|
Figure 8.22 The correspondence between (a) the contrast values and (b) the shape of the distribution of speckle intensity fluctuations (PDF) as functions of the position of the waist of a focused laser beam with respect to the sample surface (an epidermal stripping of psoriatic human skin) z (mm); z = 0 corresponds to the case where the beam waist lies on the surface of the sample.835
fluctuations of scattered light in the paraxial region, which should be measured
for two orthogonal linear polarizations (relative to the polarization of the probing beam):343
(1) the mean intensity of speckles,
Isp = I4 + I ; |
(8.12) |
(2)the cross-correlation function (correlation coefficient) for two polarization states,
r II (τ) = [III (t) − III ][I (t + τ) − I ], |
(8.13) |
where the indices ( , ||) denote combinations of polarization states, and averaging is performed over the trajectory of scanning.
Figure 8.23 presents the optical scheme of a spatial speckle correlometer intended for topography or tomography of comparatively thin samples of tissues.
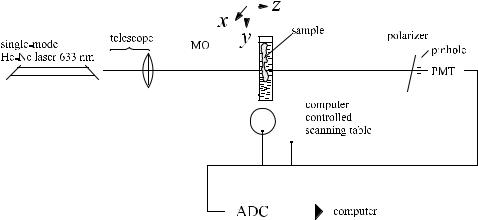
Tissue Optics: Light Scattering Methods and Instruments for Medical Diagnosis |
549 |
||||||||||||||||||||||
|
|
|
|
|
|
|
|
|
|
|
|
|
|
|
|
|
|
|
|
|
|
|
|
|
|
|
|
|
|
|
|
|
|
|
|
|
|
|
|
|
|
|
|
|
|
|
|
|
|
|
|
|
|
|
|
|
|
|
|
|
|
|
|
|
|
|
|
|
|
|
|
|
|
|
|
|
|
|
|
|
|
|
|
|
|
|
|
|
|
|
|
|
|
|
|
|
|
|
|
|
|
|
|
|
|
|
|
|
|
|
|
|
|
|
|
|
|
|
|
|
|
|
|
|
|
|
|
|
|
|
|
|
|
|
|
|
|
|
|
|
|
|
|
|
|
|
|
|
|
|
|
|
|
|
|
|
|
|
|
|
|
|
|
|
|
|
|
|
|
|
|
|
|
|
|
|
|
|
|
|
|
|
|
|
|
|
|
|
|
|
|
|
|
|
|
|
|
|
|
|
|
|
|
|
|
|
|
|
|
|
|
|
|
|
|
|
|
|
|
|
|
|
|
|
|
|
|
|
|
|
|
|
|
|
|
|
|
|
|
|
|
|
|
|
|
|
|
|
|
|
|
|
|
|
|
|
|
|
|
|
|
|
|
|
|
|
|
|
|
|
|
|
|
|
|
|
|
|
|
|
|
|
|
|
|
|
|
|
|
|
|
|
|
|
|
|
|
|
|
|
|
|
|
|
|
|
|
|
|
|
|
|
|
|
|
|
|
|
|
|
|
|
|
|
|
|
|
|
|
|
|
|
|
|
|
|
|
|
|
|
|
|
|
|
|
|
|
|
|
|
|
|
|
|
|
|
|
|
|
|
|
|
|
|
|
|
|
|
|
|
|
|
|
|
|
|
|
|
|
|
|
|
|
Figure 8.23 Optical scheme of a scanning polarization-sensitive spatial speckle correlometer.155 PMT, photomultiplier tube; ADC, amplitude-digital convertor; MO, microobjective.
This device employs a focused laser beam about 5 μm in diameter produced by a single-mode uniphase He:Ne laser. Structure patterns of an object were usually reconstructed through the two-dimensional scanning of the object and an appropriate analysis of the statistical and correlation properties of the scattered light. The scanning step on both axes was 5 μm. A photodetector was placed along the direction of the axis of the incident laser beam (scattering exactly in the forward direction). The diameter of the entrance pinhole was about 25 μm, which is much less than the mean diameter of a speckle. The maximum rate of scanning was about 5 mm/s. The electronic units employed made it possible to obtain at least 20 equidistant counts per single step of scanning. An object was usually placed in the waist of the incident laser beam. The position of an object relative to the beam waist and the orientation of a polarization analyzer mounted in front of the photodetector were adjusted manually.
As was shown above, the estimation of the structure parameters of a tissue, such as the characteristic size of local inhomogeneities and spatial fluctuations of the refractive index, generally requires some assumptions concerning the scattering model. One of the simplest models of scattering is the model
of a random phase screen with Gaussian statistics of inhomogeneities (see Section 4.1).157,822,824,835,1230 In many cases, statistical models for living structures
are much more complicated. In particular, some of these models are nonlinear and may take into account multiple scattering. In spite of the lack of well-developed models for the structure of many tissues, any empirical information concerning statistical properties of scattered light is useful for the analysis of structure images of tissues. Such information may be also useful for the development of structure models themselves.
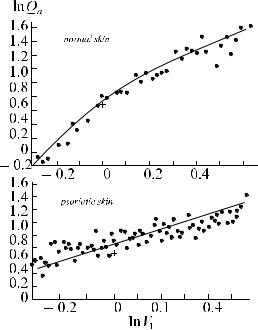
550 |
Coherence-Domain Methods and Instruments for Biomedical Diagnostics and Imaging |
Human skin is one of the most natural objects for the application of optical speckle correlometry.76,834,835,1224,1225 All the structural specific features of skin
surface are manifested in the statistical and correlation properties of the speckle field produced in the far-field diffraction zone when skin samples or skin replicas are probed with a focused laser beam. The technology that permits one to obtain thin slices (strippings) of epidermis with the use of medical glues and quartz (or
glass, or metal) substrates is very convenient for in vitro structure studies of epidermis by means of speckle-correlation optics.834,835 The thickness of the slices in this
case usually ranges from 30 to 50 μm. This technology allows one to obtain from 5 to 7 sequential strippings from the same place. As an example, Fig. 8.21 presents three realizations for the intensity fluctuations obtained by scanning a skin epidermis sample from an area of psoriasis focus of a patient for three different positions of the waist of the laser beam. The thin layers of normal and psoriatic epidermis studied demonstrated that such samples can be described within the framework of a model of single or low-step multiple scattering, because only insignificant depolarization effects were observed in the far-field zone.
The contrast VI and the asymmetry coefficient Qa of intensity fluctuations in the far-field zone as functions of the variation in the defocusing parameter z for normal and psoriatic epidermis display two maxima near the area of exact focusing ( z = 0).835 Figure 8.24 shows such a dependence for a sample of psoriatic epidermis, along with the relevant probability density functions for the intensity
Figure 8.24 Statistical dependencies ln Qa and ln VI for normal and psoriatic skin samples (strippings of human epidermis); + indicates the values of Qa and VI for developed speckles.1231
Tissue Optics: Light Scattering Methods and Instruments for Medical Diagnosis |
551 |
fluctuations. The behavior of the first-order statistical characteristics confirms the validity of the lenslet approach for the description of the scattering properties of epidermis. Normal epidermis (where scatterers have smaller sizes and more uniform distribution) is characterized by a partial overlapping of the maxima mentioned above. The symmetry in the arrangement of VI and Qa peaks with respect to the plane of the beam waist allows us to assume that the statistical weights of the negative and positive lenslets in an ensemble of scatterers are equal to each other.
The differences between the curves VI( z) and Qa ( z) for samples of normal and psoriatic epidermis are due to the changes in the structure of a tissue caused by the disease. These changes are associated with the appearance of parakeratotic foci (the structure of cells near such a focus is substantially disordered) and the saturation of the surrounding tissues with interstitial fluids (which decrease the efficiency of scattering, similar to immersion fluids). Later stages of the disease are characterized by the appearance of microspaces filled with air and the scaling
in the formation of inhomogeneities, which increases scattering and changes its character.835,1231 For a small z, the quantity VI is greater than 1, reaching the
values of 1.6–1.7 for certain samples. As a rule, samples of normal skin display a higher contrast than samples of psoriatic skin. Parametric dependencies for ln Qa and ln VI plotted for various z illustrate the differences in the statistical properties of samples of normal and psoriatic skin (see Fig. 8.24). For normal skin, the first derivative of the function ln Qa = f (ln VI) is greater than that for psoriatic skin. This derivative has a negative slope in the case of normal skin and positive slope for pathological skin. For developed speckle fields with VI = 1 and a negative exponential probability density function of intensity fluctuations [see Eq. (4.9)], we have Qa = 2 (these points are indicated by a plus sign in Fig. 8.24).
Thus, the first-order statistics can be used as a simple and efficient criterion for the recognition of structurally specific features of tissue samples. Investigations
of special skin replicas demonstrated that this technique is also efficient for the semiquantitative determination of the dryness and fatness of skin.1227,1232
Second-order statistical characteristics of intensity fluctuations are also highly sensitive to structural changes in tissues.834 For normal skin, normalized 1D autocorrelation functions of the intensity fluctuations are characterized by comparatively small values of the correlation length, LI 60–80 μm, and the absence of considerable fluctuations of the correlation coefficient on large scales (see Fig. 4.5). As a psoriatic plaque arises, the AFs display a nearly twofold increase in the correlation length, LI 95–180 μm, and the appearance of large-scale aperiodic oscillations with a comparatively large amplitude. The effective sizes of structure inhomogeneities giving rise to such oscillations correlate with the sizes characteristic of an ensemble of parakeratotic foci. Detailed analysis of oscillatory components of the AF should allow one to estimate the surface density of parakeratotic foci and their mean size.
In the range of high spatial frequencies of about 1 μm−1 and higher, the structure function or its exponential factor νI [see Eqs. (4.21) and (8.11)] are preferable for the description of intensity fluctuations. Local estimates of the exponential
552 |
Coherence-Domain Methods and Instruments for Biomedical Diagnostics and Imaging |
factor permit one to determine the contribution of high-frequency structure components of a tissue and to find their spatial distribution in the form of topograms.
Figure 8.25 presents topograms obtained with the use of this technique for samples of normal and psoriatic epidermis.155,1226,1233 The topograms and the correspond-
ing distributions of the exponential factor (see Fig. 8.26) display structure changes related to different stages of pathology development. The values of νI were averaged along the direction of the x-axis with an averaging gate containing no less than 103 counts. The epidermis of normal skin with comparatively small-scale inhomogeneities is characterized by a somewhat smaller mean value and a greater variance of the parameter νI than the early and middle stages of the formation of a psoriatic plaque (see Figs. 8.25 and 8.26). Large-scale structure features, such as fragments of a skin pattern, are clearly seen in the topogram of normal skin. The middle stage of pathology is characterized by a small variance and a relatively large mean value of the parameter considered. In the later stage of the process, the variance grows, the mean value of the parameter νI slightly decreases, and the symmetry of the distribution function lowers. The stages of the formation of a psoriatic plaque, clearly distinguished by means of correlation spectroscopy, are consistent with the results of clinical observations.
Figure 8.25 Topograms of the exponential factor νI obtained for samples of epidermal strippings of human skin: (a) normal skin and (b) psoriatic skin (the middle stage of the disease).155
The control of the optical properties of tissues, in particular the possibility of considerably decreasing the scattering coefficient, may become a key point in optical tomography of tissues in the process of searching for small tumors at early stages of their formation (see Chapter 5). Figure 5.8 presents two recorded fragments that correspond to the early and later stages of tissue clearing. The characteristic changes in speckle structures in the far-field zone were visually observed on a screen located in the plane of a photodetector and were recorded in reflected

Tissue Optics: Light Scattering Methods and Instruments for Medical Diagnosis |
553 |
|||||||||||||||||||||||||||||||||||||||||||||||||||||
|
|
|
|
|
|
|
|
|
|
|
|
|
|
|
|
|
|
|
|
|
|
|
|
|
|
|
|
|
|
|
|
|
|
|
|
|
|
|
|
|
|
|
|
|
|
|
|
|
|
|
|
|
|
|
|
|
|
|
|
|
|
|
|
|
|
|
|
|
|
|
|
|
|
|
|
|
|
|
|
|
|
|
|
|
|
|
|
|
|
|
|
|
|
|
|
|
|
|
|
|
|
|
|
|
|
|
|
|
|
|
|
|
|
|
|
|
|
|
|
|
|
|
|
|
|
|
|
|
|
|
|
|
|
|
|
|
|
|
|
|
|
|
|
|
|
|
|
|
|
|
|
|
|
|
|
|
|
|
|
|
|
|
|
|
|
|
|
|
|
|
|
|
|
|
|
|
|
|
|
|
|
|
|
|
|
|
|
|
|
|
|
|
|
|
|
|
|
|
|
|
|
|
|
|
|
|
|
|
|
|
|
|
|
|
|
|
|
|
|
|
|
|
|
|
|
|
|
|
|
|
|
|
|
|
|
|
|
|
|
|
|
|
|
|
|
|
|
|
|
|
|
|
|
|
|
|
|
|
|
|
|
|
|
|
|
|
|
|
|
|
|
|
|
|
|
|
|
|
|
|
|
|
|
|
|
|
|
|
|
|
|
|
|
|
|
|
|
|
|
|
|
|
|
|
|
|
|
|
|
|
|
|
|
|
|
|
|
|
|
|
|
|
|
|
|
|
|
|
|
|
|
|
|
|
|
|
|
|
|
|
|
|
|
|
|
|
|
|
|
|
|
|
|
|
|
|
|
|
|
|
|
|
|
|
|
|
|
|
|
|
|
|
|
|
|
|
|
|
|
|
|
|
|
|
|
|
|
|
|
|
|
|
|
|
|
|
|
|
|
|
|
|
|
|
|
|
|
|
|
|
|
|
|
|
|
|
|
|
|
|
|
|
|
|
|
|
|
|
|
|
|
|
|
|
|
|
|
|
|
|
|
|
|
|
|
|
|
|
|
|
|
|
|
|
|
|
|
|
|
|
|
|
|
|
|
|
|
|
|
|
|
|
|
|
|
|
|
|
|
|
|
|
|
|
|
|
|
|
|
|
|
|
|
|
|
|
|
|
|
|
|
|
|
|
|
|
|
|
|
|
|
|
|
|
|
|
|
|
|
|
|
|
|
|
|
|
|
|
|
|
|
|
|
|
|
|
|
|
|
|
|
|
|
|
|
|
|
|
|
|
|
|
|
|
|
|
|
|
|
|
|
|
|
|
|
|
|
|
|
|
|
|
|
|
|
|
|
|
|
|
|
|
|
|
|
|
|
|
|
|
|
|
|
|
|
|
|
|
|
|
|
|
|
|
|
|
|
|
|
|
|
|
|
|
|
|
|
|
|
|
|
|
|
|
|
|
|
|
|
|
|
|
|
|
|
|
|
|
|
|
|
|
|
|
|
|
|
|
|
|
|
|
|
|
|
|
|
|
|
|
|
|
|
|
|
|
|
|
|
|
|
|
|
|
|
|
|
|
|
|
|
|
|
|
|
|
|
|
|
|
|
|
|
|
|
|
|
|
|
|
|
|
|
|
|
|
|
|
|
|
|
|
|
|
Figure 8.26 Evolution of the distributions of the exponential factor νI in the progress of psoriasis:155 normal skin [corresponding to Fig. 8.25(a)], early stage of psoriasis, middle stage of psoriasis [corresponding to Fig. 8.25(b)], and late stage of psoriasis.
light by means of a CCD camera.155,172,742 The evolution of typical normalized AFs of intensity fluctuations for sclera in the process of sclera clearing measured with the use of a speckle correlometer (see Fig. 8.23) is shown in Fig. 8.27. Within small time intervals (1–2 min), the time evolution of the shape of the autocorrelation peak, which is associated with the transition of a tissue from one scattering regime to another, can be approximated by an exponential curve; whereas for large
Figure 8.27 Evolution of the normalized autocorrelation function of intensity fluctuations in the speckle field produced by light scattered from a sample of human sclera in the process of scleral enhanced translucence in trazograph-60; the thickness of the sample is 0.6 mm; the measurements were performed with a sample processed in the solution during 120, 220, 420, and 820 s.155
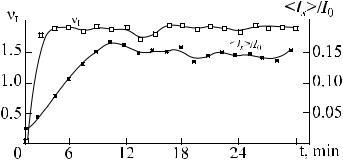
554 |
Coherence-Domain Methods and Instruments for Biomedical Diagnostics and Imaging |
time intervals, this process can be approximately described by a Gaussian curve. The initial stage of the process is characterized by the existence of many scales of intensity fluctuations (the AF displays at least three distinguishable values of its slope). At later stages of clearing, the half-width of the AF peak tends to a value of (0.3–0.4) × 10−3 s, which is close to the ratio of the waist radius of the incident beam to the scanning rate, w/v. This effect can be employed as a criterion of the completion of the transition from multiple scattering to single scattering. The time evolution of the exponential factor νI [see Eq. (8.11) and Fig. 8.28] characterizes the behavior of the high-frequency components of the intensity fluctuations.
Figure 8.28 Typical time dependencies of the exponential factor νI and the normalized mean intensity Is /I0 measured at the observation point for a scleral sample placed in trazograph-60; λ = 633 nm.155
We should note that the exponential factor and the relative fluctuations of the mean intensity of transmitted light have substantially different rates of response to the action of hyperosmotic optical clearing agents (OCAs): νI is especially sensitive to the action of OCAs at the early stages of clearing (within 1.5 min for tra- zograph-60), whereas transmission reaches its maximum only by the tenth minute. This difference in response rates can be accounted for by the fact that the correlation properties of the field, characterized by transition from uniform to nonuniform speckle distributions, substantially change at the initial stages of matching of the refractive indices. By contrast, maximum collimated transmission is achieved only when the refractive indices are completely matched.
Straightforward modeling of the transport of initially collimated photons with a wavelength of 600 nm through a fibrous tissue consisting of collagen fibers with a mean diameter of 100 nm and a refractive index nc = 1.474 surrounded by a ground substance whose refractive index varies within the range n0 = 1.345–1.474 shows that, even with partial matching of refractive indices, n0 = 1.450, nonscattered ( 67%) and singly scattered ( 24%) photons dominate in transmitted light (see Fig. 5.6).798 This prediction agrees well with the measured transmission and
reflection spectra of sclera and the data on correlation measurements (see Section 5.3).798,799
Tissue Optics: Light Scattering Methods and Instruments for Medical Diagnosis |
555 |
Another specific feature of scleral clearing is the appearance of quasi-periodic oscillations of mean-intensity transmission, which are also manifested in the correlation characteristics. These oscillations have small amplitude and can be clearly seen at later stages of translucence, when the main dynamic process associated with the directed diffusion of the substance from the solution into the tissue and of water from the tissue to the solution is close to its completion. The characteristic oscillation time is 1.5–2.0 min. Apparently a process with such a characteristic time can be attributed to the nonuniformity of the diffusion of substances inside a tissue in space and time. This effect may be accounted for by the multistage character of the diffusion process. At the first stage, the diffusion of the OCA into a tissue and the flow of water out of the tissue partially equalize the refractive indices of the hydrated collagen and the intercollagen substance. Under these conditions, the optical transmission of a tissue grows until the dependence under study saturates. However, at the second stage, a relatively weak process of the interaction of the new ground substance with collagen is manifested. The ground substance somewhat lowers its refractive index through the dehydration of the collagen, whereas the refractive index of collagen increases. The resulting mismatch of the refractive indices slightly decreases the optical transmission. At the next stage, a certain violation of the balance between the pressures of water and the OCA in the solution and tissue gives rise to the diffusion of water from the tissue and the OCA into the tissue, which leads to the more exact equalization of the refractive indices, and transmission grows again. Then, the process described above is repeated, and transmission oscillates in the time domain. Such oscillations are observed within the en-
tire period of time when a hyperosmotic agent acts on a tissue up to 40–60 min in this particular experiment.155,172,343 Probably, oscillations of a similar nature with
the time period of 2.5–3.5 min were registered for in vivo hamster skin at topical application of glycerol as an OCA using an OCT system as a detector.1059
As it was shown earlier (see Section 5.7.1), the transition of a scattering object from the regime of multiple scattering to the regime of single scattering should change the polarization properties of scattered radiation, which can be described in terms of the firstand second-order statistical characteristics [see Eqs. (8.12) and (8.13)]. At the early stage of sclera optical clearing, both of the polarization components of transmitted light have approximately equal intensities. However, in the process of clearing, the component polarized along the polarization of the incident beam begins to dominate over the other component (see Fig. 5.10).343 These experimental data demonstrate the reversibility of the optical clearing process, which is important for living systems, and reveal a high sensitivity of the polarization characteristics to structural changes in a tissue.
Note that translucent sclera features large-scale spatial inhomogeneities of scattering and polarization properties in the form of a domain structure, with domain areas on the order of 0.1–1 mm2. Such a structure is associated with a spatially nonuniform distribution of the diffusion rate of substances and is clearly manifested in both time-domain realizations of intensity fluctuations for separate polarization components and the behavior of the cross-correlation function for these

556 |
Coherence-Domain Methods and Instruments for Biomedical Diagnostics and Imaging |
components (see Fig. 8.29) measured with a laser beam scanned over a sample.155 It is obvious that, similar to the correlation characteristics of speckle fields, polarization and cross-correlation characteristics can be employed for the imaging of the structure of tissues, as well as for tissue topography and tomography.
Figure 8.29 Evolution of the cross-correlation coefficient for two orthogonal polarizations of intensity fluctuations in the speckle field produced in the observation plane by a laser beam scanned over a scleral sample processed in trazograph-60 during (1) 200 s and (2) 400 s. The scanning rate was 5 mm/s.155
8.6 Methods of coherent microscopy
Modern methods of microscopy are developing toward in vivo structural investigations of individual cells without fixation of these cells, with simultaneous monitor-
ing of intracellular dynamic processes caused by the vital activity of the cell. The above-mentioned laser Doppler microscope5,24,841,1183 and a high-performance phase microscope with an ultrahigh spatial resolution175,1112,1240–1242 are good ex-
amples of such devices. Another tendency in the development of microscopy is
in vivo layer-by-layer analysis of tissues with a high spatial resolution. Confocal microscopy1,3,28,76,120,122,614,878–898,1243 is a prominent example of this direction in microscopy (see Sections 4 and 5.7.2). Holographic microscopy1244–1247 also
offers much promise for numerous applications.
A phase microscope described in Refs. 175, 1112, and 1242 is a LinnikTolansky interferometer with a computer-controlled piezodriver with a mirror in the reference channel and a dissector (coordinate-sensitive detector) that registers an interference pattern (see Fig. 8.30). In fact, such a microscope is a microprofilometer with a spatial resolution up to 10 nm at a wavelength of 633 nm. The temporal resolution provided by this microscope in the investigation of dynamic processes is on the order of 1 ms. The resolution in height for this device is 0.5 nm,
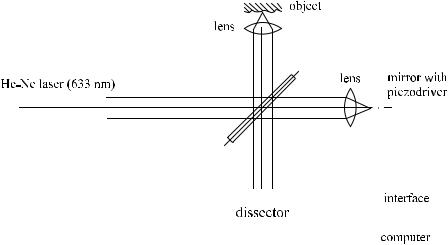
Tissue Optics: Light Scattering Methods and Instruments for Medical Diagnosis |
557 |
||||||||||||||||||
|
|
|
|
|
|
|
|
|
|
|
|
|
|
|
|
|
|
|
|
|
|
|
|
|
|
|
|
|
|
|
|
|
|
|
|
|
|
|
|
|
|
|
|
|
|
|
|
|
|
|
|
|
|
|
|
|
|
|
|
|
|
|
|
|
|
|
|
|
|
|
|
|
|
|
|
|
|
|
|
|
|
|
|
|
|
|
|
|
|
|
|
|
|
|
|
|
|
|
|
|
|
|
|
|
|
|
|
|
|
|
|
|
|
|
|
|
|
|
|
|
|
|
|
|
|
|
|
|
|
|
|
|
|
|
|
|
|
|
|
|
|
|
|
|
|
|
|
|
|
|
|
|
|
|
|
|
|
|
|
|
|
|
|
|
|
|
|
|
|
|
|
|
|
|
|
|
|
|
|
|
|
|
|
|
|
|
|
|
|
|
|
|
|
|
|
|
|
|
|
|
|
|
|
|
|
|
|
|
|
|
|
|
|
|
|
|
|
|
|
|
|
|
|
|
|
|
|
|
|
|
|
|
|
|
|
|
|
|
|
|
|
|
|
|
|
|
|
|
|
|
|
|
|
|
|
|
|
|
|
|
|
|
|
|
|
|
|
|
|
|
|
|
|
|
|
|
|
|
|
Figure 8.30 Diagram of a phase microscope.1240
the imaging area includes from 64 × 64 up to 256 × 256 pixels, the total gain is 105–106, the minimum pixel size is 5 nm, and the time of data processing is 4–20 s. The information concerning the structure of an object is represented in the form of altitude (optical path length) topograms, cross sections, three-dimensional images, etc. When dynamic processes are studied at an arbitrarily chosen point of an object, the results of the investigations are represented in the form of time-domain realizations, Fourier spectra, or histograms. A phase microscope was employed for
structural investigations of living and dried fibroblast cells (L 929) and mitochondria extracted from cells of rat liver in the normal and condensed states.175,1112 The
phase images of L 929 cells obtained in these studies are characterized by the mean optical path length of light on the order of 600 nm for a living cell and about 50 nm for a dried cell. These findings indicate the possibility of the efficient monitoring of this type of cell metabolism. Analogous images of mitochondria demonstrate that the optical length of a normal mitochondrion with respect to the environment is about 15 nm. For the condensed state, the optical length is 3 nm. A microscope of this type was also successfully employed for structural investigations of the wall of fungi cells and erythrocytes with a high spatial resolution, for the study of intracellular motility with a high temporal resolution,1240 and for human carcinoma cells in different physiological states induced by hyperosmotic agents.1242
Confocal laser scanning microscopy, the principles of which are discussed
in Section 4.4, is a well-developed imaging technique for biomedical investiga-
tions.1,3,28,76,120,122,614,878,879,780–782,883–888,890–898 In in vivo morphometry using
real-time confocal microscopy of human epidermis, a spatial resolution better than 1 μm and depth profiling up to 150–250 μm, depending on the anatomical site and skin optical characteristics (color, transparency), were shown.1243 Some of these results on the estimation of the nuclear size and number of keratinocytes for different layers of the living human epidermis are presented in Table 8.1. The resolution

558 |
Coherence-Domain Methods and Instruments for Biomedical Diagnostics and Imaging |
Table 8.1 Estimation of nuclear size and number of keratinocytes in horizontal optical sections of the living epidermis.1243
Epidermal nuclei |
Diameter, μm |
Density, number/mm2 |
Stratum granulosum |
12–15 |
1500 |
Stratum spinosum |
9–12 |
4000 |
Stratum basale |
6–8 |
7000 |
|
|
|
achieved in structural studies of tooth dentine is comparable with the resolution characteristic of scanning electron microscopy, and additional subsurface tissue imaging with a resolution of 1 μm for depths up to 30–50 μm is also provided.882
Three-dimensional imaging of cells in different layers of corneal epithelium made it possible to reveal the character of mitosis in such cells.890,891 Figure 8.31
displays a typical scheme of a confocal microscope where scanning is performed along the z-axis (along the light beam) (see Ref. 1, pp. 555–575). Such a microscope is intended for the layer-by-layer analysis of eye structure. Radiation is delivered to the microscope by means of an optical fiber. The microscope is based on two optically conjugate slits. One of these slits is imaged onto an object, whereas the second slit is placed in front of a photodetector. An objective is scanned along the z-axis by a computer-controlled piezodriver. An immersion liquid provides optical matching between the objective and the eye under study.
Figure 8.31 Diagram of a confocal microscope with optically conjugate slits and scanning along the z-axis.1,879 F1, F2 , and F3, filters; PMT, photomultiplier tube.

Tissue Optics: Light Scattering Methods and Instruments for Medical Diagnosis |
559 |
Figure 8.32 shows a slit-scanning confocal microscope of another type. Such a microscope allows one to obtain images of an object at different depths.883,884, 888–891 This microscope operates in real time and can be employed for in vivo
studies of eye tissues. The main element of the microscope is a two-sided mirror, which implements transverse scanning without shifting the axis of the reflected beam (such a scheme was proposed for the first time by Svishchev in 1969 for the investigation of transparent scattering objects, including living nerve tissues). The lowering of the image quality due to the motion of the patient’s eyes was excluded with the use of an electronic scheme, which ensured the required scanning frequency and phase synchronization between all the elements of the system. As an example, Fig. 8.33 presents an image of endothelium cells of human cornea obtained with the use of the confocal microscope shown in Fig. 8.32.888 Highquality layer-by-layer images of cellular structures of eye tissues and skin in the normal and pathological states as well as the dentin structure of human teeth are presented in Refs. 1, 3, 76, 120, 122, 879–882,893, 898, and 1243.
Figure 8.32 Diagram of a slit-scanning confocal microscope operating in real time.883 M, mirrors; L, lenses; S1 and S2, conjugate slits; and M-M, scanning two-sided mirror.
Depending on the source of light employed, the detecting system, and the type of tissue under investigation, averaging over several expositions (frames) may be necessary to achieve a satisfactory signal-to-noise ratio. For example, for weakly reflecting eye tissues (usually, less than 1%), four to eight frames may be necessary. However, if a highly sensitive video camera in combination with a broadband video
tape recorder is employed as a detector, averaging over frames is not necessary, and real-time in vivo measurements can be carried out.883,884 Although confocal
microscopes can operate with mercury or xenon arc or halogen lamps, monochromatic laser radiation provides images with a higher quality owing to the absence of chromatic aberrations introduced by the optical system. However, the type of laser should be chosen with allowance for the depth of penetration of the laser radiation into a tissue and the transmission of the optical system of the microscope.
Comparative analysis of confocal and heterodyne scanning microscopes and their applications for the investigation of scattering objects have demonstrated that
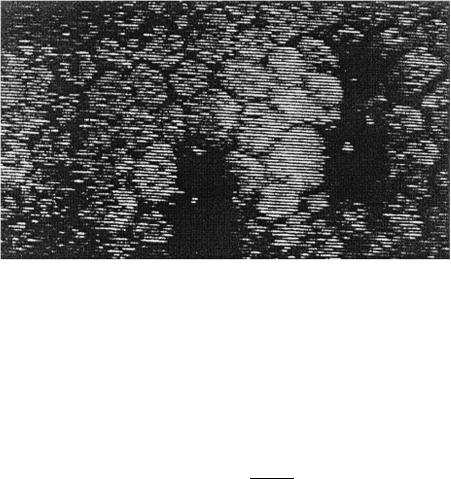
560 |
Coherence-Domain Methods and Instruments for Biomedical Diagnostics and Imaging |
Figure 8.33 Optical map of human cornea in vivo. The image shows endothelial cells on the rear surface of cornea. Optical mapping is performed at a depth of 500 μm with respect to the cornea surface. Dark areas in the image correspond to pathological endothelium.888
in many cases the limitations of the confocal technique are mainly associated with
the small level of the signal rather than with the degradation of an image due to scattered light.894,895 Indeed, a satisfactory resolution in depth (selection of pho-
tons reflected from a definite layer and elimination of the influence of scattered light) can be achieved when a confocal system has conjugate pinholes with a radius (in optical units) of
νp ≤ 2, νp = |
2πrpa1 |
, |
(8.14) |
λf1 |
where rp is the radius of the pinhole and al and fl are the radius and the focal length of a lens that focuses light on the pinhole. Such pinholes do not transmit much light. For example, with νp = 2, a pinhole transmits only 40% of radiation incident on this pinhole within the limits of its aperture. At the same time, the heterodyne (interference) scheme involving a narrowband light source eliminates, to a considerable extent, this restriction due to optical amplification. Eventually, the interference scheme allows one to obtain images of an object with the same signal- to-noise ratio as in confocal microscopy within time intervals shorter than those required in confocal microscopy. Additional advantages of the interference scheme, which stem from the coherence of light and the use of the amplitude response of an object under study, are associated with the appearance of a new mechanism of suppression of scattered light and the possibility of detecting smaller differences in the reflectivities of various tissue layers. It is expected that the integration of the approaches considered above in one microscope and the use of broadband (low-coherence) sources of light (see Chapter 9) may considerably improve the se-

Tissue Optics: Light Scattering Methods and Instruments for Medical Diagnosis |
561 |
lectivity of the system, which is important for the investigation of nearly uniform tissues.894,895
Speckle interferometry using sharply focused laser beams and spatial averaging of optical signals also has advantages in the depth profiling of scattering objects. Using a speckle interferometer (see Fig. 4.7), glue-strippings of human skin attached to metal plates were investigated. Depth profiling of thin tissue layers with a subcellular resolution was obtained (see Fig. 8.34). This method allows one to estimate the thickness of tissue layers and the depth distribution of the refractive index. Appropriate transverse scanning of the object will give tomograms with a spatial resolution of about 3 × 3 × 3 μm. The optical gain of this scheme and the possibility of using powerful lasers may allow one to obtain high values of signal- to-noise ratio.
Figure 8.34 Depth profiling for glue-stripped human skin attached to a metal plate (dependence of the normalized modulation factor of the photoelectric signal β/β0 on the longitudinal displacement of the sample).837
Technical developments in the different fields of optical microscopy are increasingly focusing on the in vivo and in situ imaging of metabolic functions and dysfunctions. The observation of the dynamics of biological processes on a microscale and a nanoscale is required for a more detailed understanding of both cellular physiology and pathology.
8.7 Interferential retinometry and blood sedimentation study
Laser interferential retinometers used for the monitoring of human retinal visual acuity are based on an optical dual-beam interferometer that forms two coherent beams that are focused onto the nodal plane N of the eye and form a spatially
modulated laser beam (SMLB) with parallel interferential fringes on the retina (see Figs. 4.9 and 8.35).5,832,847 The period L of the fringes and their orientation
562 |
Coherence-Domain Methods and Instruments for Biomedical Diagnostics and Imaging |
Figure 8.35 (a) Scheme of a laser interferential retinometer and (b) interference fringes of various spacings and orientations on a retina.832
depend on corresponding parameters of the incident SMLB5 as
L = |
Dλ |
, |
(8.15) |
2l |
where D is the mean distance between the eye nodal plane and retina, λ is the wavelength, and 2l is the separation between two point light sources formed in the nodal plane.
Normal retinal visual acuity is defined as an angular resolving power of the eye and is characterized by the density of interferential fringes per a degree of the view angle5 as
|
λ |
1 |
|
|
Nint = arcsin |
− . |
(8.16) |
||
2l |
For the ideal conditions of the front media of the eyes, the fringe pattern contrast at the retina is very high, practically equal to unity because of the high degree of mutual coherence of the laser beams.
The procedure of estimation of retinal visual acuity is simple. First, a fringe pattern with a large period at the patient’s retina is formed. The patient lets the doctor know that he/she is able to see a fringe pattern. Then, the period of the fringes is decreased and the patient must indicate his/her ability to see the pattern. This procedure is repeated until the patient is unable to see the pattern. To avoid false patient response, fringes can be rotated on an arbitrary angle [see Fig. 8.35(b)].
For patients with cataractous (turbid) lenses, the scattering of a spatially modulated laser beam by a turbid media prevents the creation of the fringe pattern [see Fig. 8.36(c)]. However, averaging of the interferential pattern may improve the

Tissue Optics: Light Scattering Methods and Instruments for Medical Diagnosis |
563 |
visibility of the initial fringes (see Section 4.3) and, therefore, with this technique some limits may be applicable for retinal acuity estimations in eyes with cataract. The optical scheme presented in Fig. 8.36(a), where the SMLB is moving periodically by a deflector but fringes on the retina are unmovable, provides such an averaging. Some other averaging schemes are also available.832
Another example of SMLB application in medicine is the monitoring of the erythrocyte sedimentation rate (ESR). Usually, the test uses the measurement of the distance that erythrocytes have fallen after one hour in a vertical column of anticoagulated blood under the influence of gravity. The test is helpful in the specific diagnosis of several types of cases, including diabetes mellitus and myocardial infarction. The SMLB technique allows one to detect the temporal changes of the scattering properties of a blood suspension at its sedimentation. This method was used to investigate a highly diluted blood, i.e., to monitor the sedimentation of individual and weakly interacting erythrocytes, and was tested in clinical studies.
The experimental setup is presented in Fig. 8.37. A 633-nm He:Ne laser beam was expanded to a diameter of 10 mm; the interferometer created the parallel fringes in the illuminating beam. The piezodeflector was used to make dynamic fringes. The SMLB was positioned in order to incident vertically on a horizontally placed glass vessel with blood samples. The fringe contrast in the course of blood sedimentation was measured. At blood sedimentation, the scattering medium transits from a highly scattering to a low-scattering one due to a high degree of packing
Figure 8.36 Observation of average intensity fringes on a retina: (a) scheme for forming average intensity fringes on a retina; (b) fringes for a clear lens; (c) pattern for a turbid lens;
(d) average intensity fringes.1248
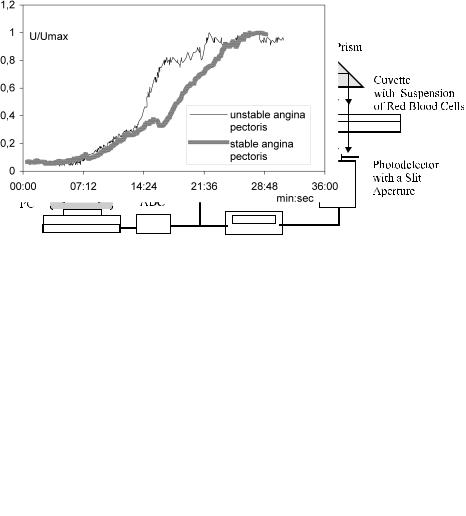
564 |
|
|
Coherence-Domain Methods and Instruments for Biomedical Diagnostics and Imaging |
|||||||||||||||||||||||||
|
|
|
|
|
|
|
|
|
|
|
|
|
|
|
|
|
|
|
|
|
|
|
|
|
|
|
|
|
|
|
|
|
|
|
|
|
|
|
|
|
|
|
|
|
|
|
|
|
|
|
|
|
|
|
|
|
|
|
|
|
|
|
|
|
|
|
|
|
|
|
|
|
|
|
|
|
|
|
|
|
|
|
|
|
|
|
|
|
|
|
|
|
|
|
|
|
|
|
|
|
|
|
|
|
|
|
|
|
|
|
|
|
|
|
|
|
|
|
|
|
|
|
|
|
|
|
|
|
|
|
|
|
|
|
|
|
|
|
|
|
|
|
|
|
|
|
|
|
|
|
|
|
|
|
|
|
|
|
|
|
|
|
|
|
|
|
|
|
|
|
|
|
|
|
|
|
|
|
|
|
|
|
|
|
|
|
|
|
|
|
|
|
|
|
|
|
|
|
|
|
|
|
|
|
|
|
|
|
|
|
|
|
|
|
|
|
|
|
|
|
|
|
|
|
|
|
|
|
|
|
|
|
|
|
|
|
|
|
|
|
|
|
|
|
|
|
|
|
|
|
|
|
|
|
|
|
|
|
|
|
|
|
|
|
|
|
|
|
|
|
|
|
|
|
|
|
|
|
|
|
|
|
|
|
|
|
|
|
|
|
|
|
|
|
|
|
|
|
|
|
|
|
|
|
|
|
|
|
|
|
|
|
|
|
|
|
|
|
|
|
|
|
|
|
|
|
|
|
|
|
|
|
|
|
|
|
|
|
|
|
|
|
|
|
|
|
|
|
|
|
|
|
|
|
|
|
|
|
|
|
|
|
|
|
|
|
|
|
|
|
|
|
|
|
|
|
|
|
|
|
|
|
|
|
|
|
|
|
|
|
|
|
|
|
|
|
|
|
|
|
|
|
|
|
|
|
|
|
|
|
|
|
|
|
|
|
|
|
|
|
|
|
|
|
|
|
|
|
|
|
|
|
|
|
|
|
|
|
|
|
|
|
|
|
|
|
|
|
|
|
|
|
|
|
|
|
|
|
|
|
|
|
|
|
|
|
|
|
|
|
|
|
|
|
|
|
|
|
|
|
|
|
|
|
|
|
|
|
|
|
|
|
Figure 8.37 Laser system with a spatially modulated laser beam for the study of the dynamic scattering properties of a suspension of red blood cells during their spontaneous aggregation and sedimentation.1249
Figure 8.38 Temporal scattering characteristics of erythrocyte suspensions (whole blood diluted by saline as 1:200) at sedimentation process. Blood was taken from the patients with stable and unstable angina pectoris.1249
of the fallen erythrocytes; therefore, the contrast improves (see Fig. 8.38). Owing to the different properties of blood samples taken from patients with different stages of disease, the dynamic characteristics of contrast are different; therefore, contrast may serve as a diagnostic parameter.


Tissue Optics: Light Scattering Methods and Instruments for Medical Diagnosis |
567 |
systems may be very high because the scattering and absorption properties of normal tissue and pathological inclusions may depend on the probing wavelength in different ways. It is very important to provide the acquiring of OCT images at
different wavelengths simultaneously using the same interferometer and focusing system.1250
Figure 9.2 Schematic of a two-wavelength OCT.1250
The schematic of a two-wavelength fiber OCT system is shown in Fig. 9.2.717,1250 Two SLDs with central wavelengths of 0.83 μm and 1.3 μm,
spectral bandwidths of 25 nm and 50 nm (corresponding axial coherence lengths of 13 μm and 19 μm), and power of 1.5 and 0.5 mW, respectively, were used as light sources. The light from both SLDs was coupled to a Michelson interferometer. The incident radiation was split into two equal parts between the sample and reference arms by a fiber coupler with 3 dB of light separation at both wavelengths. The path length difference between the interferometer arms was modulated by a piezoelectric converter (see Fig. 9.1) providing in-depth scanning up to 3 mm. The most challenging problem of simultaneously compensating the wave dispersion for two different wavelengths in the interferometer arms was solved by inserting into one of the arms of the interferometer an additional piece of fiber whose dispersion properties were quite different from those of the principal fiber. The attained indepth spatial resolution for the wavelengths 0.83 and 1.3 μm was 15 and 34 μm, respectively.
9.1.4 Ultrahigh resolution fiber OCT
The typical axial resolution of OCT imaging systems with such universally adopted broadband light sources as SLDs or mode-locked lasers varies from 10–15 μm

568 |
Optical Coherence Tomography and Heterodyning Imaging |
(SLD) to 4–5 μm (short-pulse laser sources such as organic-dye and Ti:sapphire lasers).109,116,127,142 To provide significantly higher axial resolution (e.g., on the
subcellular level), the broadband light sources covering a few hundred nanometers in the visible and NIR ranges are required. Such an ultrahigh-resolution OCT instrument for in vivo imaging is described in Ref. 1251. The optical scheme is presented in Fig. 9.3. A longitudinal resolution on the order of 1 μm was demonstrated for such a system; that is the highest OCT resolution achieved to date. A Kerr-lens mode-locked femtosecond Ti:sapphire laser was used as an illuminating source; it emitted sub-two-cycle pulses corresponding to bandwidths of up to 350 nm, with a center wavelength at 800 nm. Such high performance was achieved with specially designed double-chirped mirrors with a high-reflectivity bandwidth and controlled dispersion response, in combination with low-dispersion calcium fluoride prisms for intracavity dispersion compensation. A pair of fused-silica prisms and razor blades were used to spectrally disperse the laser beam and spectrally shape the laser output. The optical scheme of the low-coherence interferometer was optimized for the ultrabroad bandwidth of the illuminating source. Specially designed lenses with a 10-mm focal length and a numerical aperture of 0.30 in combination with single-mode fibers and special broadband fiber couplers were used. Polarization controllers were also used to exclude the broadening of the shape of the interference envelope due to polarization mismatch. Dispersion was matched by use of variable-thickness fused-silica and BK7 prism in order to reach a uniform groupdelay dispersion. The ultrahigh-resolution OCT system was optimized to support optical spectra of up to 260 nm (FWHM), and a 1.5-μm longitudinal resolution in free space, corresponding to 1-μm resolution in tissue, was achieved.
Figure 9.3 Ultrahigh resolution fiber OCT system with a Kerr-lens mode-locked Ti:sapphire laser:1251 1, KLM Ti:sapphire laser; 2, 5, 16, and 17, specially designed lenses; 3 and 13, special broadband fiber couplers; 4 and 14, polarization controllers; 6 and 7, disper- sion-matching elements; 8, reference mirror; 9, computer-based data processing unit; 10, 11, and 12, dual balanced detector; 15, scanning system.
In vivo subcellular level resolution (1 × 3 μm; longitudinal × transverse) tomograms of an African frog tadpole (Xenopus laevis) were obtained to demonstrate the potential of the ultrahigh-resolution OCT instrument described above. The obtained images clearly depict multiple mesanchymal cells of various sizes
Tissue Optics: Light Scattering Methods and Instruments for Medical Diagnosis |
569 |
and nuclear-to-cytoplasmatic ratios, the olfactory tract and intracellular morphology, as well as mitosis of several cells. It should be noted that high lateral resolution throughout the different depths has also been achieved.
9.1.5 Frequency-domain OCT
Frequency-domain, or Fourier-domain, OCT methods are based on backscattering spectral interferometry and, therefore, are also called spectral OCT.109,116,127,142, 919,934 One of the main advantages of this technique is that it does not require
scanning in the depth of a sample. However, for a long time after the first demonstrations, it did not play a significant role among OCT methods. As it was noted in Ref. 934, this probably happened because sufficiently fast and sensitive CCD
cameras were not available at the time. At present, it is clear that this technique has a great potential in terms of speed and sensitivity.109,116,127,142,934,1252,1253 It
demonstrates sensitivities that are two to three orders of magnitude greater than its time-domain counterpart.1253,1254
One of the first demonstrations of Fourier-domain OCT is described in Ref. 919. Figure 9.4 shows a diagram of the relevant experimental setup based on a Michelson interferometer and a high-resolution spectrometer (a spectral radar device), and the optogram of skin in a human arm measured in vitro. Since the spectral radar measures the amplitude of scattering E(z) along the axis from the surface toward the inside of an object during a single exposition of a detector without longitudinal scanning of the beam, the time span of a tomogram recording may be very small. With allowance for the superposition of the object and ref-
erence fields on the detector, we can write the intensity of light in the following form:919
∞
I (k) = |S(k)|2 E(z) cos(2kz)dz + · · · , (9.1)
0
where k is the wave vector and S(k) is the spectral distribution of the amplitude of the light source. Performing an inverse Fourier transform, we can find the dependence a(z) of the scattering amplitude on the depth. Higher frequencies in the detected signal correspond to larger depths. We can estimate the maximum depth of probing based on the spectral resolution of the spectrograph.
Specifically, for |
2a spectrometer with a resolution of λ = 0.05 nm, we have |
|||||||
zmax |
= |
|
= |
2.4 mm (n |
= |
1.5, λ0 |
= |
853 nm). To ensure a signal- |
|
(1/4n)(λ0/ λ) |
|
|
|||||
to-noise ratio at the level of 104, one should employ a highly sensitive CCD or CMOS camera at the output of the spectrometer.
Fourier-domain OCT can be also realized using a swept-laser source—a rapidly tunable laser over a broad optical bandwidth.1254 In swept-source OCT, instead of CCD or photodiode arrays, a single photodiode in the detection path of the interferometer is employed, which allows the spectral interferometric signal to be encoded with a characteristic heterodyne beat frequency. It was shown that heterodyne de-


Tissue Optics: Light Scattering Methods and Instruments for Medical Diagnosis |
571 |
9.1.6 Doppler OCT
Doppler OCT combines the Doppler principle with OCT to obtain high-resolution tomographic images of static and moving constituents in highly scattering biological tissues.937 When light backscattered from a moving particle interferes with the reference beam, a Doppler frequency shift (fDs ) occurs in the interference fringe,
fDs = |
2Vs n cos θ |
, |
(9.2) |
λ0 |
where Vs is the velocity of a moving particle, n is the refractive index of the medium that is surrounding the particles, θ is the angle between the particle flow and the sampling beam, and λ0 is the vacuum center wavelength of the light source. The longitudinal flow velocity (velocity parallel to the probing beam) can be determined at discrete user-specified locations in a turbid sample by measurement of the Doppler shift. The transverse flow velocity can also be determined from the broad-
ening of the spectral bandwidth due to the finite numeric aperture of the probing beam.937
Scanning of the reference mirror of the OCT system at velocity v produces a Doppler signal at frequency fD , described by Eq. (4.53). Blood or lymph flow with velocity Vs produces another Doppler signal, described by Eq. (9.2). Therefore, the
signal of the Doppler OCT is proportional to |
|
A(t) cos[2π(fD − fDs )t + φ(t)], |
(9.3) |
where A(t) is the reflectivity and φ(t) is the phase shift defined by a scatterer position.
A fiber-optic Doppler OCT (λ0 = 850 nm, λ = 25 nm, P = 1 mW) was employed for measurements of the blood flow velocity in a vessel located behind a strongly scattering layer and in a living object (vessel of rat mesentery).908 This
is a new approach to the investigation of directed blood flow in subsurface vessels under a layer of tissue.908,926–930,937 Electronic data processing allows one to sep-
arate the signal that characterizes the amplitude of backward scattering, which is necessary to generate a stationary tomogram of an object from the Doppler signal, which characterizes the velocity of scatterers at a given point of an object. Figure 9.5 presents a structure image of a fragment of rat mesentery with an artery and two veins, images of the blood flow velocity in the artery and veins, and the velocity profile of the total blood flow.
9.1.7 Polarization-sensitive OCT
The specificity of conventional OCT can be improved by providing measurements of the polarization properties of the probing radiation when it propagates through a tissue. This approach was implemented in the polarizationsensitive OCT technique (PS OCT), which is described in detail in numer-
572 |
Optical Coherence Tomography and Heterodyning Imaging |
Figure 9.5 In vivo images of a fragment of rat mesentery: (a) Structure image (featuring an artery and two veins). (b) Image of the blood flow velocity in the artery. (c) Image of the blood flow velocity in veins. (d) Profile of the blood flow velocity measured at the depth of the artery [indicated with an arrow in Fig. 9.5(a)]. The negative peak on the right-hand side is related to the influence of the blood flow velocity in the vein.908
ous original papers,412–424,913,1256–1258 and a few overview papers and book chapters.127,135,142,717,936 Advanced PS OCT systems provide tissue imaging us-
ing Jones matrix418 or Mueller matrix elements.416

Tissue Optics: Light Scattering Methods and Instruments for Medical Diagnosis |
573 |
In the majority of studies on PS OCT, the criterion of pathological changes in tissue is a measured decrease in tissue macroscopic birefringence. However, there is difficulty in providing correct measurements of birefringence at depths of more
than 300–500 μm. For deeper layers (up to 1.5 mm), a much simpler variant of PS OCT known as cross-polarization OCT (CP OCT) can be employed.717,913 Light
depolarization caused by light scattering and tissue birefringence both lead to the appearance of a cross-polarized component in the backscattered light. Pathological processes are characterized by the changes in the amount of collagen fibers and their spatial organization. Therefore, a comparative analysis of cross-polarization backscattering properties of normal and pathological tissues may be used for early diagnosis of neoplastic processes.
The scheme of an experimental system for measuring conventional OCT and CP OCT images is shown in Fig. 9.6.717,1256 Using a multiplexer (M), a low-
coherence IR radiation from a SLD (λ = 1.3 μm and lc = 21 μm) is combined with radiation from a red diode laser (RL) used for optical system alignment. One of the eigen polarization modes of a polarization maintaining (PM) 3-dB fiber coupler (FC) is selected by means of a polarization controller (CP). The PM fiber is used to transport radiation with a certain polarization state in both the signal and reference arms of the interferometer. When there is no Faraday rotator (F) in the reference arm, a copolarized component of backscattered radiation is recorded (conventional OCT is realized). The Faraday rotator performs a rotation to an arbitrary polarization state by a specified angle, and the direction of the rotation depends only on the direction of the magnetic field inside the rotator and does not depend on the propagation direction of the radiation. Therefore, in the case of the 45-deg Faraday rotator, the radiation passes through it, and being reflected by a mirror goes back through the rotator and becomes orthogonally polarized. As a result, only the cross-polarized component of the light backscattered by a
Figure 9.6 Experimental setup for cross-polarization OCT:717,1256 SLD, superluminescence diode; RL, red diode laser; M, multiplexer; CP, polarization controller; FC, fiber coupler; CS, cross-sectional scanner; O, investigated object; PS, longitudinal piezoscanner; L, lenses; F, Faraday rotator; MR, reference mirror; PD, photodiode; SA, selective amplifier; LA, logarithmic amplifier; AD, amplitude detector; ADC, analog-to-digital converter; PC, personal computer. Bold line corresponds to single-mode fiber; thin line illustrates polarization maintaining fiber.
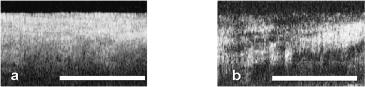
574 |
Optical Coherence Tomography and Heterodyning Imaging |
biological object would interfere with light from the reference arm. The acquisition time of one OCT image is 1 s. For all OCT images, a logarithmic intensity scale was used. The lateral resolution of the system, determined by the diameter of the probing beam in the focus, was chosen close to the axial (in-depth) resolution, which is determined by the coherence length and was 21 μm. Both types of images, conventional and cross-polarized, were obtained from the same tissue site.
Figure 9.7 demonstrates the facilities of the crossed-polarized imaging technique in comparison with a conventional one in the example of the imaging of ex vivo human esophagus scar tissue. It is well seen that in contrast to conventional OCT, the crossed-polarized image provides some additional structural information.
Figure 9.7 (a) Conventional OCT image of ex vivo human esophagus scar tissue. (b) The corresponding cross-polarized OCT image. White bar corresponds to 1 mm.717,1256
9.1.8 Differential phase-sensitive OCT
Differential phase-sensitive OCT (DPS OCT) provides quantitative dispersion data that are important in predicting the propagation of light through tissues, in photorefractive surgery, and in tissue and blood refractive index measurements.142 Refrac-
tive index variations cause phase variations in the sample beam. One of the DPS OCT schemes is presented in Fig. 9.8.1113 The probe beam is split by birefringent
wedges and collimated by the sample lens. Two orthogonally oriented beams separated by x illuminate the sample. The backscattered beams are combined by the birefringent wedges and separated by the polarizing beamsplitter (Wollaston prism) in the detection arm. From the photodetector signals, three interferograms and their corresponding three images are obtained: two intensity images, and a phase difference image. Experiments have shown that measurements of angstrom/nanometer-
scale path length change between the beams [(λ/4π) ϕ] in clear and scattering media can be provided.142,1113 The DPS OCT technique was demonstrated to be
suitable for noninvasive, sensitive, and accurate monitoring of analyte concentrations, including glucose (see Section 5.9.1).1113 Since DPS OCT detects phase contrast in the direction of beam separation, it detects phase gradients caused by transversal variations of the refractive index and/or the phase change on reflection at interfaces.142

Tissue Optics: Light Scattering Methods and Instruments for Medical Diagnosis |
575 |
(a)
(b)
Figure 9.8 Phase-sensitive OCT system.1113 (a) General scheme: WP, Wollaston prism; RSODL, rapid scanning optical delay line; PD, photodetectors; BW, birefringent wedges; ADC, analog-to-digital converter. (b) Sample arm.
9.1.9 Full-field OCT
Conventional time-domain OCT is a single-point detection technique. It can be used to generate two-dimensional OCT images up to video rates; however, such systems have a limited sensitivity or a limited space-bandwidth product (resolved pixels per dimension).142 Full-field or parallel OCT uses linear or two-dimensional detector arrays of, respectively, N and N 2 single detectors. The advantage of parallel OCT is that the SNR when√ using linear or two-dimensional detector arrays can roughly be, respectively, N and N times larger, compared to the single detector signal. The disadvantages of using standard CCD sensors are connected with their time-integrating operation mode; therefore, no ac technique, mixing, or mode-lock detection are possible. To overcome these problems, synchronous illumination in-
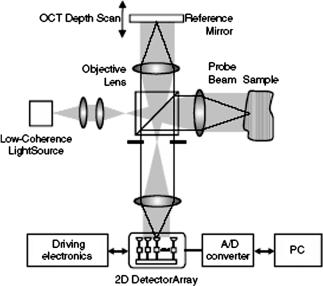
576 |
Optical Coherence Tomography and Heterodyning Imaging |
stead of the usual synchronous detection to obtain lock-in detection on every pixel of a CCD detector array or CMOS detector array can be used.142 In the CMOS camera, each “smart pixel” consisting of photodetector and analog signal processing performs heterodyne detection in parallel, thus dramatically increasing the dynamic range compared to a CCD array. A corresponding two-dimensional “smart pixel detector array” that made it possible to record a data set of 58 × 58 pixels and 33 slices with an acquisition rate of 6 Hz is presented in Fig. 9.9.
Figure 9.9 Parallel OCT setup with a two-dimensional 58 × 58 pixel CMOS detector array where each single detector performs heterodyne detection in parallel (Bourqin et al. 2001).142
To improve depth resolution, a thermal light source can be used.142,1259,1260
A 100-W tungsten halogen thermal lamp in a modified Linnik microscope allowed a depth resolution of 1.2 μm to be obtained.1259 Water immersion has been used
to compensate dispersion; corresponding immersion-objective lenses with a NA of 0.3 provided a transverse resolution of about 1.3 μm. A three-dimensional OCT image of a Xenopus laevis tadpole eye has been synthesized from 300 tomographic images.
Contactless three-dimensional topology of the surface of human skin is necessary for the monitoring of wound and burn healing, observation of side effects of strong medicinal preparations, etc. Figure 9.10 shows a “coherent radar” based on a Michelson interferometer and a low-coherence light source [light-emitting diode (LED)].919 Scanning the reference mirror in this device (with a scanning rate of 4 μm/s), one can obtain three-dimensional images of skin surface with a resolution within the limits of the coherence length of the light source. However, because the “coherent radar” has to scan the depth of the whole object with a limited velocity
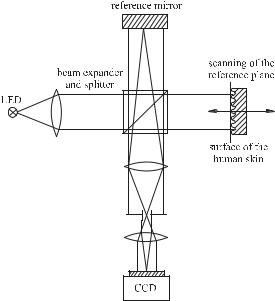
Tissue Optics: Light Scattering Methods and Instruments for Medical Diagnosis |
577 |
(4 μm/s), the measuring time was long (about 150 s) and the field of illumination, in its turn limited by the power of the LED, was 7 × 10 mm. The influence of bulk scattering can be eliminated in this case if the skin is protected with a lightproof coating, e.g., graphite powder.919
Figure 9.10 “Coherent radar” for the investigation of the three-dimensional topology of a skin surface.919 LED, light-emitting diode; scanning of the reference plane is shown with the dashed line.
9.1.10 Optical coherence microscopy
Optical coherence microscopy (OCM) is a new biomedical modality for cross-
sectional subsurface imaging of tissue combining the ultimate sectioning abilities of optical coherence tomography (OCT) and confocal microscopy (CM).775,938
In OCM, spatial sectioning due to the tight focusing of the probing beam and pinhole rejection provided by CM is enhanced by additional longitudinal sectioning provided by OCT coherence gating.
Figure 9.11 illustrates the results of a comparative study of imaging potentialities of CM and full-field OCM.1261 The significantly better quality of the recon-
structed images was obtained in the latter case. The sample arm of the low-coherent interferometer consists of a high-speed scanning CM with a fast scanner (a resonant scanner or a rotating polygonal mirror) and a slow scanner (a galvanometric scanning mirror); the slow scanner was positioned at the image plane of the fast scanner. To exclude the mechanical scanning of the phase delay in the reference arm, a 40-MHz acoustooptic modulator (AOM) in combination with a fixed mirror

578 |
Optical Coherence Tomography and Heterodyning Imaging |
was used for frequency shifting of the reference arm light due to double passage through AOM. In such a way, the reference arm length was fixed to match the optical path length of the sample arm. The setup was modified to CM by blocking the reference arm and detecting the dc centered signals from the sample arm. Both sets of images presented were recorded at eight frames per second with a polygonal mirror as a fast scanner. Each image is a single frame extracted from the video. Since the rotating polygonal mirror causes a path length change in the sample arm of the interferometer during the OCM image reconstruction, an additional frequency shift of the operating frequency of the AOM was introduced during the sample scanning. This shift was equal to 3 MHz from one side of the image to the other side. Thus, by moving the center frequency from 80 to 83 MHz, a full-field OCM image was captured.
Figure 9.11 Optical scheme of a high-speed full-field optical coherence microscope:1261 1, low-coherence light source; 2, fiber-optical interferometer; 3, acoustooptic modulator; 4, detector; 5, resonant scanner; 6, computer-based data processing unit; 7, mirror; 8, 9, 11, and 12, lenses; 10, galvanometer; 13, microscope objective; 14, sample under study; R, reference arm; S, sample arm. By blocking the reference arm, this system can also be used as a confocal scanning microscope.
A compact OCM with a flexible sample arm and a remote optical probe for laboratory and clinical environments was developed.775 To achieve an axial resolution of the cellular level, a light source with an effective bandwidth of 100 nm was used. The light source was comprised of two SLDs based on one-layer quantumdimensional (GaAl)As heterostructures with shifted spectra. Radiations from both SLDs were coupled into a polarization-maintaining (PM) fiber by means of a multiplexer. The multiplexer was spectrally adjusted in order to achieve the minimum width of the autocorrelation function. The dynamic focusing was provided by scanning the output lens of the objective located at the very end of the sample arm. The lens movement was controlled by the electronic system, and aligning of the focal
Tissue Optics: Light Scattering Methods and Instruments for Medical Diagnosis |
579 |
spot with the coherence gating during scanning up to depth of 0.5–0.8 mm into a tissue was provided. The spectral sidelobes, caused by nonuniformity of the light source spectrum, were suppressed.
9.1.11 Endoscopic OCT
Application of fiber-optical light-delivering and light-collecting cables allows one to build a flexible low-coherent imaging system providing the possibility of endoscopic analysis of human tissues and organs. In particular, an OCT system developed for endoscopic applications (high-speed in vivo intra-arterial imaging) is described in Ref. 907. A solid-state Cr+4:Forsterite laser with Kerr lens mode locking was used as an illumination source with a median wavelength of 1280 nm and a bandwidth of 75 nm. Thus, the theoretical axial resolution of the system can be estimated as 10 μm [see Eq. (4.54)]; the actual depth resolution measured with a mirror as a standard technique for resolution evaluation gave an axial pixel size equal to 9.2 μm. The lateral resolution of this system, which depends on the spot size of the lens system used on the output tip of the light delivering fiber, was equal to 30 μm with the confocal parameter equal to 1.74 mm. Electronics allowed one to capture four frames per second for 512 transverse image pixels. The optical power incident on the imaged tissue was approximately 10 mW. The corresponding signal-to-noise ratio was 106 dB. The reference-arm phase-delay scanning device consisted of an oscillating galvanometer mirror, lens, and grating.
Various fiber-optical devices designed for endoscopic OCT imaging have been described.717,1261 One of the examples is a fiber-optical scanning catheter used
for intra-arterial imaging.1261 Such a catheter consists of an optical coupling at its proximal end, a single-mode fiber as the light-delivering channel, and focusing and beam directing elements at the distal end. Beginning at the proximal end of the device, incident light from a fixed single-mode optical fiber is coupled through a narrow air gap into a second single-mode fiber that can rotate. The drive assembly of the catheter, located at the proximal end, uses an optical-fiber connector. A gear is attached to the connector and a shaft assembly, consisting of the connector, the fiber in the catheter, and the distal focusing elements. A dc motor is used to drive the shaft assembly through a gear mechanism. The beam is focused by a graded index lens and is directed by a microprism. The beam was scanned circumferentially by rotating the cable, fiber, and optical assembly inside the nonmovable housing. Power losses caused by suboptimal coupling and internal reflections within the catheter were 3–4 dB. For instance, an in vivo image of rabbit trachea, which was obtained with the described system, allows the differentiation between various tissue structures such as the pseudo-stratified epithelium, mucous, and surrounding hyaline cartilage.1261
A whole family of diagnostic endoscopic OCT devices suitable for studying different internal organs has been created.1262 To probe the surface of an internal organ, a miniaturized electromechanical unit (optical probe) controlling and performing lateral scanning was developed. This probe is located at the distal end of

580 |
Optical Coherence Tomography and Heterodyning Imaging |
the sample arm and its size provides fitting to the diameter and the curvature radius of standard biopsy channels of endoscopes. Figure 9.12(a) demonstrates the head of an endoscope for gastrointestinal investigations with the integrated OCT scanner.717 A schematic diagram of the optical scanning probe and how it is positioned against a studied object is shown in Fig. 9.12(b). The probing beam is swung along the tissue surface with amplitude of 2 mm. The beam deviation system embodies the galvanometric principle, and the voltage with a maximum of 5 V is supplied to the distal end of the endoscope. The distance between the output lens and a sample varies from 5 to 7 mm; the focal spot diameter is 20 μm. The optical scanning probe and the part of the flexible sample arm that is inserted in the endoscope are both sealed; therefore, the conventional cleaning procedure and sterilization can be performed before applying the setup clinically. Implementation of an extended flexible arm of the OCT interferometer became feasible due to the use of polarization-maintaining fibers as a means for transportation of the low-coherence probing light. This allows the elimination of the polarization fading caused by polarization distortions at the sites of bending of the endoscope arm. The device features high-quality fiber polarizers and couplers. The “single-frame” dynamic range of the OCT scheme determined as the maximum variation of the reflected signal power within a single image frame attains 35–40 dB. With a scanning rate of 45 cm/s and the image depth of 3 mm (in free space units), an OCT image with 200 × 200 pixels is acquired in approximately 1 s. This acquisition rate is sufficient to eliminate the influence of moving of internal organs (moving artifact) on the image quality.
Figure 9.12 (a) Distal end of a gastroscope with OCT probe introduced through a biopsy channel.717 (b) Schematic diagram of scanning unit: 1, output lens; 2, output glass window; 3, sample.

Tissue Optics: Light Scattering Methods and Instruments for Medical Diagnosis |
581 |
9.1.12 Speckle OCT
An original technique of coherent tomography that does not require transverse scanning and employs subject speckles is described in Ref. 906. Figure 9.13 shows a diagram of the experimental setup consisting of an SLD, mirror Mach-Zehnder interferometer, and a CCD camera. Radiation produced by the light source is focused onto the surface of an object. An incident light beam irradiates a surface at an angle of 45 deg. The light penetrates into the tissue and experiences scattering. Backscattered light emerges at the surface of the object. A fraction of this beam of light that propagates in the direction perpendicular to the surface of the sample is imaged by the CCD camera, where the beam is mixed with reference-wave radiation reflected from a mirror scanned with a constant rate. Observation of scattered light with an aperture of finite size gives subjective speckles in the image plane (the photosensitive surface of the CCD camera).
Figure 9.13 Coherent optical tomographic scheme based on subjective speckles.906 SLD, superluminescent diode (P = 4 mW, λ = 850 nm, and lc = 30 μm); α is the angle of radiation incidence on the surface of a sample.
In the case when partially coherent light is employed, one should consider different groups of photons passing through the image plane Pi . Each of these groups consists of photons that have traveled a definite path length li ± lc. Correspondingly, these photons produce their own coherent speckle pattern with intensity distribution Si (x, y). The resulting speckle pattern is produced by the incoher-
%
ent superposition Si of different speckle patterns. To locate regions inside an object from which photons with a definite path length L = li come, one should superimpose a reference wave with the corresponding path length L. Then, only the photons from the chosen group Pi will ensure the required contrast VI, which should be measured. Two sequential exposures are required to measure VI. After the first exposition, the phase of the field in the reference beam is shifted by π, and exposure is repeated. The incoherent component remains unchanged in these two exposures and can be easily subtracted. Note that the sizes of subjective speckles
582 |
Optical Coherence Tomography and Heterodyning Imaging |
should be adapted to the sizes of the pixels of the CCD camera. The maximum contrast is achieved when the coherence length lc is as large as possible for a given resolution.
In an image processed in such a way, dark spots or speckle modulation of the surface image will be caused by the partial components of the scattered field that have run the same path length, but along different individual paths. A particular feature of the recorded image is a sharply curved edge of the impulse response, the “photon horizon.” This curve defines the maximum penetration depth in the analyzed scattering system for each reference path length. Thus, different penetration depths can be visualized by a suitable adjustment of the reference path length. Figure 9.14 shows the character of these images obtained with different light sources.
Figure 9.14 Images of the scattering process with different coherence lengths and different kinds of observation:906 (a) Fully coherent illumination, direct observation. (b) Broadband illumination, direct observation. (c) Broadband illumination, extraction of the coherent part; dashed line shows the position of the “photon horizon” (PH).
The path-length resolution for this system is determined by the coherence length lc of the light source used, and for a source with lc = 30 μm, the resulting time resolution is about 100 fs.906 The main advantage of this scheme is that the generation of a two-dimensional (x − z) tomogram does not require transverse scanning of the beam. Being applied for the imaging of macroscopically inhomogeneous scattering phantoms and human skin in vivo, the “photon horizon” detection technique has demonstrated promising results.1263 In the case of human skin, smaller exposure times are required than for a motionless scattering system because
Tissue Optics: Light Scattering Methods and Instruments for Medical Diagnosis |
583 |
of the time integration of speckle-modulated images during the exposure. An exposure time of 40 ms is enough to provide adequate quality of “photon horizon” images of human tissues.
On the basis of the obtained results, it can be concluded that “photon horizon” detection makes it possible to get 2D surface images of strongly scattering media with a resolution better than 10 fs and in-depth range up to 350 μm. This gives the possibility to use such low-coherence imaging technique for the detection of pathological alterations of human skin (e.g., melanoma maligna).
The speckle OCT method was shown recently as an alternative to the Doppler OCT in 2D imaging of blood flow.1186 Flow information can be extracted using speckle fluctuations in conventional amplitude OCT. Time-varying speckle is manifested as a change in OCT image spatial speckle frequencies. It was shown that over a range of velocities, the ratio of high to low OCT image spatial frequencies has a linear relation to flow velocity and that method is sensitive to blood flow of all directions without phase information needed. Using speckle OCT, 2D images of blood flow distributions for in vivo hamster skin were received.1186
9.2 Optical heterodyne imaging
Coherent heterodyne optical detection offers the following advantages over direct
detection methods:1,3,28,894,895,939,1212–1214,1264–1270
•It has the highest sensitivity of any detection technique; the signal-to-noise ratio is several orders of magnitude better than that which can be achieved by incoherent methods.
•The extraordinary dynamic range, about 15 orders or more in magnitude of signal power for Hz-order bandwidths can be realized.
•Excellent selectivity or filtering capability in frequency domain and polarization.
•High spatial resolution, up to 60–80 lines per mm (with confocal optical arrangement).
•Substantial spatial selectivity or filtering capability due to highly directional antenna properties.
•It allows quantification of new tissue parameters by detecting the wavefront degradation within a given tissue.
The quantum limit of optical detection corresponds to the signal-limited shot noise when one employs a conventional photoelectronic detector. The minimal detectable signal power is given by1266
Pmin = hνBd/ηq, |
(9.4) |
where hν is the photon energy, Bd is the detection bandwidth, and ηq is the quantum efficiency of the detector. In the case of the direct detection technique, this
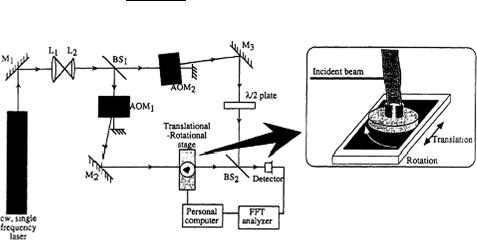

Tissue Optics: Light Scattering Methods and Instruments for Medical Diagnosis |
585 |
||||||
and local oscillator, |
|
|
|
|
|
|
|
|
|
|
|
|
sin[(ω0 + ω2)t], |
(9.7) |
|
|
I2 |
||||||
and can be expressed as |
|
||||||
|
|
|
|
|
|
|
|
|
I1(t, x, y) I2 · sin[(ω1 − ω2)t + φ(t, x, y)], |
(9.8) |
|||||
√ √
where I1(t, x, y) and I2 are the amplitudes of the signal and local oscillator waves; t, x, and y are the temporal and spatial coordinates; and φ(t, x, y) is the spatially and time-dependent phase shift caused by the spatial and temporal fluctuations of refraction of the tissue under investigation.
The signal amplitude is subject to temporal and spatial fluctuations caused by time-dependent and spatially dependent attenuation of light by the tissue. The attenuated intensity of the signal wave by a tissue of thickness d(t, x, y) can be
calculated as [see Eq. (1.1)] |
|
I1(t, x, y) ≈ I10 exp[−μt(t, x, y)d(t, x, y)], |
(9.9) |
where I10 is the intensity of the signal wave incident at the object and μt(t, x, y) is the distribution of the attenuation coefficient.
The typical scheme of a CDI system is shown in Fig. 9.15. The well-collimated optical beam of a CW, single-frequency laser [Ar (514.5 nm), He:Ne (633 nm), Kr (647.1 nm), Ti:Al2O3 (tuned in the range 700–1000 nm) or a diode pumped Nd:YAG (1064 and 1319 nm)] with a power of about a few dozens of milliwatts is split into signal and local oscillator beams. The local oscillator beam and the signal beam are frequency shifted (modulated) by a pair of acoustooptic modulators to 80 and 80.05 MHz, respectively. The signal beam (about 0.8 mm in diameter), after passing through the object (a human finger) is mixed with the local oscillator beam at a silicon photodiode generating a signal at an intermediate frequency (IF) (the beat signal) [see Eq. (9.8)]. The IF signal is then fed to a fast Fourier transform analyzer that is interfaced to a personal computer. The dynamic range of the system, defined as Psat/Pmin, where Psat is the optical power at which the detector is saturated and Pmin is the minimal detected optical power, is about 140 dB. It should be noted that the signal power is proportional to the amplitude of the IF signal over the entire dynamic range of the heterodyne system. Very low optical power on the order of 10−17 W at a wavelength of 800 nm and a detection bandwidth limited to a few hertz could be detected.
Using the described CDI system, two-dimensional (projection) imaging was successfully performed for various in vitro and in vivo biological objects such as
chicken legs and eggs, human tumor specimens, human teeth, animal bones, the head of an infant mouse, and a human finger.1,1266–1268 The spatial resolution of
the system is in the range 0.3 to 0.5 mm, depending on the optical and scanning arrangement. As an example, Figs. 9.15 and 9.16 illustrate the application of a CDI system for the tomographic study of a healthy human volunteer’s finger. The index
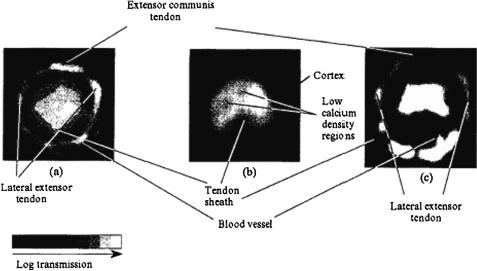
586 |
Optical Coherence Tomography and Heterodyning Imaging |
finger is mounted on a translational-rotational stepping motor stage (as shown in the insert of Fig. 9.15). The base of the finger was lightly bound with a silicon tube to reduce blood flow to the finger surface. This procedure was essential, especially when imaging at 715 nm, to minimize the influence of the Doppler effect on the IF signal caused by surface blood flow. The image displayed in Fig. 9.16(a) was reconstructed using 30 projections. Data for each projection consist of the averaged (32 times) amplitude of the IF signal for every 0.5-mm step of the translational scan across the finger joint. Averaging of the IF signal was necessary to minimize the speckle effect. After each translational scan, the finger was rotated by 6 deg and the translational scan was repeated. The finger was rotated by 180 deg for each data set. The data processing was carried out by the filtered back-projection method used in x-ray computed tomography (CT) image reconstruction.
Figure 9.16 Computed tomographic images at the joint region corresponding to the head of the proximal phalanx of a healthy human index finger:1267 (a) Laser CT image obtained with a Nd:YAG laser operating at 1064 nm. (b) Hard x-ray CT image. (c) MRI (T1-weighted) image.
In Fig. 5.16, the CDI laser tomographic image of the finger (at the joint region corresponding to the head of the proximal phalanx) obtained at 1064 nm, as well as reference images obtained by conventional methods such as hard x-ray CT and magnetic resonance imaging (MRI), are shown. The diameter of the finger at the measurement plane was 14 mm and the incident power was 25 mW. Data for each image were collected during 25 min. The slice thickness of the x-ray and MRI images was 5 and 3 mm, respectively; whereas for the CDI images it was estimated as 0.5 mm. The use of a 2D heterodyne detector array would have helped through increased transverse resolution and reduced measurement time.1267


588 |
Optical Coherence Tomography and Heterodyning Imaging |
and noise voltages with the input beam on and off. In this way, the real-time measurements of the mean square beat amplitude, |VB |2, were provided. Information about the Wigner phase space distribution of the transmitted light was obtained by measuring the beat intensity as a function of the shift in the LO center position (by translating mirror M1) and transverse momentum (angle) (by translating lens L1). The detector was in the Fourier plane of lenses L1 and L2, so that the LO position was fixed in the detection plane. The spatial resolution of the system was determined by the spatial width and diffraction angle of the LO.
The model experiments, which were performed by the authors of Ref. 939, pro-
vided a better understanding of the tomographic studies done by Inaba and coworkers for living tissues,1266–1268 in particular, by linking the amplitude of the IF signal
with tissue density and its coefficient of absorption. The beat intensity for propagation of a Gaussian beam through an Intralipid solution at fixed positions of the mirror M1 and the lens L1 corresponding to the maximal signal as a function of Intralipid solution concentration is shown in Fig. 9.18. The data clearly exhibit an initial rapid exponential decline with concentration, followed by a slower nonexponential decline. The spatial measurements showed that the fast decline corresponds to the transmission of the Gaussian beam, while the slower decline arises from a multiple scattering contribution. Using the concept of the Wigner phase space distributions, it was shown for a Gaussian input beam with a diffraction angle of about 1 mrad that at low Intralipid concentrations the amplitude of the beat signal decays exponentially due to absorption and scattering as
exp[−(σsca + σabs)ρsd], |
(9.10) |
Figure 9.18 Beat intensity versus Intralipid concentration (C ρs) in percent of 10% Intralipid solution in pure water, for 0.5-μm average particle size and a sample length of 1 cm.1270
Tissue Optics: Light Scattering Methods and Instruments for Medical Diagnosis |
589 |
where σsca and σabs are the scattering and absorption cross sections, respectively, ρs is the particle concentration, and d is the sample thickness. At an intermediate Intralipid concentration, when a transmitted beam broadens due to multiple scattering, the beat intensity must drop as
ρs−2 exp(−σabsρsd). |
(9.11) |
At high concentrations, the scattering light distribution becomes isotropic and the beat intensity decay is defined mainly by the absorption as
exp(−σabsρsd). |
(9.12) |
One expects that this simple picture will break down at a sufficiently high concentration, when the diffusion photon path is substantially larger than the thickness of the sample.
9.3 Summary
Thus, a brief review of the optical schemes of coherence tomographs and topographs demonstrates the possibilities of these instruments for the investigation of tissues. Despite the continuing development of OCT and the search for advanced tomographic schemes, the area of medical applications of OCT in its present form is continually growing. Currently, this area includes analysis of damaged skin zones of patients suffering from psoriasis, erythematosus lupus, scleroderma, and malignant melanoma; investigation of postburn keloid cicatrices and vascularization of subepidermal skin layers; monitoring of laser ablation of tissues; imaging of brain tissues and fundus of the eye; imaging of hard and soft
tissue of the oral cavity; investigation of the mucous membrane of inner organs,
etc.1,3,8,13,17,18,28,45,76,77,84,102,108–111,116,126,127,129,135,136,138,139,141,142,343,717,775,
865,901,902,909,931–939,1246,1247

596 |
Glossary 1. Physics, Statistics, and Engineering |
acceptance angle: the maximum incident angle at which an optical fiber will transmit light by total internal reflection.
acoustic detector: a transducer that transforms an acoustic signal to an electrical one, such as a microphone or piezoelectric transducer; wideband piezoelectric transducers, being low-noise detectors, have proven to be most suitable for tissue spectroscopy and tomography.
acoustic (sound) waves: waves produced by a vibrating system that indexes the particles of the medium that vibrate in the same direction as the progress of the wave; successive points of high (compressions) and low (rarefactions) pressures are formed because of the regular impulses from the vibrating source; sound waves may be longitudinal progressive, longitudinal stationary, or transverse stationary; when sound is propagated through a medium (gas, liquid, or solid) it is transmitted by progressive longitudinal waves in that medium; sound waves interact with a complex and/or moving medium with their damping, refraction, diffraction, interference, and/or Doppler shift in frequency.
acoustooptical (AO) interaction (effect): the interaction of ultrasound and light beams within a homogeneous or inhomogeneous medium that occurs through a change in optical properties of the medium resulting from its compression by the ultrasound.
acoustooptical modulator: a device for intensity modulation of light at certain audio or radio frequencies using the acousto-optical effect.
acoustooptical tomography (AOT): optical tomography that is based on the acoustic [ultrasound (US)] modulation of coherent laser light traveling in tissue; an acoustic wave (AW) is focused into tissue and laser light is irradiating the same volume within the tissue; any light that is encoded by the ultrasound contributes to the imaging signal; axial resolution along the acoustic axis can be achieved with US-frequency sweeping and subsequent application of the Fourier transformation, whereas lateral resolution can be obtained by focusing the AW.
acquisition rate: the rate of acquiring experimental data.
acquisition time: the period of time of acquiring experimental data.
adaptive finite element method: a finite element method, where discretion of the underlying spatial domain (usually in two or three space dimensions) and establishment of discrete equations is done using an adaptive mesh refinement approach accounting for the complex structure of the object.
adding-doubling method: see inverse adding-doubling (IAD) method.
adiabatic expansion: a curve of pressure against volume, representing an adiabatic change (curves of equal entropy); these lines always slope more steeply than the isothermals they cross.
Tissue Optics: Light Scattering Methods and Instruments for Medical Diagnosis |
597 |
albedo: the ratio of scattering to the extinction cross section (or coefficient); ranges from zero for a completely absorbing medium to unity for a completely scattering medium.
algorithm: a procedure (a finite set of well-defined instructions) for accomplishing some task which, given an initial state, will terminate in a defined end-state; the computational complexity and efficient implementation of the algorithm are important in computing, and this depends on suitable data structures.
amplifier: an electronic (or optical) circuit that increases the voltage (or light power) of a signal fed into it by obtaining power from an external supply.
amplitude scattering matrix (S-matrix or Jones matrix): consists of four elements (the complex numbers) and provides a linear relationship between the incident and scattered field components; each element depends on scattering and azimuthal angles, and optical and geometrical parameters of the scatterer; both field amplitude and phase must be measured to quantify the amplitude scattering matrix.
analyzer: a polarizer that is placed in front of the detector.
anhydrous: having no water (for crystal, no water of crystallization).
angstrom (Å): a unit of length equal to 10−8 meter (m).
anisotropic crystal: a crystal for which some physical properties (mechanical, optical, magnetic, electrical, and etc.) are dependent on direction (not density and specific heat capacity); for example, for light propagation in transparent crystals (excluding crystals with cubic lattice) the light undertakes birefringence with mutually orthogonal polarization of rays propagating in different directions; for crystals with hexagonal, trigonal, and tetragonal structures (quartz, ruby, and calcite) birefringence is maximal along the direction that is perpendicular to the main axis of symmetry and is absent along this axis.
anisotropic scattering: a scattering process characterized by a clearly apparent direction of photons that may be due to the presence of large scatterers.
anode: a positive electrode that attracts anions (negative ions) during electrolysis.
antenna properties of the optical heterodyne system: the narrow field of view that provides a high spatial resolution for detection and ranging of the medium under study and its image formation.
anti-Stokes-Raman scattering: a photon interacts with a molecule in a higher vibrational level; the energy of the Raman scattered photons is higher than the energy of the incident photons.
aperture: the diameter of a circle through which light is allowed to pass; apertures may be varied and stated as fractions of the focal length, e.g., f/6 means that the diameter of the lens (aperture) is 1/6 of the focal length f .
598 |
Glossary 1. Physics, Statistics, and Engineering |
Ar (argon) laser: a laser with a lasing medium composed of ionized argon gas; the emission is mostly in the UV and visible ranges: (336.6–363.8) nm, 454.5 nm, 457.9 nm, 488 nm, 514 nm, and 528.7 nm.
arc lamp: a lamp that uses a luminous bridge formed in a gap between two conductors or terminals when they are separated.
artifact: (in microscopy) a structure that is seen in a tissue sample under a microscope but not in living tissue; may be caused by incorrect sample preparation or placement of the sample under the microscope.
A-scan: in-depth scanning perpendicular to the sample surface.
asymmetry parameter (skewness): a measure of asymmetry in a probability distribution function.
attenuated total reflectance Fourier transform infrared spectroscopy (ATR FTIR) method: based on a combination of the total internal reflection technique and Fourier transform infrared spectroscopy.
attenuation: a decrease in energy per unit area of a wave or beam of light: it occurs as the distance from the source increases and is caused by absorption or scattering.
attenuation (extinction) coefficient: the reciprocal of the distance over which light of intensity I is attenuated to I /e ≈ 0.37I ; the units are typically cm−1.
autocorrelation: the correlation of an ordered series of observations with the same series in an altered order.
autocorrelation function: the characteristic of the second-order statistics of a random process that shows how fast the random value changes from point to point, e.g., the autocorrelation function of intensity fluctuations caused by scattering of a laser beam by a rough surface characterizes the size and the distribution of speckle sizes in the induced speckle pattern; the Fourier transform of the autocorrelation function represents the power spectrum of a random process.
autofluorescence: natural fluorescence of a tissue.
avalanche photodetector (APD): a type of silicon or germanium photodiode that uses a phenomenon of the electrical breakdown of a p-n junction, which induces collision ionization and the avalanche creation of electron-hole pairs; it increases the photocurrent up to 102 to l06.
back-projection algorithm: an approximate inverse solution to provide efficient tomographic imaging; in x-ray computed tomography the back-projection is reconstructed along the paths of x-ray propagation; in optical tomography the backprojection is reconstructed along the paths of ballistic and/or least scattering photon propagation; in optoacoustical tomography the back-projection is reconstructed along spherical shells that are centered at the detector and have a radius determined by the acoustic time of flight.
Tissue Optics: Light Scattering Methods and Instruments for Medical Diagnosis |
599 |
backscattering: the dispersion of a fraction of the incident radiation in a backward direction.
backscattering coefficient (volume-averaged): the sum of the particle cross sections weighted by their angular-scattering functions evaluated at 180 deg.
backscattering Mueller matrix: a Mueller matrix measured for light backscattered by a sample.
ballistic (coherent) photons: a group of unscattered and strictly straightforward scattered photons.
beam: a slender stream of light.
beat signal: the signal at the intermediate frequency produced by mixing the local and signal oscillator beams on a photodetector.
bend (bending): related to infrared spectroscopy that works because chemical bonds have specific frequencies at which they vibrate, corresponding to energy levels; simple diatomic molecules have only one bond, which may stretch; more complex molecules may have many bonds and vibrations can be conjugated, leading to infrared absorptions at characteristic frequencies that may be related to chemical groups; e.g., the nonlinear triatomic molecule in an H2O atom can vibrate in three different ways: symmetrical and asymmetrical stretching and bending (scissoring); the atoms in a CH2 group, commonly found in organic compounds, can vibrate in six different ways: symmetrical and asymmetrical stretching, bending (scissoring), rocking, wagging, and twisting.
biaxial crystal: an anisotropic crystal that is characterized by having two optic axes, i.e., two axes along which an incoming beam will remain collinear, and the light of both polarizations will propagate at the same speed; mica is an example.
bimodal distribution: a distribution that has two modes.
bioheat equation: describes the change in tissue temperature at a definite point in the tissue; it is defined by the thermal conductivity of tissue, the rate of metabolic heat generation, and the heat transfer caused by blood perfusion at this point.
birefringence: the phenomenon exhibited by certain crystals in which an incident ray of light is split into two rays, called an ordinary ray and an extraordinary ray, which are plane- (linear) polarized in mutually orthogonal planes.
BK7: bor-crown optical glass that is relatively hard and shows a good scratch resistance; very commonly used for manufacturing of high-quality optical components; it has the high linear optical transmission in the visible range down to 350 nm with a refractive index of nd = 1.51680 (587.6 nm).
blocking filter: a filter that blocks the passage of a certain frequency (wavelength) band.
600 |
Glossary 1. Physics, Statistics, and Engineering |
Boltzmann constant: the ratio of the universal gas constant to Avogadro’s number, equal to 1.3803 × 10⁻¹⁶ erg per degree Celsius.
Born’s approximation: the single-scattering approximation when the field affecting the particle does not essentially differ from that of the initial wave.
Bouguer-Beer-Lambert law: a exponential law describing attenuation of a collimated beam by a thin absorption layer with scattering.
boundary conditions: a stated restriction, usually in the form of an equation, that limits the possible solutions to a differential equation.
brightness: an attribute of visual perception in which a source appears to emit a given amount of light; in other words, brightness is the perception elicited by the luminance of a visual target; this is a subjective attribute/property of an object being observed.
Brownian motion: the irregular motion of particles suspended in a medium caused by the molecules of the medium bombarding these particles.
Brownian particles: small particles suspended in a liquid or a gas that undergo irregular motion caused by molecules of the medium bombarding the particles.
calcium fluoride (CaF2): an insoluble ionic compound of calcium and fluorine; it occurs naturally as the mineral fluorite (also called fluorspar).
carbon nanoparticle: particles made of carbon with dimensions on the order of billionths of a meter; they have different physical, chemical, electrical, and optical properties than occur in bulk samples due in part to the increased surface-area-to- volume ratio at the nanoscale; carbon black is a form of amorphous carbon that has an extremely high surface-area-to-volume ratio and, as such, is one of the first nanomaterials to find common use; little is known about the interaction of carbon nanoparticles with human cells.
cathode: a negative electrode that attracts cations (positive ions) during electrolysis.
cavity-dumped mode-locked laser: a laser that produces high-energy ultrashort laser pulses by decreasing the pulse repetition rate (see mode-locked laser); the laser output mirror is replaced by an optical selector consisting of a couple of spherical mirrors and an acoustoor electrooptical deflector, which extracts a pulse from the cavity after it has passed over a few dozen cavity lengths; the pulse energy is accumulated between two sequential extractions: the pulse repetition rate can be tuned in the range from dozens of hertz to a few megahertz.
charge-coupled device (CCD): a solid-state electronic device that serves as an imaging chip and is used in video cameras and fast spectrometers.
Celsius temperature scale: a temperature scale for which the freezing point is at 0◦ and the steam point is at 100◦.
Tissue Optics: Light Scattering Methods and Instruments for Medical Diagnosis |
601 |
characteristic diffusion time: the reciprocal of an agent’s diffusion coefficient diffused in a tissue; characterized by the time interval during which the applied agent concentration increases in the sample of ≈ 0.6 in the surrounding medium.
CH group: related to infrared spectroscopy, chemical bonds vibrate at the specific frequencies that correspond to energy levels; simple diatomic molecules have only one bond that may stretch; a CH group provides a stretching vibration mode.
chirality: the mirror-equal “right” or “left” modification of an object optical activity is one example of chirality, when the asymmetric structure of a molecule or crystal existing of two forms (“right” and “left”) causes the substance (ensemble of these molecules or crystal) to rotate the plane of polarization of the incident linear polarized light: the pure “right” or “left” optically active substances have identical physical and chemical properties, but their biochemical and physiological properties can be quite different.
chromatic aberrations: the variation of either the focal length or the magnification of a lens system, with different wavelengths of light, characterized by prismatic coloring at the edges of the optical image and color distortion within it.
chromaticity coordinates: in the study of the perception of color, one of the first mathematically defined color spaces was the CIE XYZ color space (also known as CIE 1931 color space), created by the International Commission on Illumination (Commission Internationale de l’Éclairage—CIE) in 1931; the human eye has receptors for short (S), middle (M), and long (L) wavelengths, also known as blue, green, and red receptors; that means that one, in principle, needs three parameters to describe a color sensation; a specific method for associating three numbers (or tristimulus values) with each color is called a color space: the CIE XYZ color space is one of many such spaces; however, the CIE XYZ color space is special, because it is based on direct measurements of the human eye and serves as the basis from which many other color spaces are defined; the CIE1964 standard observer is based on the mean 10-deg color matching functions.
chromophore: a chemical that absorbs light with a characteristic spectral pattern.
clock frequency: in electronics and especially synchronous digital circuits, a clock signal is used to coordinate the actions of two or more circuits; for example, the clock rate (frequency) of a computer CPU is normally determined by the frequency of an oscillator crystal.
CMOS image sensors: an image sensor based on complementary metal-oxide- semiconductor (CMOS) camera that operates at lower voltages than a CCD camera, reducing power consumption for portable applications; analog and digital processing functions can be integrated readily onto the CMOS chip, reducing system package size and overall cost; each CMOS active pixel sensor cell has its own buffer amplifier and can be addressed and read individually—a commonly used cell has four transistors and a photoelement; all pixels on a column connect to a common amplifier.
602 |
Glossary 1. Physics, Statistics, and Engineering |
carbon monoxide (CO) laser: a laser in which the lasing medium is CO gas with an IR emission from 5 to 6.5 μm.
carbon dioxide (CO2) laser: a laser in which the lasing medium is CO2 gas with an IR emission from 9.2 to 11.1 μm with the maximal efficiency at 10.6 μm.
coherence length: characterizes the degree of temporal coherence of a light source; lc = cτc, where c is the light speed and τc is the coherence time, which is approximately equal to the pulse duration of the pulsed light source or inversely proportional to the frequency bandwidth of a continuous-wave light source.
coherent detection imaging (CDI): a method based on the optical heterodyne detection technique: it is a coherence gating method that discriminates the forward multiply-scattering beam, preserving the direct geometrical correlation with the incident light beam against the diffuse component of transmitted light.
coherent light: light in which the electromagnetic waves maintain a fixed phase relationship over a period of time and in which the phase relationship remains constant for various points that are perpendicular to the direction of propagation.
collapse: catastrophic compression.
collimated beam: a beam of light in which all rays are parallel to each other.
collisional quenching rate: nonradiative relaxation of the excited molecular energy state (level) by collisions with surrounding molecules; in a condensed medium, the rate of collisional relaxation is significantly higher than the radiative one.
complex conjugation: the number corresponding to a given complex number that represents the given number’s reflection with respect to the real axis.
confocal microscopy: microscopy that employs the confocal principle [two optically conjugate diaphragms (pinholes) or small-sized slits in the object and image planes] for the selection of scattered photons coming from a given volume; provides 3D imaging of living tissues.
contrast: is a distinction between two objects (or parts of an object) or colors; a large contrast is a big difference, and contrasting objects are boldly different; can refer to contrast (visibility) of regular interference or speckle patterns or the difference in color and light intensity between parts of an image (see imaging contrast).
contrast of the intensity fluctuations: the relative difference between light and dark areas of a speckle pattern.
contrasting agents: compounds used to increase the quality of x-ray, MRI, or optical tomography images.
Tissue Optics: Light Scattering Methods and Instruments for Medical Diagnosis |
603 |
constructive interference: the interference of two or more waves of equal frequency and phase, resulting in their mutual reinforcement and producing a single amplitude equal to the sum of the amplitudes of the individual waves.
cooled CCD: a highly sensitive CCD with the thermal noise suppressed by cooling the photosensitive chip.
correlation: the degree of co-relation between two or more attributes or measurements on the same group of elements; in probability theory and statistics, correlation indicates the strength and direction of a linear relationship between two random variables; in general statistical usage, correlation refers to the departure of two variables from independence, although correlation does not imply causation.
correlation coefficient: a number of different coefficients are used to characterize correlation between two random variables for different situations; the most well known is the Pearson product-moment correlation coefficient, which is obtained by dividing the covariance of the two variables by the product of their standard deviations.
correlation diffusion equation: describes the transport of temporal field correlation function in a system that multiply scatters laser radiation; may be valid for turbid samples with the dynamics of scattering particles governed by Brownian motion, and random and shear flow.
correlation length: the length within which the degree of correlation between two measurements of a spatially dependent quantity is high (close to unity); for example, Lc is the correlation length of the scattering surface of the spatial inhomogeneities (random relief).
coupler: an optical or acoustical device that interconnects optical or acoustical components with less loss of energy.
coupling gel: a gel that provides matching optical or acoustical properties from different elements of a device that minimizes the amplitude of light or acoustic reflecting signals (or both) from boundaries of the elements.
cross-correlation frequency (cross-correlation signal): a difference in the frequency of intensity modulated light at a certain wavelength and photodetector gain modulation; it carries the same phase and amplitude information as the original optical signal.
cross-correlation measurement device: a system that down converts a radio frequency prior to phase measurements.
crosstalk: the interrelations between measured signals induced by originally independent parameters (for example, by changes in blood volume and oxygenation); this factor is determined by calibration on a model (for example, a blood model).
604 |
Glossary 1. Physics, Statistics, and Engineering |
continuous wave (CW): waves that are not intermittent or broken up into damped wave trains but, unless intentionally interrupted, follow one another without any interval of time between them.
CW laser: a laser producing CW waves.
CW RTT: the stationary radiation transfer theory that describes the intensity distribution of CW light in a scattering medium; it is based on the stationary integrodifferential equation for the radiance- (or specific intensity) average power flux density at a point r in a given direction s (see radiation transfer theory).
dark-field illumination: used in dark-field microscopy for imaging of optically transparent nonabsorbing specimens, where illuminating light does not enter into ocular lenses and only light scattered by microparticles of the specimen creates the image; in the field of view of the microscope on the dark background, bright images of the specimen particles differing by their refractive index from the surrounding medium are seen.
decibel (dB): the engineering unit for the ratio of the input power, Pin, in a given device to the output power, Pout; it is convenient to measure the logarithm of the ratio log(Pout/Pin), and the dB is a standard unit that is equal to 10 times that log: 10 log(Pout/Pin) dB.
decorrelation of speckles: relates to statistics of the second order that characterize the size and distribution of speckle sizes and show how fast the intensity changes from point to point in the speckle pattern; decorrelation means that such changes of intensity tend to be faster.
deep RPS: a random-phase screen that induces phase fluctuations in a scattered field with a variance that is much more than unity.
deflectometry: a photorefractive technique based on the detection of refractive index gradients above and inside the sample using a laser probe beam.
deformation: in biomechanics, deformation is a change in shape due to an applied force; this can be a result of tensile (pulling) forces, compressive (pushing) forces, shear, bending, or torsion (twisting); deformation is often described in terms of strain.
0-degree hybrid (or splitter): a device that pertains to or denotes a current in one of two parallel circuits that have a single-phase current source and equal impedances and that produces currents of 0-degree phase shift.
90-degree hybrid (or splitter): a device that pertains to or denotes a current in one of two parallel circuits that have a single-phase current source but unequal impedances and that produces currents of 90-degree phase shift.
degree of polarization: the quantity that characterizes the ratio of the intensity of polarized light to the total intensity of light.
Tissue Optics: Light Scattering Methods and Instruments for Medical Diagnosis |
605 |
delta (δ)-Eddington approximation: a simple yet accurate method that was proposed for determining monochromatic radiative fluxes in an absorbing-scattering atmosphere; in this method, the governing phase function is approximated by a Dirac-delta function forward-scatter peak and a two-term expansion of the phase function; the fraction of scattering into the truncated forward peak is taken proportional to the square of the phase-function-asymmetry factor, which distinguishes the delta-Eddington approximation from others of a similar nature (http://adsabs.harvard.edu/abs/1976JAtS...33.2452J); one of the approximations of the actual phase function for tissue; in the diffusion approximation of RTT, it is the best function for simulating light transport in tissues characterized by anisotropic scattering.
demodulation: the separation and extraction of modulating low-frequency waves from a modulated carrier wave (high frequency or optical); the device or circuit used for demodulation is called a detector or demodulator.
depth of modulation: for amplitude modulation, this is the ratio of the amplitude of the alternating component of a signal to its mean value.
depolarization: deprivation (destruction) of light polarization.
depolarization length: the length of light beam transport in a scattering-depolar- izing medium at which the polarization degree decays to the definite level compared with the totally polarized incident light.
destructive interference: the interference of two waves of equal frequency and opposite phase, resulting in their cancellation where the negative displacement of one always coincides with the positive displacement of the other.
developed speckles: the speckles that are characterized by Gaussian statistics of the complex amplitude, the unity contrast of intensity fluctuations, and a negative exponential function of the intensity probability distribution (the most probable intensity value in the corresponding speckle pattern is equal to zero, i.e., destructive interference occurs with the highest probability).
dichroism (diattenuation): a phenomenon related to pleochroism of a uniaxial crystal so that it exhibits two different colors when viewed from two different directions under transmitted light; pleochroism is the property possessed by certain crystals that exhibit different colors when viewed from different directions under transmitted light: this is one exhibition of the optical anisotropy caused by the anisotropy of absorption; the varieties of pleochroism are circular dichroism, different absorption for light with right and left circular polarization, and linear dichroism, different absorption for ordinary and extraordinary rays.
diffraction: a phenomenon associated with a wave motion when a wave train (optical, acoustical, thermal, photon density, etc.) passes the edge of an obstacle opaque to the wave motion; the phenomenon is a particular case of interference; the waves are bent at the edge of the obstacle, which acts as a source of secondary
606 |
Glossary 1. Physics, Statistics, and Engineering |
waves, all coherent; the interference between a primary wave and a secondary wave produces diffraction bands, which are interference bands.
diffraction of photon density wave (intensity wave): the bending of photon density waves around obstacles in their path; the phenomenon exhibited by wavefronts that, passing the edge of an opaque body, are modulated, thereby causing a redistribution of photon-density-wave amplitude within the front: it is detectable by the presence of minute bands with high and low amplitudes at the edge of a shadow; the phenomenon is a particular case of interference between primary and secondary photon density waves.
diffractometry: measuring techniques based on the phenomenon of wave diffraction.
diffuse photons: the photons that undertake multiple scatter with a broad variety of angles.
diffuse tomography: optical tomography based on reconstruction of the optical macro-inhomogeneity within a scattering medium using diffuse photon path- length-gating techniques and back-projection algorithms.
diffusion: the process by which one gas mixes with another by the movement of the molecules of one gas into another and vice versa; diffusion also occurs when two miscible liquids or solids come in contact with a solvent; the term is also used to describe the passage of molecules through a porous membrane.
diffusion approximation (diffusion theory): the approximated diffusion-type solution of the RTT, which is accurate for describing photon migration in infinite, homogeneous, highly scattering media.
diffusion coefficient: the proportionality coefficient between mean-square displacement of a particle within time interval τ: r2 Dτ; may be related to molecular or photon diffusion.
diffusion wave spectroscopy (DWS): spectroscopy based on the study of dynamic light scattering in dense media with multiple scattering and related to the investigation of particle dynamics within very short time intervals.
digital electronic autocorrelator: a device that reconstructs with a high accuracy the time-domain autocorrelation function of intensity fluctuations.
digital oscilloscope: a device that analyses with a high accuracy the waveform of ac signals.
diode laser: a semiconductor injection laser; GaAs laser (830 nm); GaPx As1−x lasers emit light from 640 nm (x = 0.4) to 830 nm (x = 0); Gax In1−x Asy P1−y , lasers, at y = 2.2x and for different values of x, emit in the range from 920 to 1500 nm; Pbx S1−x , Snx Pb1−x Te, and Snx Pb1−x Se lasers, for different values of x, emit in the range from 2.5 to 49 μm.
Tissue Optics: Light Scattering Methods and Instruments for Medical Diagnosis |
607 |
diode-pumped Nd:YAG: an integrated solid-state laser with an Nd:YAG crystal as a lasing medium and optical pumping provided by a single laser diode or by a laser (light) diode array or matrix.
dipole moment of transition: the mutual displacement and charges of a twocharged particle system (model of molecule); defines the electrical field of the electrically neutral system on distances larger than its size and the action of external fields on the system; when the dipole moment changes, the system emits electromagnetic waves.
dispersion: the state of being dispersed, such as a photon trajectory (general); the variation of the index of refraction of a transparent substance, such as a glass, with the wavelength of light, the index of refraction increases as the wavelength decreases (optics); the separation of white or compound light into its respective colors, as in the formation of a spectrum by a prism (optics); the scattering of values of a variable around the mean or median of a distribution (statistics); a system of dispersed particles suspended in a solid, liquid, or gas (chemistry).
dissector: a transmitting television tube; it can be used as a coordinate-sensitive photodetector.
distribution size function: a function that describes the probability distribution of a particle size value over the size values in the system.
divergence: the “spreading” of a light beam in general, and of a laser beam as it moves away from the laser in particular.
Doppler effect: the apparent change in the frequency of a wave, such as a light wave or sound wave, resulting from a change in the distance between the source of the wave and the receiver.
Doppler interferometry: the dynamic dual-beam interferometry when the reference beam path length is scanned with a constant speed; the Doppler signal induced is the measuring signal for depth profiling of an object placed in the measuring beam; the method is used in partially coherent interferometry or tomography of tissues.
Doppler microscopy: Doppler spectroscopy of a medium at a microscopic scale.
Doppler spectroscopy: the spectroscopy based on the study of dynamic light scattering (Doppler effect) in media with single scattering and related to investigation of the dynamics (velocity) of particles from the measurements of the Doppler shifts in the frequency of the waves scattered by the moving particles.
double-balanced mixer: an electronic device that mixes two optically detected signals that have the same radio frequency but different amplitudes and phases.
double integrating sphere (DIS) technique: a technique for in vitro evaluation of the optical parameters of tissue samples (μa, μs, and g); it is often combined with collimated transmittance measurements; it implies either sequential or simultane-
608 |
Glossary 1. Physics, Statistics, and Engineering |
ous measurement of three parameters: total transmittance Tt (using the integrating sphere), diffuse reflectance Rd (using the integrating sphere), and collimated transmittance Tc (using a distant detector behind the pinhole at the top of the integrating sphere).
dual-beam coherent interferometry: see Doppler interferometry.
dye laser: a laser in which the laser medium is a liquid dye; dye lasers emit in a broad spectral range (e.g., in the visible) and are tunable; wavelengths range from 340 to 960 nm, optical frequency doubling ranges from 217 to 380 nm, and parametric conversion ranges from 1060 to 3100 nm; emitted energy is from 1 mJ to 50 J in periodic pulse mode; mean power is from 0.06 to 20 W; and pulse duration is from 0.007 to 8 μs; pulse frequency from a single pulse to 1 kHz.
dynamic light scattering: light scattering by a moving object that causes a Doppler shift in the frequency of the scattered wave relative to the frequency of the incident light.
dynode chain of the PMT: a system of electrodes, each of which serves for the emission of secondary electrons in a vacuum tube.
elastic (static) light scattering: light scattering by static (motionless) objects that occurs elastically, without changes in photon energy or light frequency.
electromagnetic resonance: appears at interaction of the incident radiation with molecules attached to a rough metallic surface; is induced due to collective excitation of conduction electrons in the small metallic structures; also called surface plasmon resonance; surface-enhanced Raman scattering (SERS) is based on such electromagnetic effects.
electronic micrograph: micrographs of tissue and/or cell components received with the help of the electronic microscope.
electronic microscope: a parallel beam of electrons from an electron gun is passed through a very thin slice of tissue; differential scattering of the electron beam takes place, and an image of tissue microstructure is carried forward in the electron beam; an electron lens is used to focus the electron beam on a fluorescent screen, where a magnified image is formed; the image is registered using an optical camera; the resolving power of the electron microscope is very much greater than that of a light microscope.
electronic transition: if an electron in an atom is activated (given more energy) the electron moves to an energy level farther from the atom nucleus; if an electron moves back to a lower level, energy is given out as electromagnetic radiation.
electronic wave function: the magnitude of the wave function (ψ) represents the varying amplitude of the stationary wave system, in 3D, of an electron situated around a nucleus; associated with the stationary wave is a frequency, ν; ψ2 is the density of electrons per unit volume; ψ2dV is the probability of finding the electron, when it is considered as a particle, in a volume dV; the total volume of the
Tissue Optics: Light Scattering Methods and Instruments for Medical Diagnosis |
609 |
orbital gives a probability of unity; the effective electrical charge associated with a volume dV is −eψ2dV, where e is the charge of an electron; the four quantum numbers define possible states of the stationary waves.
electrophoresis: the movement of colloidal particles in an electric field; when two platinum electrodes connected to a dc supply are placed in a lyophobic sol (the disperse phase has no attraction for the continuous phase), the colloidal particles will move to either the cathode or anode depending on the charge on the particle; used for drug delivery in medicine.
emission spectrum: the emission obtained from a luminescent material at different wavelengths when it is excited by a narrow range of shorter wavelengths.
endoscopy: an optical technique and instrumentation for viewing internal organs.
energy: the product of power (watt, W) and time (sec, s); energy is measured in joule (J).
entropy: a measure of the amount of disorder in a system; the more disordered the system, the higher the entropy; an entropy change occurs when a system absorbs or emits heat; the change in entropy dS is measured as the heat change dQ divided by the temperature T at which the change takes place, dS = dQ/T .
erbium: yttrium aluminum garnet (Er:YAG) laser: a solid-state laser whose lasing medium is the crystal Er:YAG crystal with an emission in the mid-IR range of 2.79–2.94 μm.
evaporation: the process of changing a liquid into a vapor, usually by applying heat, or by the liquid taking heat from its surroundings; during this process the bulk of the liquid is reduced.
excitation spectrum: the emission spectrum at one wavelength is monitored, and the intensity at this wavelength is measured as a function of the exciting wavelength.
excimer laser: a laser whose lasing medium is an excited molecular complex, an excimer (molecule-dimer); the emission is in the UV; examples are: ArF laser, 193 nm; KrF laser, 248 nm; XeCl laser, 308 nm; and XeF laser, 351 nm.
excited state (energy level): electrons possess energy according to their position in relation to the nucleus of an atom; the closer the electron is to the nucleus the lower the energy; when the energy of an electron changes, it must do so in certain definite steps and not in a continuous way; the position in which electrons may be found according to their energy are called energy levels and sublevels; these levels are counted by their steps outward, and the numbers allotted to them are their quantum numbers.
extinction coefficient: see attenuation coefficient.
Fabry-Perot interferometer: the interferometer combined of two parallel mirrors (reflecting planes) displace each other by a distance of L (interferometer
610 |
Glossary 1. Physics, Statistics, and Engineering |
length); used as a precise optical filter in the super-resolution spectroscopy and as a cavity in lasers.
false color map: a map where each color is distributed through the map and the specific value of the measured parameter is prescribed, for example, the measured velocity of blood flow within the selected skin area; it is used for the fast qualitative estimation of parameter distribution and change.
far-field diffraction zone (far zone): the zone where Fraunhofer diffraction takes place; this is a type of diffraction in which the light source and the receiving screen are effectively at an infinite distance from the diffraction object, i.e., parallel beams of wave trains are used.
Faraday rotator: an optical device that rotates the polarization of light due to the Faraday effect, which in turn is based on a magneto-optic effect; it works because one polarization of the input light is in ferromagnetic resonance with the material that causes its phase velocity to be higher than the other.
fast Fourier transform (FFT) analysis: a fast algorithm for the expression of any periodic function as a sum of sine and cosine functions, as in an electromagnetic wave function.
F/D spectrometer: the spectrometer that uses the frequency-domain (photondensity wave) method for measuring the absorption and scattering spectra of an object (tissue).
femtosecond (fsec) (fs): –10−15 sec (s).
fiber: an optical waveguide that uses a phenomenon of total internal reflection for light transportation with low losses and is made from transparent glass, quartz, polymer, or crystal, usually with a circular cross-section; it consists of at least two parts, an inner part or core that has a higher refractive index and through which light propagates, and an outer part or cladding that has a lower refractive index and provides a totally reflecting interface between core and cladding.
fiber bundle: a flexible bundle of individual optical fibers arranged in an ordered or disordered manner and correspondingly named regular and irregular bundles.
fiber coupler: a fiber optical device that interconnects optical components.
fiber-optic catheter: a flexible single fiber or a fiber bundle used to move light into body cavities and back.
fiber-optic device: any type of device that uses fiber-optical components.
fiber-optic refractometer: a fiber-optic device used to measure the refractive index of a medium (tissue or biological liquid); such a device is usually used to explore the effect of disruption of the total internal reflection and is a robust instrument well suited for biomedical applications.
Tissue Optics: Light Scattering Methods and Instruments for Medical Diagnosis |
611 |
fiber-optic single-mode x-coupler: a fiber coupler that is made from a singlemode fiber and provides connections between four optical components; it is usually used as a key part of the integrated Michelson interferometer when it connects to a light source, a reference mirror, the reflecting surface under study, and a photodetector.
field of view: the extent of an object that can be imaged or seen through an optical system.
finite-difference method: in numerical analysis, finite differences play an important role they are one of the simplest ways to approximate a differential operator and are extensively used in solving differential equations.
finite-difference time-domain (FDTD): a numerical solution applied to a finite difference in space and time; numerical equivalent of the physical reality under investigation; for example, the solution of Maxwell’s equations describing light scattering by a cell.
finite element method: a numerical method for finding an approximate solution to partial differential equations (PDEs) as well as integral equations, such as the heat or radiation transfer equations; the solution approach is based either on eliminating the differential equation completely (steady state problems), or rendering the PDE into an equivalent ordinary differential equation, which is then solved using standard techniques such as the finite-difference method, etc.
flow cytometry: a technique for counting, examining, and sorting microscopic particles (cells) suspended in a stream of fluid; it allows simultaneous multiparametric analysis of the physical and/or chemical characteristics of single cells flowing through an optical and/or electronic detection apparatus.
flowmeter: a device for measuring parameters of a flow, such as flow velocity; for instance blood flow velocity.
fluence rate (total radiant energy fluence rate): the sum of the radiance over all angles at a point r¯; the quantity that is typically measured in irradiated tissues in units of watts per square centimeter.
fluorescence: the property of emitting light of a longer wavelength on absorption of light energy; essentially occurs simultaneously with the excitation of a sample.
fluorescence anisotropy: transition dipole moments have defined orientations within a molecule; upon excitation with linear polarized light, one preferentially excites those molecules, whose transition dipoles are parallel to the electric field vector of incident light; this selective excitation of an oriented population of molecules results in partially polarized fluorescence, which is described by fluorescence anisotropy.
fluorescence emission spectrum: a fluorescence spectrum measured at a certain excitation wavelength.
612 |
Glossary 1. Physics, Statistics, and Engineering |
fluorescence excitation-emission map: a map presenting the combined data of fluorescence emission and excitation spectra, where excitation and emission wavelengths are presented on x–y axes with corresponding fluorescence intensity values represented by the isometric lines on the map.
fluorescence excitation spectrum: the intensity of fluorescence measured at a certain emission wavelength as a function of the excitation wavelength.
fluorescence tomography: the tomography based on the detection of fluorescence signal fluorometer.
fluorophore: a chromophore that emits light with a characteristic spectral pattern at its excitation by a proper wavelength.
focal depth: every lens has a range of object positions that give an apparently focused image on a fixed screen; this range is called the depth of focus of the lens.
focal plane: a focusing plane that is perpendicular to the principle axis and also passes through the principle focus; rays parallel to each other, but at an angle to the principle axis, are brought to a focus in the focal plane.
focal spot: the spot obtained at the focus of a lens; the size of the spot depends on the lens and the wavelength, but its diameter is never smaller than the wavelength of light.
form birefringence: birefringence that is caused by the structure of a medium; for example, a system of long dielectric cylinders made from an isotropic substance and arranged in a parallel fashion shows birefringence of form.
forward scattering problem: the modeling of light propagation in a scattering medium by taking into account the experimental geometry, source, and detector characteristics and the known optical properties of a sample, and predicting the measurements and associated accuracies that result.
Fourier optical microscope: a microscope based on the principle that optical density spatial variations in the object plane of the microscope are converted by a Fourier transform into spatial frequency variations in the Fourier transform plane in the rear focal plane of the lens; if the optical density changes slowly across the object, the Fourier transform places most of the scattered light near zero angles (low spatial frequency) in the Fourier transform plane (a good model of a cell with clear cytoplasm); if the optical density changes rapidly across the object, the Fourier transform moves more of the energy to larger scattering angles (higher spatial frequency) in the Fourier transform plane (a good model of a cell with highly granular cytoplasm).
Fourier transform: an algorithm for the expression of any periodic function as a sum of sine and cosine functions.
Tissue Optics: Light Scattering Methods and Instruments for Medical Diagnosis |
613 |
Fourier transform infrared spectroscopy: spectroscopy based on light dispersion by using a Michelson interferometer with a tuned path length difference; in the IR it may provide a 102–103 higher signal-to-noise ratio, than a grating spectrometer.
fractal dimension: as the complexity of the object structure increases, its fractal dimension increases and is always higher than the topological dimension of the structure; for example, any structure described as a curve (tissue fiber) has a topological dimension of D = 1; however, if we make this curve more complex by bending it infinite times, its fractal dimension be equal to two when this curve will densely covers a finite area, or even to three when this curve will “pack” a cube.
fractal object: an object with a self-similar geometry, i.e., each arbitrarily selected part of it is similar to the whole object; fractal dimension of the object (structure) is always higher than its topological dimension.
frame grabber: an electronic device that provides video data acquisition and conversion to a digital form.
Franck-Condon principle: an electronic transition so fast that the vibrating molecule does not noticeably change its internuclear distance.
Fraunhofer diffraction: a type of diffraction in which the light source and the receiving screen are effectively at an infinite distance from the diffraction object, i.e., parallel beams of wave trains are used.
Fraunhofer diffraction approximation: a description of forward-direction scattering caused by large particles (on the order of 10 μm).
Fraunhofer zone: the zone where Fraunhofer diffraction takes place.
free diffusion: the diffusion process that occurs when molecules diffuse in the space free of any membranes and other barriers that hinder diffusion.
frequency-domain technique (method): a spectroscopic or imaging technique (method) that exploits an intensity-modulated light and narrow-band heterodyne detection.
Fresnel diffraction: a type of diffraction in which the light source and the receiving screen are both at a finite distance from the diffraction object, i.e., divergent and convergent beams of wave trains are used.
Fresnel reflection: the reflection of a beam of radiation, such as light, which takes place at the interface between two media of different refractive indexes; not all the radiation is reflected, some may be refracted.
Fresnel zone: the zone where Fresnel diffraction takes place.
GaAs laser: a laser based on the semiconductor material GaAs; the emission is in the NIR, at about 830 nm.
gas-microphone method: relates to opto-acoustic spectroscopy, when an object under study is surrounded by a gas (or combination of gases) that serves as an
614 |
Glossary 1. Physics, Statistics, and Engineering |
acoustic coupler between the object and an acoustic receiver such as a microphone; the spectroscopy of the surrounding gas, when an object’s optical and acoustical properties are known or fixed, the spectroscopy of the surrounding gas can also be determined.
Gaussian correlation function: the correlation function described by a bellshaped (Gaussian) curve.
Gaussian light beam: a light beam with a Gaussian shape for the transverse intensity profile; if the intensity at the center of the beam is Io, then the formula for a Gaussian beam is I = Io exp(−2r2/w2), where r is the radial distance from the axis and w is the beam “waist”; the intensity profile of such a beam is said to be bell shaped; a laser beam is a Gaussian one; a single-mode fiber also creates a Gaussian beam at its output.
Gaussian size distribution: distribution size function of a Gaussian shape.
Gaussian statistics (normal statistics): statistics when a bell-shaped (Gaussian) curve showing a distribution of probability associated with different values of a variate are valid.
Gegenbauer kernel phase function (GK): one of the approximations of the actual phase function for tissue; the Henyey-Greenstein phase function is a special case of the GK; GK is a good function for simulating light transport in a tissue characterized by a high scattering anisotropy, such as blood.
genetic inverse algorithm: genetic algorithms (GAs) are now widely applied in science and engineering as adaptive algorithms for solving practical problems; certain classes of problems are particularly suited for a GA based approach; the general acceptance is that GAs are particularly suited to multidimensional global search problems where the search space potentially contains multiple local minima; unlike other search methods, correlation between the search variables is not generally a problem; the basic GA does not require extensive knowledge of the search space, such as likely solution bounds or functional derivatives (http://gaul.sourceforge.net/intro.html).
Gladstone and Dale law: states that the mean value of the refractive index of a composition represents an average of the refractive indices of its components related to their volume fractions.
Glan-Taylor polarization prism: a type of prism which used as a polarizer or polarizing beamsplitter; the prism is made of two right-angled prisms of calcite (or other birefringent materials), which are separated on their long faces with an air gap; the optical axes of the calcite crystals are aligned parallel to the plane of reflection; total internal reflection of s-polarized light at the air gap ensures that only p-polarized light is transmitted by the device; because the angle of incidence at the gap can be reasonably close to Brewster’s angle, unwanted reflection of p-polarized light is reduced.
Tissue Optics: Light Scattering Methods and Instruments for Medical Diagnosis |
615 |
gold nanoparticles: particles made of gold with dimensions typically of 10– 50 nm; they have different chemical and optical properties than those that occur in bulk samples; due to the plasmon-resonant property, high surface reactivity, and their biocompatibility, gold nanoparticles can be used for in vivo molecular imaging and therapeutic applications, including optical detection of cancer and phototherapy.
goniophotometry (goniophotometric technique): the technique that measures of the angle-dependent light intensity distribution.
gradient index (GRIN) lens: focuses light through a precisely controlled radial variation of the lens material’s index of refraction from the optical axis to the edge of the lens; this allows a GRIN lens with flat or angle polished surfaces to collimate light emitted from an optical fiber or to focus an incident beam into an optical fiber; end faces can be provided with an anti-reflection coating to avoid unwanted back reflection.
grating spectrograph: a spectrograph that uses diffraction grating to produce optical spectra; a diffraction grating is a band of equidistant, parallel lines, usually more than 5000 to the inch, ruled on a glass or polished metal surface for diffracting light to produce optical spectra with a high resolution.
group refractive index: the refractive index associated with the group velocity of a train of waves traveling in a dispersive medium; the group velocity, and correspondingly the group refractive index, depends on the mean wavelength of a train of waves and the rate of change in velocity with wavelength.
Grüneisen parameter: a dimensionless, temperature-dependent factor proportional to the fraction of thermal energy converted into mechanical stress.
halogen lamp: an iodine-cycle tungsten incandescent lamp that is the visible/near infrared (360 nm to >1 μm) light source for spectrophotometry.
hard sphere approximation: the model of mutually impenetrable (hard) spheres; the interparticle forces are zero, except for the fact that two neighboring particles cannot interpenetrate each other.
heat capacity: a measurable physical quantity that characterizes the ability of a body to store heat as it changes in temperature; defined as the rate of change of temperature as heat is added to a body at the given conditions and state of the body (foremost its temperature); expressed in units of joules per Kelvin.
heat (thermal) conduction: the process of heat transfer through a body without visible motion of any part of the body; the process takes place where there is a temperature gradient; heat energy diffuses through the body by the action of particles of high kinetic energy on particles of lower kinetic energy; for solids with covalent bonding, there will be molecules for which motion is restricted to vibrations about fixed positions, and the energy is transferred by high frequency waves.
616 |
Glossary 1. Physics, Statistics, and Engineering |
heat transfer: a variety of processes that provide transfer of heat through a body and its surroundings, such as heat (thermal) conduction, heat convection, thermal radiation and absorption, latent heat of fusion, and vaporization.
helix: a connected series of concentric rings of the same radius, joined together to form a cylindrical shape.
hemoglobin spectrum: the main bands are the Soret band, the 400–440-nm segment, and the Q band, the 540–580-nm segment.
He-Ne (helium neon) laser: a gas laser whose medium is a mixture of He and Ne; lasers with the red emission (632.8 nm) are widely used; lasers with other wavelengths are also available: green (543 nm), yellow (594 nm), orange (604 and/or 612 nm), IR (1152, 1523, and/or 3391 nm).
Henyey-Greenstein phase function (HG): one of the practical semiempirical approximations of the scattering phase function.
hertz (Hz): a unit of frequency that is equal to 1 cycle per second; it is often used to indicate the pulse repetition rate of a laser (e.g., a 10-Hz laser emits 10 pulses per second); 1 kilohertz (kHz) is l03 Hz, 1 megahertz (MHz) is l06 Hz, 1 gigahertz (GHz) is 109 Hz, and 1 terahertz (THz) is 1012 Hz.
heterodyne microscopy: a microscopy technique that uses optical heterodyning to enhance the registered signal and image contrast.
heterodyne phase system: see “cross-correlation” measurement device.
heterodyne spectrum: the spectrum of the intensity fluctuations registered by a photodetector at the intermediate (beat) frequency as a central frequency of the measured spectrum; the intermediate frequency is chosen for technical reasons: it has the best signal-to-noise ratio.
heterodyne system with zero cross-phase detectors: the phase measuring system that uses amplitude modulation at two close radio frequencies, f1 and f2.
heterostructure: a semiconductor junction that is composed of layers of dissimilar semiconductor materials with nonequal band gaps; a quantum heterostructure’s size restricts the movements of the charge carriers and forces them into a quantum confinement that leads to formation of a set of discrete energy levels with sharper density than for structures of more conventional sizes; important for the fabrication of short-wavelength light-emitting diodes and diode lasers.
histogram: a form that represents the distribution of experimental data as a bar diagram.
hologram: a negative produced by exposing a high resolution photographic plate to two interfering waves: the subject wave, which is formed by illumination of a subject by monochromatic, coherent radiation, as from a laser, and the reference wave, which goes directly from the same light source (laser); when a hologram is
Tissue Optics: Light Scattering Methods and Instruments for Medical Diagnosis |
617 |
placed in a beam of coherent light, a true three-dimensional image of the subject is formed.
holographic microscopy: microscopy that uses holographic principles.
holography: the process or technique of making holograms.
homodyne phase system: a system that does not down convert the radio frequency prior to phase measurements.
homodyne spectrum: the self-beat spectrum of the intensity fluctuations registered by a photodetector; it is like the heterodyne spectrum, but with a central frequency equal to zero, and overlapping negative and positive spectrum wings.
homogeneous medium: a medium that has common physical properties, including optical properties, throughout.
humidity: a measure of the extent to which the atmosphere contains moisture (water vapor).
hydrated: being associated with water molecules.
hydrodynamic radius of a particle: the radius that is determined from the measurements of the translation diffusion coefficient for an ensemble of identical particles in the medium; it is larger than the initial one due to interactions with molecules of the medium.
hydrostatic pressure: the pressure at a point in a liquid is the force per unit area on a very small area round the point; if the point is at depth h in the liquid of density ρ, then pressure p = ρgh; the pressure at a point in a liquid at rest acts equally in all directions; the force exerted on a surface in contact with a liquid at rest is perpendicular to the surface at all points; measured in N/m2 or Pa (pascal).
hyperosmotic: a term that describes a liquid with a lower concentration of water and higher solute concentration than fluids in a tissue or cell; this term also means that if a cell is hyperosmotic, it absorbs water from the surroundings to dilute the higher solute concentration, thus making the cell isotonic to the environment.
hyperpolarizability: nonlinear polarizability, β, characterizes the nonlinear part of the induced dipole moment of the molecule, which is proportional to the squared external electric field with the coefficient of proportionality equal to (1/2)β.
Jabloski diagram: representation of molecular energy levels and transition rates using the potential curves that are plotted without regard to the variable nuclear distances.
Jones matrix: see amplitude scattering matrix.
image-carrying photons: a group of photons that produce an image of a certain macro-inhomogeneity within a scattering medium.
image reconstruction: see TOAST and tomographic reconstruction.
618 |
Glossary 1. Physics, Statistics, and Engineering |
imaging (image) contrast: pointing differences between two or more objects or points on the object; a parameter that characterizes differentiation (visibility) of the visualized object(s) hidden in the scattering surroundings; contrasting parameters may be used: light intensity, reflectance, polarization degree, fluorescence intensity and life-time, refractive index, reconstructed absorption and scattering coefficients, etc.
imaging resolution: when two objects are close together they might not form two images on the retina of the eye or matrix detector that are distinguishable; the ability to detect two such images of two objects close together is measured by the resolving power of the instrument; for a microscope two objects are resolved if the angular separation of the objects is not less than λ/D, where λ is the wavelength of the light used and D is the diameter of the objective; the smallest separation of two objects, if they are to be resolved, is 0.61λ/NA, where NA is the numerical aperture.
immersion medium (liquid): a liquid that provides optical matching between an objective and a biological object; it enhances the numerical aperture of the objective and the microscope resolution; in addition, optical matching reduces surface reflection and scattering, and consequently allows for the reception of higher contrast images.
immersion technique: the technique used to reduce light scattering in an inhomogeneous medium by matching the refractive index of the scatterers and ground substance; immersion liquids with an appropriate refractive index and rate of diffusion are usually used.
impedance: the measure of current flowing in an inductive or capacitative component of a circuit when an alternating potential difference is applied; the magnitude of the impedance varies with the frequency of the ac.
index of refraction: a number indicating the speed of light in a given medium as either the ratio of the speed of light in a vacuum to that in the given medium (absolute index of refraction) or the ratio of the speed of light in a specified medium to that in the given medium (relative index of refraction).
inelastic scattering: from quantum electrodynamics it follows that an individual light-scattering event is considered the absorption of the incident photon, which has the energy hν, momentum (h/2π)k, and polarization p, by a particle of the scattering medium, and then the emission of the photon that has energy hν , momentum (h/2π)k , and polarization p ; at ν =ν light scattering is accompanied by the redistribution of energy between the radiation and the medium, and is called inelastic, for example, Raman scattering; at ν = ν , when no redistribution takes place light scattering is called elastic or Rayleigh scattering.
infrared spectroscopy: a spectroscopy of middle and far infrared wavelength range the that uses light-excited vibrational-energy states in molecules to get in-
Tissue Optics: Light Scattering Methods and Instruments for Medical Diagnosis |
619 |
formation about the molecular composition, molecular structures, and molecular interactions.
inhomogeneous medium: a medium with a regular or irregular spatial distribution of physical properties, including optical properties.
integrating sphere: a photometric sphere with a highly reflecting white or metallic coating and photodetector inside; used for the precise measurement of diffuse reflectance or total transmittance of scattering materials (tissues); integrating spheres are usually coated with materials that have smooth and high reflectance in the visible and NIR; barium-sulfate, MgO, Spectralon, and Zenith are most commonly used; for IR applications gold coatings are available.
integration time: the time interval over which measurements are taken; longer integration times allow more averaging in order to filter out background noise and boost the signal-to-noise ratio.
intensity: several measures of light are commonly known as intensity: radiant intensity is a radiometric quantity, measured in watts per steradian (W/sr); luminous intensity is a photometric quantity, measured in lumens per steradian (lm/sr), or candela (cd); radiance (irradiance) is commonly called “intensity,” measured in watts per meter squared (W/m2).
intensity probability density distribution function: a function that describes the distribution of probability over the values of the light intensity.
interference: the process in which two or more light, sound, or electromagnetic waves of the same frequency combine to reinforce or cancel each other, with the amplitude of the resulting wave being equal to the algebraic sum of the amplitude of the combining waves.
interference fringes: a series of alternating dark and bright bands produced as a result of light interference; with a monochromatic source of light, the bands (fringes) are alternately bright and dark; with white light, the interference bands are colored.
interference of photon density waves (intensity waves): the process in which two or more photon density waves of the same frequency combine to reinforce or cancel each other, with the amplitude of the resulting wave being equal to the algebraic sum of the amplitude of the combining waves.
interference of speckle fields (speckle-modulated fields): the interference of the fields in which amplitudes and phases are randomly modulated due to their interaction (scattering) with inhomogeneous (scattering) media.
interferometer: an instrument that splits a beam of light into a number of coherent beams and then superimposes the beams to obtain interference fringes; the instrument is used to accurately measure wavelengths of light, to examine the hyperfine structure of spectra, to test optical elements for refraction purposes; and to accurately measure distance, displacement, and vibrations.
620 |
Glossary 1. Physics, Statistics, and Engineering |
internal conversion: as a transition between one set of atomic (or molecular) electronic excited levels to another set of the same spin multiplicity (for example, the second singlet state to the first singlet state); it is sometimes called “radiationless deexcitation,” because no photons are emitted; it differs from intersystem crossing in that, while both are radiationless methods of deexcitation, the molecular spin state for internal conversion remains the same, whereas it changes for intersystem crossing.
intersystem crossing: a photophysical process; an isoenergetic nonradiative transition between two electronic states that have different multiplicities; it often results in a vibrationally excited molecular entity in the lower electronic state, which then usually deactivates to its lowest vibrational level.
invariant embedding method: a method applied to the propagation of various wave types (acoustic, gravity, and electromagnetic) in inhomogeneous media; this method is used to reduce the initial boundary value problems to problems with initial data, permitting the solution of both determinate and statistical problems; it is applicable to both stationary (linear and nonlinear) and nonstationary wave problems.
inverse adding-doubling (IAD) method (technique): a method that provides a tool for the rapid and accurate solution to the inverse scattering problem; it is based on the general method for the transport equation for plane-parallel layers; the term “doubling” means that the reflection and transmission estimates for a layer at certain ingoing and outgoing light angles may be used to calculate both the transmittance and reflectance for a layer twice as thick by means of superimposing one upon the other and summing the contributions of each layer to the total reflectance and transmittance; reflection and transmission in a layer that has an arbitrary thickness are calculated in consecutive order, first for the thin layer with the same optical characteristics (single scattering), then by consecutive doubling of the thickness for any selected layer; the term “adding” indicates that the doubling procedure may be extended to heterogeneous layers for modeling multilayer tissues or taking into account internal reflections related to abrupt changes in refractive index.
inverse MC (IMC) method: the iterative method based on the statistical simulation of photon transport in the scattering media; provides the most accurate solutions to inverse scattering problems; it takes into account the real geometry of the object, the measuring system, and light beams; the main disadvantage is the long computation time.
inverse scattering problem: an attempt to take a set of measurements and error estimates, and only a limited set of parameters describing the sample and experiment, and to deriving the remaining parameters; usually the geometry is known, intensities or their parameters are measured, and the optical properties or sizes of scatterers need to be derived; if these properties are considered to be spatially varying, then the resultant solutions can be presented as a 2D or 3D function of space, i.e., as an image.
Tissue Optics: Light Scattering Methods and Instruments for Medical Diagnosis |
621 |
ionizing radiation: either particle radiation or electromagnetic radiation in which an individual particle/photon carries enough energy to ionize an atom or molecule by completely removing an electron from its orbit; these ionizations, if enough occur, can be very destructive to living tissue and can cause DNA damage and mutations; examples of particle radiation that are ionizing may be energetic electrons, neutrons, atomic ions, or photons; electromagnetic radiation can cause ionization if the energy per photon, or frequency, is high enough, and thus the wavelength is short enough; the amount of energy required varies between molecules being ionized; x rays and gamma rays will ionize almost any molecule or atom; far ultraviolet, near ultraviolet, and visible light are ionizing to some molecules; microwaves and radio waves are nonionizing radiation.
IQ circuit: an in-phase quadrature demodulator, a device that allows one to measure the amplitude and phase of an ac signal using the 0◦/90◦-phase mixing technique of the receiving and reference signals.
irradiance: a radiometric quantity, measured in watts per meter squared (W/m2).
irreversible thermodynamics: if the change from initial state to final state of the system is so slow that the process can be assumed to be proceeding through a series of closely spaced quasi-equilibrium states, then such a process is called a reversible process, and the entire time evolution of each of the state variables can be obtained from the conventional theory of thermodynamics; but almost all the processes in which we are most interested are irreversible processes, and the system is not in an equilibrium state during the time the system is evolving; a general theory of nonequilibrium thermodynamics does not exist; the thermodynamics of steadystate processes is relatively well established at least when the system does not deviate from equilibrium substantially.
isobestic point: the point (wavelength) at the spectra having an identical absorption for different forms of molecules.
isotropic scattering: equality of scattering properties along all axes.
KDP: kalium dihydrophosphate; the material widely used in nonlinear optics, for example, for light modulation and frequency doubling.
Kirchhoff approximation: an approximate method for solving wave diffraction problems that is applicable for finding the diffracted field at wave diffraction on inhomogeneities with sizes much larger than the wavelength.
K-space spectral analysis: a near-field wave technique that relies on a series of 2D fast Fourier transforms and that is employed for fast image reconstruction.
Kubelka-Munk model: a two-flux model describing the transportation of radiation in a scattering medium; it employs simple relations for evaluating optical parameters using the diffuse transmittance and reflectance measurements.
laminar flow: occurs when a fluid flows in parallel layers with no disruption between the layers; in fluid dynamics, laminar flow is a flow regime characterized by
622 |
Glossary 1. Physics, Statistics, and Engineering |
high momentum diffusion, low momentum convection, and pressure and velocity independence from time; it is the opposite of turbulent flow.
Laplace transform: a technique for analyzing linear time-invariant systems such as electrical circuits, harmonic oscillators, optical devices, and mechanical systems; it gives a simple mathematical or functional description to the input or output of a system.
laser: acronym for light amplification by the stimulated emission of radiation; a device that generates a beam of light that is collimated, monochromatic, and coherent.
laser beam: a group of nearly parallel rays generated by a laser; a light beam with a Gaussian shape for the transverse intensity profile (see Gaussian light beam).
laser calorimetry: a measuring technique that detects a temperature rise in a sample induced by absorption of a laser beam.
laser Doppler anemometry: the technique of measuring the velocity of flows by the Doppler method using a laser (see Doppler effect, Doppler microscopy, and
Doppler spectroscopy).
laser Doppler interferometry: the technique of measuring the velocity of the particles in a flow by the Doppler method using a laser interferometer when a particle’s velocity is measured by its traversing of interference fringes.
laser flow cytometry: flow cytometry (see cytometry in Glossary 2) with laser excitation of fluorescence, light scattering, or polarization transform of cells under investigation.
laser heating: the heating of an object by laser radiation.
laser interferential retinometer: a device for determining retinal visual acuity in the human eye by projecting the interference fringes produced by a laser interferometer at the retina.
laser power: rate of radiation emission from a laser, normally expressed in watts (W), milliwatts (mW), or microwatts (μW).
laser radiation: the radiation emitted by a laser.
laser speckle contrast analysis (LASCA): the method that uses the spatial statistics of time-integrated speckles; the full-field technique for visualizing capillary blood flow.
latex: a suspension of micron-sized polystyrene spheres.
length of thermal diffusivity (thermal length): the length within a medium (tissue) characterizing the distance of heat diffusion at medium heating by a short localized laser or acoustic pulse.
lenslet: a set of spatially distributed lenslike (phase) irregular inhomogeneities.
Tissue Optics: Light Scattering Methods and Instruments for Medical Diagnosis |
623 |
Light: ultraviolet (UV), UVC: 100–280 nm; UVB: 280–315 nm; UVA: 315– 400 nm: visible: 400–780 nm (violet: 400–450 nm; blue: 450–480 nm; green: 510–560 nm; yellow: 560–590 nm; orange: 590–620 nm; red: 620–780 nm); infrared (IR) light, IRA: 0.78–1.4 μm: IRB: 1.4–3.0 μm; IRC: 3–1000 μm; near IR (NIR): 0.78–2.5 μm; middle IR (MIR): 2.5–50 μm; and far IR (FIR): 50– 2000 μm.
light-emitting diode (LED) (light diode): a semiconductor device that emits light when the forward-directed current passes the p-n junction.
lifetime of the excited state: “lifetime” refers to the time the molecule (atom) stays in its excited state before emitting a photon; the lifetime is related to the rate of the excited state of decay, to the facility of the relaxation pathway, radiative and nonradiative; if the rate of spontaneous emission, or any other rate, is fast the lifetime is short; for commonly used fluorescent compounds the typical excited state decay times are within the range of 0.5 to 20 ns.
light guide: an assembly of optical fibers that are bundled but not ordered and that are used for illumination.
light scattering: a change in direction of the propagation of light in a turbid medium caused by reflection and refraction by microscopic internal structures.
light-scattering matrix [LSM (intensity or Mueller matrix)]: the 4 × 4 matrix that connects the Stokes vector of incident light with the Stokes vector of scattered light; it describes the polarization state of the scattered light in the far zone that is dependent on the polarization state of the incident light and structural and optical properties of the object.
linear regression: a regression method that allows for the linear relationship between the dependent variable Y and the p independent variables X and a random term ε.
Linnik microscope: see Linnik-Tolansky interferometer.
Linnik-Tolansky interferometer: a dual-beam interferometer with a beamsplitter, two reflecting surfaces, and two lenses for focusing beams on the surfaces.
liquid crystal: a substance that exhibits a phase of matter that has properties between those of a conventional liquid, and those of a solid crystal; for instance, a liquid crystal may flow like a liquid, but it has the molecules in the liquid arranged and/or oriented in a crystal-like way.
lithium niobate (LiNbO3): a compound of niobium, lithium, and oxygen; it is a colorless solid material with a trigonal crystal structure; it is transparent for wavelengths between 350 and 5200 nanometers and is used for the manufacture of optical modulators and acoustic wave devices.
local oscillator: the radio- (or optical) frequency oscillator used in heterodyne detecting systems; a local oscillator is stable in frequency and amplitude and has a
624 |
Glossary 1. Physics, Statistics, and Engineering |
slightly different frequency than the receiving signal; it is used for converting a high-frequency receiving signal to an intermediate frequency by mixing the local oscillator signal and the receiving signal at an electronic (or photo) detector.
lock-in-amplifier: a low-frequency electronic device that provides synchronous detection of small signals that may have amplitudes a few orders lower than the noise level; the lock-in circuit contains the selective amplifier and a phase detector tuned to the modulation frequency of the detecting signal.
low-pass filter: a filter that rejects the high-frequency components.
low-step scattering: the scattering process in which, on average, each photon undertakes no more than a few scattering events (approximately less than five to ten).
LSM element: one of 16 elements of the light-scattering matrix; each element depends on the scattering angle and wavelength, and the geometrical and optical parameters of the scatterers and their arrangement.
luminescence: light not generated by high temperatures alone; it is different from incandescence, in that it usually occurs at low temperatures and is thus a form of cold body radiation; it can be caused by, for example, chemical reactions, electrical energy, subatomic motions, or stress on a crystal; the following kinds of luminescence are known: fluorescence, phosphorescence, bioluminescence, photoluminescence, sonoluminescence, chemoluminescence, electroluminescence, radioluminescence, mechanoluminescence, triboluminescence, piezoluminescence, thermoluminescence, et al.
Mach-Zehnder interferometer: a dual-beam, four-mirror (two serve as the beamsplitter and beam coupler, and two as reflectors) interferometer typically used as a refractometer, especially for objects occupying a large space.
magnetic resonance imaging (MRI): a noninvasive imaging technique that is based on magnetic resonance methods; it provides a wealth of information about inner structures of the body and, in particular, tumors.
matching substance: a substance used to reduce the boundary effects caused by the complex shape of a scattering object; the scattering properties of such a substance should be similar to the scattering properties of the object under study.
material dispersion: describes the separation of the different wavelengths in a given medium (material) that occurs because the waves are traveling at different velocities in that medium.
Matlab: a high-level language and interactive environment that enables one to perform computationally intensive tasks faster than with traditional programming languages such as C, C++, and Fortran.
mean free path length (MFP): the mean distance between two successive interactions with scattering or absorption experienced by a photon traveling in a scattering-absorption medium.
Tissue Optics: Light Scattering Methods and Instruments for Medical Diagnosis |
625 |
mechanical stress: the action on a body of any system of balanced forces that results in strain or deformation.
mercury arc lamp: a discharge arc lamp filled with mercury vapor at high pressure; it gives out very bright UV and visible light at some wavelengths, including 303, 312, 365, 405, 436, 546, and 578 nm.
meridional plane: planes that include the optical axis are meridional planes; it is common to simplify problems in radially symmetric optical systems by choosing object points in the vertical plane only; this plane is then sometimes referred to as the meridional plane.
MgO (magnesium oxide, or magnesia): a white solid mineral that occurs naturally as periclase and is a source of magnesium; it is formed by an ionic bond between one magnesium and one oxygen atom; it is used as a reference white color in photometry and colorimetry; the emissivity value is about 0.9; pressed MgO is used as an optical material; it is transparent from 300 nm to 7 μm; the refractive index is 1.72 at 1 μm.
Michelson interferometer: a dual-beam interferometer with a beamsplitter and two reflecting surfaces; it allows one to realize various types of interference and is widely used in metrology for measurements of lengths, displacements, vibrations, and surface roughness; recently an integrated fiber-optic prototype became very popular (see fiber-optic single-mode X-coupler); also widely used in tissue spectroscopy and imaging (see dual-beam coherent interferometry and Doppler interferometry).
micrometer (i.e., micron or μm): a unit of length that is 10−3 millimeter (mm) or l0−6 meter (m).
microphone: a device for transforming sound energy into electrical energy; the various types are the carbon microphone, crystal microphone, condenser microphone, and a moving coil or dynamic microphone.
microprofilometer: a device for measuring the roughness of a surface.
microscopy: any technique for producing visible images of structures or details too small to otherwise be seen by the human eye, using a microscope or other magnification tool; more specifically, it is a technique of using a microscope; there are three main branches of microscopy: optical, electron, and scanning probe microscopy; optical and electronic microscopy involves the diffraction, reflection, or refraction of radiation incident upon the subject of study, and the subsequent collection of this scattered radiation in order to build up an image; this process may be carried out by wide-field irradiation of the sample (for example, standard light microscopy and transmission electron microscopy) or by scanning a fine beam over the sample (for example, confocal microscopy and scanning electron microscopy); scanning probe microscopy involves the interaction of a scanning probe with the surface or object of interest.
626 |
Glossary 1. Physics, Statistics, and Engineering |
microsecond (μsec) (μs): 10−6 sec (s).
micro-spectrophotometric technique: a technique that measures an object’s transmittance or reflectance spectra with a high spatial resolution; usually a combination of a microscope and a grating spectrograph with an optical multichannel analyzer (cooled CCD or photodiode array) is used for such measurements.
Mie or Lorenz-Mie scattering theory: an exact solution of Maxwell’s electromagnetic field equations for a homogeneous sphere.
millisecond (msec) (ms): 10−3 sec (s).
minimal erythema dose (MED): the minimal single dose of UV radiation, expressed as energy per unit area J/cm2, producing a clearly marginated erythema at the irradiated skin site after 24 hours for UVB and 48 hours for UVA.
M-mode OCT image: an image obtained from repeated A-scans without moving the incident beam, so it can easily visualize living-object movement and timedependent changes of tissue structure.
mode-locked laser: a multimode laser with synchronously irradiating modes; the regime is obtained by applying an intracavity high-frequency modulator, with a typical pulse duration of up to a subpicosecond range and a repetition frequency of dozens of megahertz.
modulation: the process of varying the characteristics of an optical wave motion by superimposing on it the characteristics of a second (audioor radiofrequency) wave motion; there are three main types of modulation: amplitude modulation, frequency modulation, and phase modulation.
modulation frequency: the frequency of the modulating wave.
molecular hyperpolarizability: see hyperpolarizability.
monochromatic light: light of one color (wavelength) only or a very limited range of wavelengths; produced by a CW single-frequency (single longitudinal mode) laser.
monodisperse model: a model presenting a disperse medium as monodisperse, such as an ensemble of scatterers with an equal size and refractive index for each scatterer: a healthy eye cornea is a good example of a monodisperse model.
monodisperse system: a disperse system (medium) with a single characteristic parameter, such as an ensemble of scatterers with an equal size and refractive index for each scatterer; a healthy eye cornea is a good example of a monodisperse system, because it consists of dielectric rods with the same refractive index and radius dispersed in a homogeneous ground substance.
Monte Carlo method: a numerical method of statistical modeling; in tissue studies it provides the most accurate simulation of photon transport in samples with a
Tissue Optics: Light Scattering Methods and Instruments for Medical Diagnosis |
627 |
complex geometry, accounting for the specificity of the measuring system and light beam configurations.
Mueller matrix: a 4 × 4 matrix that transforms an incident Stokes vector into the corresponding output Stokes vector of the sample; it fully characterizes the optical polarization properties of the sample; it can be experimentally obtained from measurements with different combinations of source polarizers and detection analyzers; at least 16 independent measurements must be acquired to determine a full Mueller matrix.
multichannel optoelectronic near-infrared system for time-resolved image reconstruction (MONSTIR): the noninvasive imaging technique developed at University College London for studying infant brain function that is based on the detection of transmitted pulsed NIR radiation.
multichannel plate: an integrated optical system used for optical amplification (image intensification).
multichannel plate-photomultiplier tube (MCP-PMT): a photomultiplier tube that is integrated with a multichannel plate.
multiflux model: the simplest multiflux model describing transportation of radiation in a scattering medium that employs only two fluxes is the Kubelka-Munk model; a more general approach is the discrete ordinates method (or many-flux theory) when the transport equation (RTT) can be converted into a matrix differential equation by considering the radiance at many discrete angles; by increasing the number of angles, the matrix solution should approach the exact solution; for laser beam applications, the four-flux model makes use of two diffuse fluxes and forward and backward coherent fluxes; a three-dimensional six-flux model is also available.
multifrequency multiplex (time division multiplex): a process in which measurements on many modulation frequencies are provided concurrently.
multilayered tissue: a tissue that consists of many layers with different structural and optical properties, such as skin, the bladder wall, and wall of bladder.
multimode fiber: a single fiber that allows the excitation (direction) of many modes (rays); e.g., for a fiber with a core diameter of 50 μm, numerical aperture, NA = 0.2, and an excitation wavelength of 633 nm, the number of excited modes is equal to 1250.
multiphoton absorption process: a process that needs a very high density of photons (0.1–10 MW/cm2) from a ps-to-fs-pulsed light source; this is because the virtual absorption of a photon of nonresonant energy lasts only for a very short period (10−15–10−18 s); during this time a second photon must be absorbed to reach an excited state (http://www.fz-juelich.de/ibi/ibi-1/Two-Photon_Microscopy/).
multiphoton fluorescence: relies on the quasi-simultaneous absorption of two or more photons (of either the same or different energy) by a molecule; during the
628 |
Glossary 1. Physics, Statistics, and Engineering |
absorption process, an electron of the molecule is transferred to an excited-state molecular orbit; the molecule (i.e., the fluorophore) in the excited state has a high probability (>10%) to emit a photon during relaxation to the ground state; due to radiationless relaxation in vibrational levels, the energy of the emitted photon is lower compared to the sum of the energy of the absorbed photons (http://www.fz- juelich.de/ibi/ibi-1/Two-Photon_Microscopy/).
multiphoton fluorescence scanning microscopy: the microscopy that employs detection of multiphoton fluorescence at the scanning of a laser beam, inducing the multiphoton signal (see also two-photon fluorescence microscopy).
multiple scattering: a scattering process in which, on average, each photon undertakes many scattering events (approximately more than five to ten).
multiwavelength multiplex (wavelength division multiplex): a process in which measurements on many wavelengths are provided concurrently.
nanometer (nm): a unit of length equal to l0−9 meter (m).
nanoparticle: a microscopic particle whose size is measured in nanometres (nm); it is defined as a particle with at least one dimension <100 nm.
nanosecond (nsec) (ns): l0−9 sec (s).
narrow-band filter: an electronic device that selectively damps oscillations of frequencies out of the narrow band while not affecting oscillations of frequencies within this band.
Nd:YAG (neodymium:yttrium aluminium garnet) laser: a solid-state laser whose lasing medium is the crystal Nd:YAG with emission in the NIR at 1064 nm; other less intensive lines at 946, 1319, 1335, 1338, 1356, and 1833 nm are also available.
network analyzer: a two-channel electronic system for measuring amplitude frequency characteristics of a four-terminal network producing modulation swept in the wide-frequency range (for example, 0.3–1000 MHz) and analyzing the detected signal synchronously in the same frequency range.
Nomarski polarizing-interference microscope: an optical microscope with differential interference contrast that incorporates a common path interferometer based on a polarizing prism.
non-Gaussian statistics: a statistically nonuniform process in which the statistical characteristics of the scattered light essentially depend on the observation angle and the degree of nonuniformity of an object.
nonlinear polarization of a material: if the dielectric polarization density (dipole moment per unit volume) P is not linearly proportional to the electric field E, the medium is termed nonlinear and is described by the field of nonlinear optics; to a good approximation (for sufficiently weak fields, assuming no permanent dipole
Tissue Optics: Light Scattering Methods and Instruments for Medical Diagnosis |
629 |
moments are present), P is usually given by a Taylor series in E whose coefficients are the nonlinear susceptibilities.
nonlinear regression technique: related to a model y = f (x, θ) + ε, based on multidimensional x, y data, where f is some nonlinear function with respect to unknown parameters θ; at a minimum, one may like to obtain the parameter values associated with the best fitting curve.
nonlinear susceptibility: the electric susceptibility of a dielectric material is a measure of how easily it polarizes in response to an electric field; this, in turn, determines the electric permittivity of the material and thus influences many phenomena in that medium (for instance, the speed of light); linear susceptibility is defined as the constant of proportionality (which may be a tensor) relating an electric field E, and nonlinear, relating to E2, E3, etc., to the induced dielectric polarization density P .
non-Newtonian flow: the flow of a fluid in which the viscosity changes with the applied strain rate; as a result, non-Newtonian fluids may not have a well-defined viscosity.
nonradiative relaxation (nonradiative energy transfer): the relaxation of an excited molecule (losing energy) without emission of light, when the molecule’s energy is transformed into the heat, which raises the temperature of the body absorbing the energy by increasing the kinetic energy of the particles composing the body.
nonuniform medium: see inhomogeneous medium.
numerical aperture (NA): the light-gathering power of an objective or optical fiber; it is proportional to the sine of the acceptance angle.
objective speckles: the speckles formed in a free space and usually observed on a screen placed at a certain distance from an object.
open-circuit: in electronics, the absence of a load through which electric current would otherwise flow; this can be represented by an infinitely large resistance or impedance.
optical activity: the ability of a substance to rotate the plane of polarization of plane- (linear) polarized light (see chirality).
optical anisotropy: the difference of optical properties of materials caused by the dependence of light velocity (refractive index) on the direction of light propagation and polarization of light (see anisotropic crystal); it manifests as birefringence, dichroism, and optical activity, as well as depolarization at light scattering in a medium, polarized fluorescence, etc.; optical anisotropy may be induced in an optically isotropic medium at external action (mechanical, electrical, magnetic, etc.) that changes its local symmetry; related effects are photoelasticity, Kerr effect, Faraday effect, Cotton-Mouton effect, and nonlinear optical activity.
630 |
Glossary 1. Physics, Statistics, and Engineering |
optical attenuator: a device for decreasing the intensity of light; optically neutral or color filters are usually used as attenuators with a fixed or stepwise-variable attenuation; for polarized light an attenuator with a continuously variable attenuation of the rotating polarizer (analyzer) is used.
optical autocorrelator: a device for measuring the autocorrelation function of intensity fluctuations of a scattered optical field.
optical birefringence: see birefringence.
optical breakdown: a breakdown in air (and in other transparent media) that is initiated by intense light; the required intensity for optical breakdown depends on the pulse duration; for example, for 1-ps pulses an optical intensity of ≈2 × 10¹³ W/cm2 is required; the high optical intensities can be reached in pulses as generated, e.g., in a Q-switched laser (with nanosecond durations) or in a mode-locked laser and amplified in a regenerative amplifier (for pulse durations of picoseconds or femtoseconds).
optical calorimetry: a measuring technique that detects of a temperature rise in a sample induced by light-beam absorption.
optical clearing: controlling optical properties of a scattering medium resulting in the increase of its optical transmittance.
optical coherence interferometry (OCI): see Doppler interferometry and dualbeam coherent interferometry.
optical coherence microscopy: an optical microscope based on a short-focused OCT.
optical coherence tomography (OCT): a technique that is based on Doppler interferometry in which a partially coherent light source is used and, in addition to the reference beam path length scanning (z-scan) that provides depth profiling of an object, transverse (x–y) scanning for 3D images is used; the integrated singlemode fiber-optic Michelson interferometer is usually used in OCT; the method is widely used for subsurface tomography of tissue.
optical coherent reflectometry: see optical coherence tomography (OCT).
optical conjugate: two optical points, lines, etc. that are so related as to be interchangeable in certain optical properties; an optical system that provides two points so that a source at one point is brought to focus at the other, and vice versa.
optical darkening effect: controlling of optical properties of a scattering medium resulting in the decrease of its optical transmittance.
optical depth: a measure of transparency, and is defined as the fraction of radiation that is scattered and/or absorbed on a path; the optical depth τ expresses the quantity of light removed from a beam by scattering and/or absorption during its path through a medium.
Tissue Optics: Light Scattering Methods and Instruments for Medical Diagnosis |
631 |
optical detector: a device that converts optical energy to an electric signal.
optical diffusion tomography: an optical tomography that is based on the measurements of CW, pulsed, or modulated light beam transmittance or spatiallyresolved reflectance of scattering media with an object (i.e., a tumor) hidden in it; to provide 3D images, synchronous light beam-detector scanning devices or systems with multiple fixed-position light sources and detectors are used; the backprojection algorithm is used to provide image reconstruction along the paths of ballistic and/or least scattering photon propagation; the method is used for tomography of thick tissues (breast, brain, arm).
optical fiber cladding: see fiber.
optical fiber core: see fiber.
optical fiber coupler: see fiber coupler.
optical fiber dispersion: in optics, dispersion is a phenomenon that causes the separation of a wave into spectral components with different wavelengths, due to the dependence of the wave’s speed on its wavelength; dispersion is sometimes called chromatic dispersion to emphasize its wavelength-dependent nature; there are generally two sources of dispersion: material dispersion, which comes from the frequency-dependent response of a material to waves, and waveguide dispersion, which occurs when the speed of a wave in a waveguide (optical fiber) depends on its frequency; the transverse modes for waves confined laterally within a finite waveguide generally have different speeds (and field patterns), depending upon the frequency (that is, on the relative size of the wave, the wavelength, compared with the size of the waveguide); dispersion in an optical fiber results in signal degradation, because the varying delay in arrival time between different components of a signal “smears out” the signal in time; a similar phenomenon is modal dispersion, caused by a waveguide that has multiple modes at a given frequency, each with a different speed; a special case of this is polarization mode dispersion, which comes from a superposition of two modes that travel at different speeds due to random imperfections that break the symmetry of the waveguide.
optical Fourier transform: the transform when spatial variations in optical density in the object plane are converted into spatial frequency variations in the Fourier transform plane in the rear focal plane of a lens.
optical image: a reconstructed image of an object expressed in terms of local optical parameters, such as absorption and/or scattering coefficients.
optical Kerr effect: the double refraction of light in certain substances that is produced by an external electric field, including high-frequency fields up to the frequencies of IR light.
optical Kerr gate: a transparent cell filled with a substance that shows a Kerr effect and contains two electrodes placed between two polarizers: the cell serves as a high-speed optical shutter.
632 |
Glossary 1. Physics, Statistics, and Engineering |
optical length (optical path length): in a medium with a constant refractive index, the product of the geometric distance and the refractive index; in a medium with a varying refractive index, the integral of the product of an element of length along the path and the local refractive index; optical length is proportional to the phase shift that a light wave undergoes along a path.
optical mean free path (MFP): see mean free path length.
optical medical tomography: see optical diffusion tomography and optical coherence tomography (OCT).
optical microscopy: see microscopy.
optical multichannel analyzer (OMA): a spectrometric instrument that senses incident radiation in several channels at the same time, sorts the radiation from deep ultraviolet to the infrared, and digitizes and stores the information so that it can be processed and analyzed individually by channel.
optical parameters: the physical parameters that characterize the optical properties of an object.
optical parametric oscillator (OPO): a parametric oscillator that oscillates at optical frequencies; it converts an input laser wave (called a “pump”) into two output waves of lower frequency (ωs, ωi) by means of nonlinear optical interaction; the sum of the output wave frequencies is equal to the input wave frequency: ωs + ωi = ωp; the OPO essentially consists of an optical resonator and a nonlinear optical crystal; the optical resonator serves to resonate at least one of the output waves.
optical path: see optical length (optical path length).
optical phantom: a medium that models the transport of visible and infrared light in tissue and is needed to evaluate techniques, to calibrate equipment, to optimize procedures, and for quality assurance.
optical retarder: a device that provides an optical retardation: phase shift or optical path difference; such retarders as the halfor the quarter-wavelength plates provide, respectively, the half-wave or the quarter-wave phase difference.
optical sectioning (slicing): the process of extracting the optical image of a thin layer of tissue; the image is used for tomographic reconstruction of a whole body organ.
optical transition: typically an electronic transition, where energy is given out as electromagnetic radiation in the optical range.
optical transition lifetime: the radiative lifetime, which is determined by the emission cross section for transition to a lower-lying energy level.
optically thick sample: optical thickness is the depth of a material or medium in which the intensity of light of a given wavelength is reduced by a factor of 1/e
Tissue Optics: Light Scattering Methods and Instruments for Medical Diagnosis |
633 |
because of absorption and/or scattering; a sample with high thickness and/or high turbidity that correspond to a few optical thickness depths is optically thick.
optically thin (transparent) sample: a sample with low thickness and/or low turbidity that corresponds to one or less than one optical thickness depth is optically thin.
optoacoustic (OA) interaction: the generation of acoustic waves by the interaction of pulsed or intensity-modulated optical radiation with a sample; actually, several effects can be responsible for such interaction, e.g., the optical inverse piezoelectric effect, optical electrostriction, or optothermal effect.
OA method: the detection of acoustic waves generated via OA interaction with a sample (the term OA primarily refers to the time-resolved technique utilizing pulsed lasers and measuring profiles of pressure in tissue).
OA microscopy: microscopy based on detection of an OA signal induced by a sharply focused laser beam.
OA spectroscopy: spectroscopy based on the detection of an OA signal induced by a monochromatic light source (laser) with tuned wavelength.
OA tomography: the tomography that is based on the OA method.
optode: a transducer that is attached to the distal tip of a fiber-optic sensor; the interaction between the optode and the body is monitored by the fiber-optic sensor.
optogeometric technique: the detection of surface deformation in solids and volume changes in fluids induced by an optothermal interaction.
optothermal interaction: the generation of heat waves by the interaction of pulsed or intensity-modulated optical radiation with a sample.
optothermal method: the detection of heat waves generated via interaction of pulsed or intensity-modulated optical radiation with a sample.
optothermal radiometry (OTR): the detection of time-dependent infrared thermal emissions induced by the optothermal interaction of light with a sample.
Ornstein-Zernice equation: an equation for the radial distribution function g(r ) of classical many-particle systems; thermodynamic properties of such systems are determined by the interaction between the particles from which the system is built up; if one knows the radial distribution function, one can calculate all thermodynamic properties of the considered system; light scattering properties of such systems also can be calculated.
osmotic phenomenon: the tendency of a fluid to pass through a semipermeable membrane into a solution where its concentration is lower, thus equalizing the conditions on either side of the membrane.
634 |
Glossary 1. Physics, Statistics, and Engineering |
osmotic pressure: the hydrostatic pressure produced by a solution in a space divided by a differentially permeable membrane due to a differential in the concentrations of a solute.
osmotic stress: the force that a dissolved substance exerts on a semipermeable membrane through which it cannot penetrate, when it is separated from a pure solvent by the membrane.
overtone: a sinusoidal component of a waveform of greater frequency than its fundamental frequency; the term is usually used in acoustics.
oxymetry: the measurement of tissue or blood oxygenation.
packing dimension: one of the most important notions of fractal dimension.
packing factor: the fraction of volume in a medium structure that is occupied by particles; it is dimensionless and always less than unity; for practical purposes, a medium structure is often determined by assuming that particles are rigid spheres.
packing function: an analytical expression for molecular (particle) overlap as a function of position; it can be calculated by means of Fourier transforms; overlap functions between pairs of symmetry elements can be combined to give a crystallographic packing function.
paraxial approximation: an approximation used in ray tracing of light through an optical system.
paraxial region: the region where paraxial rays, lying close to the axis of an optical system, propagate.
partial-coherence interferometry: see Doppler interferometry, dual-beam coherent interferometry, optical coherence interferometry (OCI).
partially-coherence tomography: see optical coherence tomography (OCT).
percolation: concerns the movement and filtering of fluids through porous materials; recent percolation theory, an extensive mathematical model of percolation, has brought new understanding and techniques to a broad range of topics in physics and materials science.
perfusion pump: a fluid propulsion system that provides, for instance, long-term controlled-rate delivery of drugs such as chemotherapeutic agents or analgesics.
permeability coefficient: permeability (P ) of molecules across a biological (cell) membrane can be expressed as P = KD/ x, where K is the partition coefficient, D is the diffusion coefficient, and x is the thickness of the membrane; the diffusion coefficient (D) is a measure of the rate of entry into the cell cytoplasm depending on the molecular weight or size of a molecule; K is a measure of the solubility of the substance in lipids; a low value of K describes a molecule like water that is not soluble in lipid.
Tissue Optics: Light Scattering Methods and Instruments for Medical Diagnosis |
635 |
perturbation method: a method used to find an approximate solution to a problem that cannot be solved exactly, by starting from the exact solution of a related problem; is applicable if the problem at hand can be formulated by adding a “small” term to the mathematical description of the exactly solvable problem; leads to an expression for the desired solution in terms of a power series in some “small” parameter that quantifies the deviation from the exactly solvable problem.
perovskite laser: a neodymium: yttrium aluminum perovskite laser (Nd:YAP); a laser using an yttrium-aluminum-perovskite crystal doped with neodymium as a lasing medium emitting on the wavelength λ = 1341 nm.
phantom: a standard experimental tissue model (see optical phantom).
phase-contrast microscopy (phase microscopy): a microscopy that translates the difference in the phase of light transmitted through or reflected by an object into the difference of intensity in the image.
phase-delay measurement device: see “cross-correlation” measurement device and heterodyne phase system.
phase function: see scattering phase function.
phase fluctuations of the scattered field: the fluctuations that are induced by different optical paths for different parts or time periods of a wavefront interacting with an inhomogeneous, generally dynamic medium.
phase lag: a phase shift relative to the incident light modulation phase.
phase object: an object that introduces the difference in phase of the light transmitted through or reflected by an object.
λ/4-phase plate: see optical retarder; a device that provides an optical phase shift of 90◦ (π/2 radians) or an optical path difference equal to a quarter of the wavelength; a thin plate of birefringent substance, such as calcite or quartz, is cut parallel to the optical axis of the crystal with a specific thickness that is calculated to give a phase difference of 90◦ (π/2 radians) between the emergent ordinary ray and the emergent extraordinary ray for light of a specified wavelength; quarterwave plates are usually constructed for the wavelengths of sodium light (589 nm); if the angle between the plane of polarization of light incident upon the plate and the optic axis of the plate is 45◦, then circularly polarized light is produced and emerges from the plate; if the angle is other than 45◦, elliptically polarized light is produced.
phase shift (phase difference): the difference in phase between two wave forms; the phase difference is measured by the phase angle between the waves: when two waves have a phase shift (difference) of 90◦ (or π/2 radians), one wave is at maximum amplitude when the other wave is at zero amplitude; with a phase difference of 180◦ (π radians), both waves have zero amplitude at the same time, but one wave is at a crest when the other wave is at a trough.
636 |
Glossary 1. Physics, Statistics, and Engineering |
phase or amplitude cancellation (phased array) method: the basis for this method is the interference of photon-density waves [see interference of photon density waves (intensity waves) and photon-density wave]; it uses either duplicate sources and a single detector or duplicate detectors and a single source so that the amplitude or phase characteristics can be nulled and the system becomes a differential.
phase plate: see λ/4-phase plate and optical retarder.
phased-array technique: a spectroscopic or imaging technique that utilizes the interference of photon density waves (intensity waves).
phonon: a quantized mode of vibration occurring in a rigid crystal lattice, such as the atomic lattice of a solid; the study of phonons is an important part of solid state physics, because phonons play a major role in many of the physical properties of solids, including a material’s thermal and electrical conductivities; in particular, the properties of long-wavelength phonons give rise to sound in solids—hence the name “phonon,” i.e., “voice” in Greek; in insulating solids, phonons are also the primary mechanism by which heat conduction takes place.
phosphorescence: luminescence that is delayed with respect to the excitation of a sample.
photoacoustic (PA) method: see optoacoustic (OA) method; the term PA primarily describes spectroscopic experiments with CW-modulated light and a photoacoustic cell.
photoacoustic microscopy (PAM): a microscopy utilizing the photoacoustic method and a photoacoustic cell for signal detection.
photobiochemical reaction: a chemical reaction in living matter that is induced by light.
photodetector: see optical detector.
photocathode: a cathode that has the property of emitting electrons when activated by light or other radiation.
photoconductive detector: a photodetector in which an electric potential is applied across the absorbing region and causes a current to flow in proportion to the irradiance if the photon energy exceeds the energy gap between the valence and the conduction band; for the visible wavelength range—cadmium sulfide, for IR— lead sulfide, silicon doped with arsenide (Si:As), and mercury-cadmium-telluride (HgCdTe) are used as photoconductive materials.
photoelasticity: stress-induced birefringence and dichroism of a medium.
photomechanical waves: see laser-generated stress waves.
photomultiplier [photomultiplying tube (PMT)]: an extremely sensitive detector of light and other radiation consisting of a tube in which the electrons released
Tissue Optics: Light Scattering Methods and Instruments for Medical Diagnosis |
637 |
by radiation striking a photocathode are accelerated to successive dynodes that release several electrons for each incident electron, greatly amplifying the signal obtainable from small quantities of radiation.
photon: a quantum of electromagnetic radiation, usually considered as an elementary particle that has its own antiparticle and that has zero rest mass and charge and a spin of 1.
photon absorption cross section: the ability of a molecule to absorb a photon of a particular wavelength and polarization; although the units are given as an area, it does not refer to an actual size area, at least partially because the density or state of the target molecule will affect the probability of absorption; quantitatively, the number dN of photons absorbed, between the points x and x + dx along the path of a light beam is the product of the number N of photons penetrating to depth x times the number ρ of absorbing molecules per unit volume times the absorption cross section σabs: dN/dx = −ρσabsN .
photon-correlation spectroscopy: a noninvasive method for studying the dynamics of particles on a comparatively large time scale; the implementation of the single-scattering regime and the use of coherent light sources are of fundamental importance in this case; the spatial scale of testing a colloid structure (an ensemble of biological particles) is determined by the inverse of the wave vector; quasielastic light scattering spectroscopy, spectroscopy of intensity fluctuations, and Doppler spectroscopy are synonymous terms related to dynamic light scattering.
photon-counting system: a system that makes use of a specific method of photoelectron signal processing and provides sequential detection of single photons; photomultipliers (PMT) or avalanche photodetectors (APD) are usually used for photon counting; the technique is applicable for detecting very weak signals.
photoelasticity: an experimental method to determine stress distribution in a material; unlike the analytical methods of stress determination, photoelasticity gives a fairly accurate picture of stress distribution even around abrupt discontinuities in a material; the method serves as an important tool for determining the critical stress points in a material and is often used for determining stress concentration factors in irregular geometries.
photon-density wave: a wave of progressively decaying intensity; microscopically, individual photons migrate randomly in a scattering medium, but collectively they form a photon-density wave at a modulation frequency that moves away from a radiation source.
photon diffusion coefficient: see diffusion coefficient.
photon (intensity) diffusion wave: see photon-density wave.
photon scattering cross section: the ability of a particle to scatter a photon of a particular wavelength and polarization; although the units are given as an area, it does not refer to an actual size area; quantitatively, the number dN of photons
638 Glossary 1. Physics, Statistics, and Engineering
scattered, between the points x and x + dx along the path of a light beam, is the product of the number N of photons penetrating to depth x times the number ρ of scattering particles per unit volume times the scattering cross section σsca: dN/dx = −ρσscaN .
photon shot noise: the noise caused by the irregularity of photoelectron emission; it induces random errors in a photoelectron measuring system; the mean square of photoelectron current fluctuation is defined by the average photocurrent i and the photodetector’s bandwidth BD : i2 = 2eiBD, where e is the charge of the electron; it is difficult to achieve the shot noise limit in practice.
photon transport: a process of photon travel in a homogeneous or inhomogeneous medium with possible macroinhomogeneities; a photon changes its direction due to reflection, refraction, diffraction, or scattering and can be absorbed by an appropriate molecule on its way.
photonic crystal: a periodic optical (nano)structure that affects the propagation of electromagnetic waves (EM) in the same way as the periodic potential in a semiconductor crystal affects the electron motion by defining allowed and forbidden electronic energy bands; the absence of allowed propagating EM modes inside the structures, in a range of wavelengths called a photonic band gap, gives rise to distinct optical phenomena, such as inhibition of spontaneous emission, high-reflecting omni-directional mirrors, and low-loss-waveguiding amongst others; since the basic physical phenomenon is based on diffraction, the periodicity of the photonic crystal structure has to be in the same length-scale as half the wavelength of the EM waves, i.e., 300 nm for photonic crystals operating in the visible part of the spectrum; photonic crystals occur in nature, including biological tissues.
photorefractive technique: the detection of refractive index gradients above and inside a sample using thermal blooming, thermal lensing, probe beam refraction, or interferometry and deflectometry.
photosensitizer: a substance that increases the absorption of another substance at a particular wavelength band.
photothermal flow cytometry: flow cytometry that uses photothermal detection abilities.
photothermal microscopy: microscopy based on the detection of the photothermal signal induced by a sharply focused laser beams.
photothermal radiometry (PTR): see optothermal radiometry (OTR).
picosecond: (psec) (ps)–l0−12 sec (s).
piezoceramics: a piezoelectric material that is used to make electromechanical sensors and actuators; lead zirconate titanate (PZT) ceramics are an example; there are several different formulations of the PZT compound, each with different electromechanical properties.
Tissue Optics: Light Scattering Methods and Instruments for Medical Diagnosis |
639 |
piezodeflector: a device for light beam deflection at certain audioor radiofrequencies using an acoustooptical effect.
piezo-driver: a device that uses the inverse piezoelectric effect in certain asymmetric crystals, which is obtained by applying a potential difference to a crystal; an alteration in the size of the crystal takes place.
piezoelectric transducer: a device that uses the piezoelectric effect in certain asymmetric crystals; the effect is obtained by applying external pressure to a crystal; positive and negative charges are produced on opposite faces of the crystal, giving rise to a potential difference between the faces; the potential difference operates in the opposite direction if tension is applied instead of pressure; this potential difference is the signal detected in a crystal microphone.
piezooptical coefficient: characterizes the efficiency of stress-induced birefringence and dichroism of a medium (see photoelasticity); indicates whether the material is good or not for stress sensors (piezoelectric transducer) and acoustooptical modulators.
PIN photodetector: a photodetector based on p-i-n semiconductor structure that has a fast response.
pixel: the smallest element of an image that can be individually displayed.
Planck curve (function): gives the intensity radiated by a blackbody as a function of frequency (or wavelength) for a definite body temperature; a blackbody is an object that absorbs all the electromagnetic energy that falls on the object, no matter what the wavelength of the radiation; the area under the curve increases as the temperature is increased (the Stefan-Boltzmann law); the peak in the emitted energy moves to the shorter wavelengths as the temperature is increased (Wien’s law).
Planck’s constant: (denoted as h) a physical constant that is used to describe the sizes of quanta; it plays a central role in the theory of quantum mechanics and is named after Max Planck, one of the founders of quantum theory; a closelyrelated quantity is the reduced Planck constant [also known as Dirac’s constant (h¯ = h/2π)]; Planck’s constant is also used in measuring energy emitted by light photons, such as in the equation E = hν, where E is energy, h is Planck’s constant, and ν is frequency.
Pockel’s cell: a piezoelectric crystal with two plane electrodes for applying an external electric field, placed between two crossed polarizers; the basis of its function is the linear electro-optical effect, which relates to a change in the refractive index of a crystal caused by an external electric field: the phase shift between ordinary and extraordinary rays linearly depends on the electrical field strength; the cell is widely used as an external laser or other light source intensity modulator, as well as an internal laser modulator for giant pulse Q-switching.
640 |
Glossary 1. Physics, Statistics, and Engineering |
point spread function (PSF): describes the response of an imaging system to a point source or point object; another commonly used term for the PSF is a system’s impulse response; the degree of spreading (blurring) of the point object is a measure for the quality of an imaging system; in functional terms it is the spatial domain version of the modulation transfer function; it is a useful concept in Fourier optics, electron microscopy and other imaging techniques such as 3D microscopy (i.e., confocal microscopy and fluorescence microscopy).
polarimetry: measurement of the polarization properties of light.
polarizability: the relative tendency of a charge distribution, like the electron cloud of an atom or molecule, to be distorted from its normal shape by an external electric field, which may be caused by the presence of a nearby ion or dipole; the electronic polarizability α is defined as the ratio of the induced dipole moment p of an atom to the electric field E that produces this dipole moment: p = αE.
polarization of light (polarized light): a state, or the production of a state, in which rays of light exhibit different properties in different directions; linear (plane): when the electric field vector oscillates in a single, fixed plane all along the beam, the light is said to be linearly (plane) polarized; elliptical: when the plane of the electric field rotates, the light is said to be elliptically polarized because the electric field vector traces out an ellipse at a fixed point in space as a function of time; circular: when the ellipse happens to be a circle, the light is said to be circularly polarized.
polarization anisotropy: an inequality of polarization properties along different axes.
polarization-gating techniques: techniques for selecting diffuse photon groups with different path lengths, in particular ballistic or least-scattering photons, based on their polarization properties; used in polarization-sensitive diffuse or coherence optical tomography and spectroscopy.
polarization optical spectroscopy: optical spectroscopy using polarizied light as a probe beam and/or detection of transmitted, scattered, or re-emitted polarized light.
polarization optical tomography: optical tomography using polarizied light as a probe beam and/or detection of transmitted, scattered, or re-emitted polarized light.
polarizer: a device, often a crystal or prism, that produces polarized light from unpolarized light.
polydisperse system: a disperse system (medium) with multiple values of characteristic parameters, such as an ensemble of scatterers with different sizes and refractive indices; a cataract eye lens is a good example of a polydisperse system, because it consists of dielectric balls (aggregated α-crystallins) with various refractive indices and radii dispersed in a homogeneous ground substance.
Tissue Optics: Light Scattering Methods and Instruments for Medical Diagnosis |
641 |
polydispersion: differently sized (and/or with different refractive indices) dispersed particles suspended in a solid, liquid, or gas.
polymer fiber: a fiber made from transparent polymer materials (see fiber).
polystyrene microspheres (beads): used for quality control, calibration, and sizing; widely used for cleanroom certification, filter testing, light-scattering experiments, tissue phantoms design, cell labeling, etc.; nanobeads ranging from 40 to 950 nm, microbeads ranging from 1.00 to 9.00 μm, and megabeads ranging from 10.0 to 175.0 μm are available on the market.
polyvinydene fluoride (PVDF): belongs to piezoelectric materials that are used to make electromechanical sensors and actuators.
porosity: a measure of the void spaces in a material, measured as a fraction, between 0–1.
potassium chromate (K2CrO4): the nonscattering, homogeneously absorbing liquid used for constructing phantoms.
power: the rate of energy delivery; it is normally measured in watts, that is, joules per second power-size distribution.
preamplifier: an electronic amplifier that precedes another amplifier to prepare an electronic signal for further amplification or processing.
pressure: the force per unit area applied on a surface in a direction perpendicular to that surface; pressure is scalar and has units of pascals, 1 Pa = 1 N/m2; pressure is transmitted to solid boundaries or across arbitrary sections of fluid normal to these boundaries or sections at every point.
pressure transient: the analysis of pressure changes over time.
probe beam: a light or laser beam used for an object or material probing.
probability: the relative frequency with which an event occurs or is likely to occur.
probability density function (probability density distribution): a function that describes the distribution of probability over the values of a variable.
propagation constant: the logarithmic rate of change, with respect to distance in a given direction, of the complex amplitude of any electromagnetic field component.
pulse laser: a laser that generates a single pulse or a set of pulses; a laser with Q-switching produces the so-called giant pulses, the mode-locked laser produces ultrashort pulses with a high repetition rate.
pump-beam (pulse): laser (light) beam (or pulse) used for the nonlinear material pumping or for interactions of the optical fields with matter in order to provide lasing or spectroscopy.
Q-switching: sometimes known as giant pulse formation, is a technique by which a laser can be made to produce a pulsed output beam; the technique allows the pro-
642 |
Glossary 1. Physics, Statistics, and Engineering |
duction of light pulses with extremely high (gigawatt) peak power, much higher than would be produced by the same laser if it is operating in a continuous wave mode; compared to mode-locking, Q-switching leads to much lower pulse repetition rates, much higher pulse energies, and much longer pulse durations; both techniques are sometimes applied at once.
quadrature mixer: an electronic device that mixes signals with different frequencies by the act of squaring.
quantum detection limit: the limit of detection that is defined by the quantum fluctuations of any light source, including a laser, associated with spontaneous emission and defined by the temperature of the medium that emits the light being detected; such fluctuations, as in the case of photon shot noise, cause the irregularity of photoelectron emissions hat induce random errors in a photoelectron measuring system; the mean square of photoelectron current fluctuations also is defined by the average photocurrent i and the photodetector’s bandwidth BD: i2 = 2eiBD, where e is the charge of electrons, but the average photocurrent I is proportional to the mean power of quantum fluctuations: it is also difficult to achieve the quantum detection limit in practice.
quantum dot: a semiconductor nanostructure that confines the motion of conduction band electrons, valence band holes, or excitons (bound pairs of conduction band electrons and valence band holes) in all three spatial directions; the confinement can be due to electrostatic potentials (generated by external electrodes, doping, strain and impurities), the presence of an interface between different semiconductor materials (e.g., in core-shell nanocrystal systems), the presence of the semiconductor surface (e.g., semiconductor nanocrystal), or a combination of these; a quantum dot has a discrete quantized energy spectrum; a quantum dot contains a small finite number (of the order of 1–100) of conduction band electrons, valence band holes, or excitons, i.e., a finite number of elementary electric charges.
quantum efficiency of the detector: the ratio of the number of electrons emitted by a photodetector to the number incident at the detector’s surface photons.
quantum flux: see intensity.
quantum yield: for a radiation-induced process quantum yield is the number of times that a defined event (usually a chemical reaction step) occurs per photon absorbed by the system; a measure of the efficiency with which absorbed light produces some effect; since not all photons are absorbed productively, the typical quantum yield is less than one; quantum yields greater than one are possible for photo-induced or radiation-induced chain reactions, in which a single photon may trigger a long chain of transformations; in optical spectroscopy, the quantum yield is the probability that a given quantum state is formed from the system initially prepared in some other quantum state; for example, a singlet to triplet transition quantum yield is the fraction of molecules that, after being photoexcited into a singlet state, cross over to the triplet state; the fluorescence quantum yield is defined as the ratio of the number of photons emitted to the number of photons absorbed.
Tissue Optics: Light Scattering Methods and Instruments for Medical Diagnosis |
643 |
quantum-well laser: a diode laser with a quantum-dimension heterostructure as a lasing medium; owing to a high gain, it has a high slope of the watt/ampere characteristic.
quasi-ballistic photons: photons that migrate within a scattering medium along trajectories that are close but not the same as for ballistic photons.
quasi-crystalline approximation: first introduced by Lax to break the infinite heirarchy of equations that results in studies of the coherent field in discrete random media; it simply states that the conditional average of a field with the position of one scatterer held fixed is equal to the conditional average with two scatterers held fixed; successful for a range of concentrations from parse to dense and for long and intermediate wavelengths.
quasi-elastic light scattering: see dynamic light scattering.
quasi-monochromatic wave: a wave that has a very narrow but nonzero frequency (or wavelength) bandwidth; it can be presented as a group of monochromatic waves with a slightly different wavelength.
quasi-Newton inverse algorithm: the algorithm for finding an extreme point; it builds up an approximation of the inverse Hessian of the function; it is often regarded as the most sophisticated for solving unconstrained problems.
quasi-ordered medium: a medium that has a structure very close to the ordered one but nevertheless is not completely ordered, which is caused by specific interactions between molecules and molecular structures; many of the natural media, including water and some living tissues, are examples of quasi-ordered media.
quasi-periodic (process, signal, function, fluctuations): almost periodic (process, signal, function, fluctuations); almost periodic, it is a property of dynamical systems that appear to retrace their paths through phase space, but not exactly.
radar graph: similar to line graphs, except that they use a radial grid to display data items; a radial grid displays scale value grid lines circling around a central point, which represents zero; higher data values are farther from the center point; the radar graph type gets its name because it resembles a radar screen; the radial grid is not circular but an equilateral polygon.
radial distribution function g(r ): the pair distribution function that is a statistical characteristic of the spatial arrangement of the scatterers; used to describe light scattering in a correlated disperse system.
radiance: see intensity, irradiance.
radiation dosimetry: the measurement or calculation of a radiation dose; the quantity of radiation absorbed by a given mass of material, especially tissue, is dependent upon the strength and distance of the light source and the duration of exposure.
radiation transfer equation (RTE): the integro-differential equation (the Boltzmann or linear transport equation), which is a balance equation describing the flow
644 |
Glossary 1. Physics, Statistics, and Engineering |
of particles (e.g., photons) in a given volume element that takes into account their velocity c, location r, and changes due to collisions (i.e., scattering and absorption).
radiation transfer theory (RTT): the theory based on the radiation transfer equation (RTE) allowing one to calculate light distributions in the scattering media with absorption.
radio frequency (RF): the part of the electromagnetic spectrum between about 106 and 109 Hz.
Raman amplifier: based on the stimulated Raman scattering (SRS) phenomenon, this process, as with other stimulated emission processes, allows all-optical amplification; optical fiber is almost exclusively used as the nonlinear medium for SRS, which is therefore characterized by a resonant frequency downshift of13 THz; the SRS amplification process can be readily cascaded, thus accessing essentially any wavelength in the fiber low-loss guiding window.
Raman scattering: the change in wavelength of light scattered while passing through a transparent medium; the collection of new wavelengths is characteristic for the molecular structure of the scattering medium and differs from the fluorescence spectrum in being much less intense and unrelated to an absorption band of the medium; the frequencies of new lines are combinations of the frequency of the incident light and the frequencies of the molecular vibrational and rotational transitions.
Raman shifter: a device based on stimulated Raman scattering phenomenon; typically 1st, 2nd, and 3rd Stokes components are induced by a nonlinear medium pumped by a laser whose wavelength should be shifted; for example, the optimum conversion in the Ba(NO3)2 crystal at pump with a Ti:Sapphire laser (815 to 900 nm) provides a 1047 cm−1 shift and extends the laser tuning range to 1300 nm; gaseous and liquid Raman cells are also available; however, among the most efficient Raman crystals suitable for a wide range of pumping pulse durations from picoseconds to nanoseconds; Ba(NO3)2, KGd(WO4)2, and BaWO4 are known.
Raman spectroscopy: a spectroscopic technique used in condensed matter (physics, chemistry, and biology) to study vibrational, rotational, and other lowfrequency modes in a system; it relies on inelastic scattering, or Raman scattering of monochromatic light, usually from a laser in the visible, near infrared, or near ultraviolet range; phonons or other excitations in the system are absorbed or emitted by the laser light, resulting in the energy of the laser photons being shifted up or down; the shift in energy gives information about the phonon modes in the system; infrared spectroscopy yields similar, but complementary, information.
random medium: a specific state of a nonuniform (inhomogeneous) medium characterized by the irregular spatial distribution of its physical properties, including its optical properties.
Tissue Optics: Light Scattering Methods and Instruments for Medical Diagnosis |
645 |
random phase screen (RPS): a specific state of a random medium characterized by random spatial variations of the refractive index, which induces corresponding variations in the phase shift of the optical wave transmitted through or reflected by the RPS.
raw experimental data: experimental data before processing.
Rayleigh-Debye theory (approximation): the theory that addresses the problem of calculating the scattering by a special class of arbitrarily shaped particles; it requires that the electric field inside the particle be close to that of the incident field and that the particle can be viewed as a collection of independent dipoles that are all exposed to the same incident field.
Rayleigh distribution: the probability distribution of a random variable x described by the probability density function p(x) = (x/a2) exp(−x2/2a2), x ≥ 0; p(x) = 0, x < 0; the distribution has a positive asymmetry; its mode is at the point
x = a; the mean value and variance are, respectively, equal to x = (π/2a) and
σ2 = (4 − π)a2/2.
Rayleigh-Gans theory (approximation): see Rayleigh-Debye theory (approximation).
Rayleigh (resolution) limit: the resolution of an optical device with a circular aperture is limited by the diffraction of light through that aperture; as the aperture increases in diameter, the diffraction spot gets smaller, which increases the resolution of the instrument; in the case of a circular aperture, the diffraction pattern has the shape of a disk surrounded by rings, which is called the Airy disk; if the images of two point sources of light overlap such that the centers of the images are closer than the radius of the Airy disk, the images are considered to be unresolvable; this definition can be written as: θ = 1.22λ/D, where θ is the minimum resolvable angular separation of the two objects, λ is the wavelength of the light, and D is the diameter of the aperture.
Rayleigh (scattering) theory: the theory that addresses the problem of calculating scattering by small particles (with respect to the wavelength of the incident light) when individual particle scattering can be described as if it is a single dipole, the scattered irradiance is inversely proportional to λ4 and increases as a6, and the angular distribution of the scattered light is isotropic.
reduced scattering coefficient: a lumped property incorporating the scattering
coefficient μs and the scattering anisotropy factor g: μs = μs(1 − g) [cm−1];
μs describes the diffusion of photons in a random walk of step size of 1/μs [cm] where each step involves isotropic scattering; this is equivalent to the description of photon movement using many small steps, 1/μs, which each involve only a partial (anisotropic) deflection angle if there are many scattering events before an absorption event, i.e., μa μs (diffusion regime, see diffusion approximation); μs is useful in the diffusion regime, which is commonly encountered when treating
646 |
Glossary 1. Physics, Statistics, and Engineering |
how visible and near-infrared light propagates through tissues (http://omlc.ogi.edu/ classroom/).
reflectance (reflection coefficient): the ratio of the intensity reflected from a surface to the incident intensity; it is a dimensional quantity.
reflecting spectroscopy: the spectroscopy that uses the light back-reflected (scattered) by an object for spectral analysis.
refraction: the change in direction of a ray of light, sound, heat, or the like, in passing obliquely from one medium into another in which its speed is different; the ability of the eye to refract entering light, forming on the retina; the determination of the refractive condition of the eye.
refractive index: see index of refraction.
refractive index mismatch: a difference in the index of refraction of two media in contact; a scattering medium that contains scattering particles whose index of refraction is mismatched relative to the index of refraction of the ground substance [see immersion medium (liquid) and immersion technique].
repetition rate: the number of pulses per second; the repetition rate is measured in hertz.
reproducibility: one of the main principles of the scientific method, and refers to the ability of a test or experiment to be accurately reproduced, or replicated, by someone else working independently.
resistor: a two-terminal electrical or electronic component that resists an electric current by producing a voltage drop between its terminals in accordance with Ohm’s law.
retarder: see optical retarder.
reverberation: the persistence of sound in a particular space after the original sound is removed; when sound is produced in a space, a large number of echoes build up and then slowly decay as the sound is absorbed by the walls and air, creating reverberation, or reverb.
Riccati-Bessel function: only slightly different from a spherical Bessel function, this function arises in the problem of scattering of electromagnetic waves by a sphere, known as Mie scattering.
root mean square (rms): a measure of dispersion in a frequency distribution, it is equal to the square root of the mean of the squares of the deviations from the arithmetic mean of the distribution.
rotational diffusion: the molecular rotational motion is usually only the rotational rocking near the equilibrium orientation; they depend on the interactions with their neighbors, and by jumping in time they are changing orientation; the energy of activation is required for changing the angle of orientation; the Brownian rota-
Tissue Optics: Light Scattering Methods and Instruments for Medical Diagnosis |
647 |
tional motion can be valid only for comparatively big molecules with the slow changing of orientation angles; in this case the differential character of rotational motion is valid and the rotational diffusion equation can be written; the interaction of molecules between each other can be considered as the friction foresees with the moment P proportional to the angle velocity , P = ξ , where ξ is the rotational coefficient of friction that can be connected with the rotational diffusion coefficient, DR = kT /ξ; in the case of a small macroscopic sphere with radius a, ξ = 8πa3η, where η is the coefficient of viscosity (http://aph.huji.ac.il/feldman/ diel/Diel_Lecture9.ppt).
rotational state (level): the particular pattern of energy levels (and hence of transitions in the rotational spectrum) for a molecule is determined by its symmetry: linear molecules (or linear rotors), symmetric tops (or symmetric rotors), spherical tops (or spherical rotors), and asymmetric tops; rotational spectroscopy (using microwave and/or Raman spectroscopic techniques) studies the absorption and emission electromagnetic radiation by molecules associated with a corresponding change in the rotational quantum number of the molecule.
scatterer: an inhomogeneity or a particle of a medium that refracts or diffracts light or other electromagnetic radiation; light is diffused or deflected as a result of collisions between the wave and particles of the medium; sometimes it is a rough surface or a random-phase screen, also called a scatterer.
scattering: the process in which a wave or beam of particles is diffused or deflected by collisions with particles of the medium it transverses.
scattering angle: related to a photon scattered by a particle so that its trajectory is deflected by a deflection (scattering) angle θ in the scattering plane and/or by the azimuthal angle of scattering ϕ in the plane perpendicular to the scattering plane.
scattering anisotropy factor: the amount of forward direction retained after a single scattering event; if a photon is scattered by a particle so that its trajectory is deflected by an angle θ, then the component of the new trajectory aligned in the forward direction is presented as cos θ; there is an average deflection angle, and the mean value of cos θ is defined as the anisotropy (http://omlc.ogi.edu/classroom/).
scattering coefficient: a particle with a particular geometrical size redirects incident photons into new directions and so prevents the forward on-axis transmission of photons, this process constitutes scattering; the scattering coefficient μs[cm−1] describes a medium containing many scattering particles at a concentration described as a volume density ρ[cm3]; the scattering coefficient is essentially the cross-sectional area σsca[cm−1] per unit volume of medium: μs = ρσsca (http:// omlc.ogi.edu/classroom/).
scattering indicatrix: an angular dependence of the scattered light intensity; for thin samples, the normalized scattering indicatrix is equal to the scattering phase function.
648 |
Glossary 1. Physics, Statistics, and Engineering |
scattering medium: a medium in which a wave or beam of its particles is diffused or deflected by collisions with particles.
scattering phase function: the function that describes the scattering properties of the medium and is, in fact, the probability density function for scattering in the direction s¯ of a photon traveling in the direction s¯; it characterizes an elementary scattering act: if scattering is symmetric relative to the direction of the incident wave, then the phase function depends only on the scattering the angle θ (angle between directions s¯ and s¯ ).
scattering plane: a plane defined by positions of a light source, a scattering particle, and a detector.
scattering spectrum: the spectrum of scattered light; it can be differential, measured, or calculated for a certain scattering angle, or integrated within an angle (field) of view of the measuring spectrometer.
second-harmonic generation (SHG): (also called frequency doubling) a nonlinear optical process in which photons interacting with a nonlinear material are effectively “combined” to form new photons with twice the energy, and therefore twice the frequency and half the wavelength of the initial photons; in the past several years, SHG has been extended to biological applications: to the imaging of molecules that are intrinsically second-harmonic-active in live cells, such as collagen, and for studying biological molecules by labeling them with second-harmonic- active tags, in particular as a means to detect conformational change at any site and in real time.
self-beating: the signal produced by photomixing the electric components of a scattered field.
semilogarithmic scale: for example, functions of the kind y = Be−ϕx are used to describe the attenuation of light intensity with distance x and may be plotted on a semilogarithmic scale; taking log10 of both sides gives log10 y = log10 B − ϕx log10 e = log10 B − 0.434ϕx; plotting log y vs x will therefore give a straight line of slope 0.434 × ϕ.
shear rate: the rate of shear deformation; for the ease of it is just a gradient of velocity.
shear stress: a stress state where the stress is parallel or tangential to a face of the material, as opposed to normal stress when the stress is perpendicular to the face; for a Newtonian fluid wall shear stress is proportional to shear rate, where the coefficient of proportionality is the viscosity of the fluid.
short-circuit: in electronics, a circuit with a load of an infinitely low resistance or impedance through which electric current flows.
shot noise: a type of electronic noise that occurs when the finite number of particles that carry energy, such as electrons in an electronic circuit or photons in an optical device, is small enough to give rise to detectable statistical fluctuations in
Tissue Optics: Light Scattering Methods and Instruments for Medical Diagnosis |
649 |
a measurement; it is important in electronics and photoelectronics; the strength of this noise increases with the average magnitude of the current or intensity of the light; often, however, as the signal increases more rapidly as the average signal becomes stronger, shot noise often is only a problem with small currents and light intensities.
Siegert formula: the formula that, for Gaussian statistics, relates the intensity autocorrelation function to the first-order autocorrelation function.
signal oscillator: used in heterodyne detecting systems for notation of the receiving signal, which can be presented as the radio- (or optical) frequency oscillator and has a slightly different frequency than that for the local oscillator [used for converting a high-frequency receiving signal to an intermediate frequency by mixing the local oscillator signal and receiving signal at an electronic (or photo-) detector].
signal-to-noise ratio: the ratio of a received (the detector) signal (an electric impulse) to noise (an electric disturbance in a measuring system that interferes with or prevents reception of a signal).
single-frequency laser: a laser that generates a single frequency (one longitudinal mode).
single-integrating sphere “comparison” technique: this technique uses a single integrating sphere containing no baffles but three ports that can be opened for light transmission, or closed or covered by a sample or reference standards for the calibration (comparison) of reflectance or transmittance measurements; an additional two ports are used to illuminate samples by a collimated light beam and collect the scattered light by a fiber bundle placed at the “north pole” of the sphere; this technique has an advantage over the conventional double integrating sphere technique in that no corrections are required for sphere properties.
single-mode fiber: a fiber in which only a single mode can be excited; for a fiber with a numerical aperture 0.1 and a wavelength of 633 nm the single mode can be excited if the core diameter is less than 4.8 μm.
single-mode fiber-optic Michelson interferometer: a Michelson interferometer integrated with a fiber-optic single-mode X-coupler, which optically connects a light source, reference mirror, object, and photodetector.
single-mode laser: a laser that produces a light beam with a Gaussian shape of the transverse intensity profile without any spatial oscillations (see Gaussian light beam); in general, such lasers generate many optical frequencies (so-called longitudinal modes), which have the same transverse Gaussian shape.
single-photon counting mode: see photon-counting system.
single scattering: the scattering process that occurs when a wave undertakes no more than one collision with particles of the medium in which it propagates.
650 |
Glossary 1. Physics, Statistics, and Engineering |
single scattering approximation: the approximation that assumes tissue is sufficiently thin that single scattering accurately estimates the reflection and transmission for the slab.
singlet state: one of the two ways in which the spin of two electrons in an atom or molecule can be combined in atomic physics, the other being a triplet state; a single electron has spin 1/2, and a pair of electron spins can be combined to form a state of total spin 1 (triplet state) and a state of spin 0 (singlet state); singlet state is an excited state of a molecule that, upon absorbing light, can release energy as heat or light (fluorescence) and thus return to the initial (ground) state; it may alternatively assume a slightly more stable, but still excited state (triplet state), with an electron still dislocated as before but with reversed spin.
singular eigenfunction method: the method for rigorous solving of the transport equation which is solved using the Green’s functions in terms of the singular eigenfunctions and their orthogonality relations together with the appropriate boundary conditions; the convergence of the numerical results is fast and the analytical expressions are simple for solving numerically.
small angular (angle) approximation: a useful simplification of the laws of trigonometry, which is only approximately true for finite angles, but correct in the limit as the angle approaches zero; it involves linearization of the trigonometric functions (truncation of their Taylor series); this approximation is useful in many areas of physical science, including optics, where it forms the basis of the paraxial approximation.
S-matrix: see LSM [light-scattering matrix (intensity or Mueller matrix)].
snake photons: photons that travel in near-forward paths, having undergone few scattering events, all of which are in the forward or near-forward direction; consequently, they retain the image bearing characteristics to some extent.
soft scattering particles: the refractive index of these particles, ns, is close to the refractive index of the ground (interstitial) substance, n0 (ns ≥ n0).
sonoluminescence: the emission of short bursts of light (luminescence) from imploding bubbles in a liquid when excited by sound.
sonophoresis: a process that exponentially increases the absorption of topical compounds (transdermal delivery) into the epidermis, dermis, and skin appendages; it occurs because ultrasound waves stimulate microvibrations within the skin epidermis and increase the overall kinetic energy of molecules making up topical agents; it is widely used in hospitals to deliver drugs through the skin; pharmacists compound the drugs by mixing them with a coupling agent (gel, cream, ointment) that transfers ultrasonic energy from the ultrasound transducer to the skin; the ultrasound probably enhances drug transport by cavitation, microstreaming, and heating; it is also used in physical therapy.
Tissue Optics: Light Scattering Methods and Instruments for Medical Diagnosis |
651 |
Soret band: a very strong absorption band in the blue region of the optical absorption spectrum of a haem protein.
spatial correlation: see correlation; valid for the spatial variables.
spatial frequency: a spatial harmonic in the Fourier transform of a periodic or aperiodic (random) spatial distribution.
spatial resolution: a measure of the ability of an optical imaging system to reveal the details of an image, i.e., to resolve adjacent elements.
spatially modulated laser beam: a laser beam with regular interference fringes or irregular speckle modulation.
spatially resolved reflectance technique (SRR): a technique that uses two or more fibers to illuminate an object and collect the back-reflected light; the positions of the illuminating and light-collecting fibers can be fixed or scanned along the object’s surface perpendicular or have some angle to the object’s surface.
specific heat capacity: also known simply as specific heat; an intensive quantity, meaning it is a property of the material itself, and not the size or shape of the sample; its value is affected by the microscopic structure of the material; commonly, the amount is specified by mass; for example, water has a mass-specific heat capacity of about 4186 joules per Kelvin per kilogram; volume-specific and molar-specific heat capacities are also used; the specific heat of virtually any substance can be measured, including pure elements, compounds, alloys, solutions, and composites.
speckle: a single element of a speckle structure (pattern) that is produced as a result of the interference of a large number of elementary waves with random phases that arise when coherent light is reflected from a rough surface or when coherent light passes through a scattering medium.
speckle contrast: see contrast of the intensity fluctuations.
speckle correlometry: a technique based on the measurement of the intensity autocorrelation function, characterizing the size and distribution of speckle sizes in a speckle pattern, caused, for example, by the scattering of a coherent light beam from a rough surface: the statistical properties of the scattering object’s structure can be deduced from such measurements.
speckle interferometry: the technique that uses the interference of speckle fields.
speckle photography: the measuring technique that uses a set of sequential photos of the speckle pattern taken at different moments or with different exposures: this is a full-field technique and can be used to study the dynamic properties of a scattering object (see LASCA); the updated instruments make use of computer-controlled CCD cameras for averaging and storing the speckle patterns.
speckle statistics of the first order: the statistics that define the properties of speckle fields at each point.
652 |
Glossary 1. Physics, Statistics, and Engineering |
speckle statistics of the second order: the statistics that show how fast the intensity changes from point to point in a speckle pattern, i.e., they characterize the size and the distribution of speckle sizes in the pattern.
speckle structure: see speckle.
Spectrolon: a very white reflective plastic used as the “white reference” in spectral measurements and in integrating sphere spectrometers.
spectrophotometry: the spectroscopic method and instrument for making photometric comparisons between parts of spectra.
spectroscopy: the science that deals with the use of the spectroscope and with spectrum analysis.
spectroscopy of intensity fluctuations: see photon-correlation spectroscopy.
spectrum: the range of frequencies or wavelengths.
spectrum analysis: to ascertain the number and character of the constituents combining to produce a signal spectrogram.
spectrum analyzer: an instrument for making the spectrum analysis of a signal.
specular: pertaining to or having the properties of a mirror.
spin: the angular momentum intrinsic to a body; in classical mechanics, the spin angular momentum of a body is associated with the rotation of the body around its own center of mass; in quantum mechanics, spin is particularly important for systems at atomic length scales, such as individual atoms, protons, or electrons; such particles and the spin of quantum mechanical systems (“particle spin”) possesses several nonclassical features, and for such systems, spin angular momentum cannot be associated with rotation but instead refers only to the presence of angular momentum.
standard deviation: see rms (root mean square).
statistics: a mathematical science pertaining to the collection, analysis, interpretation or explanation, and presentation of data; it is applicable to a wide variety of academic disciplines.
statistical approach: an approach based on statistics as a mathematical science.
statistically significant: a result is called significant if it is unlikely to have occurred by chance; “a statistically significant difference” simply means there is statistical evidence that there is a difference; the significance of a result is also called its p-value; the smaller the p-value, the more significant the result is said to be; popular levels of significance are 5%, 1%, and 0.1%.
stepper motor: a machine that converts electrical energy into mechanical energy by steps; used as the computer-controlled mechanical drivers of optical stages.
Tissue Optics: Light Scattering Methods and Instruments for Medical Diagnosis |
653 |
stimulated Raman scattering (SRS): a phenomenon that occurs when a lower frequency “signal” photon induces the inelastic scattering of a higher-frequency “pump” photon in a nonlinear optical medium; as a result, another “signal” photon is produced, with the surplus energy resonantly passed to the vibrational states of the nonlinear medium; this process is the basis for the Raman amplifier.
Stokes parameters: the four numbers I , Q, U , and V representing an arbitrary polarization of light; I refers to the irradiance or intensity of the light; the parameters Q, U , and V represent the extent of horizontal linear, 45◦ linear, and circular polarization, respectively.
Stokes-Raman scattering: the energy of the Raman scattered photons is lower than the energy of the incident photons.
Stokes shift: the difference (in wavelength or frequency units) between positions of the band maxima of the absorption and luminescence spectra (or fluorescence) of the same electronic transition; when a molecule or atom absorbs light, it enters an excited electronic state; the Stokes shift occurs because the molecule loses a small amount of the absorbed energy before re-releasing the rest of the energy as fluorescence, depending on the time between the absorption and the reemission; this energy is often lost as thermal energy.
Stokes vector: the vector formed by the four Stokes parameters.
Stokes wave: the induced (scattered) wave that has a frequency less than the frequency of the incident radiation.
streak camera (synchroscan streak camera): an instrument for recording the temporal profile of light intensity with a high time resolution (of about 10 ps), displaying it as a spatial profile; synchronous scanning controlled by a reference (trigger beam) light pulse is provided.
stress: internal distribution of force per unit area that balances and reacts to external loads applied to a body; stress is a second-order tensor with nine components, but can be fully described with six components due to symmetry in the absence of body moments; stress is often broken down into its shear and normal components as these have unique physical significance; stress can be applied to solids, liquids, and gases; static fluids support normal stress (hydrostatic pressure) but will flow under shear stress; moving viscous fluids can support shear stress (dynamic pressure); solids can support both shear and normal stress, with ductile materials failing under shear and brittle materials failing under normal stress; all materials have temperature dependent variations in stress related properties, and non-Newtonian materials have rate-dependent variations.
stress amplitude: the value of a stress.
stress distribution: stress is a second-order tensor with nine components.
structure function: the function that describes the second-order statistics of a random process and is proportional to the difference between values of the autocorre-
654 |
Glossary 1. Physics, Statistics, and Engineering |
lation function for zero and arbitrary values of the argument; the structure function is more sensitive to small-scale oscillations.
subject arm of an interferometer: the arm on which an object under study is placed.
subjective speckles: the speckles produced in the image space of an optical system (including an eye).
superluminescent diode: a very bright diode light source with a broad linewidth; it is usually manufactured using a laser diode technology (heterostructure, waveguide, etc.), but without reflecting mirrors (there is an antireflection coating at the diode faces or their out-of-parallelism is provided).
surface-enhanced Raman scattering (SERS): a strong increase in Raman signals from molecules if those molecules are attached to submicron metallic structures; for a rough surface due to excitation of electromagnetic resonances by the incident radiation, such enhancement may be of a few orders; both the excitation and Raman scattered fields contribute to this enhancement; thus, the SERS signal is proportional to the fourth power of the field enhancement factor.
surface plasmon resonance: also known as surface plasmon polaritons, surface plasmon resonances are surface electromagnetic waves that propagate parallel to a metal/dielectric interface; for electronic surface plasmons to exist, the real part of the dielectric constant of the metal must be negative, and its magnitude must be greater than that of the dielectric; this condition is met in the visible-IR wavelength region for air/metal and water/metal interfaces (where the real dielectric constant of a metal is negative and that of air or water is positive); the excitation of surface plasmons by light is denoted for planar surfaces as for nanometer-sized metallic structures which is called localized surface plasmon resonance; typical metals that support surface plasmons are silver and gold, but metals such as copper, titanium, or chromium can also support surface plasmon generation; surface plasmons have been used to enhance the surface sensitivity of several spectroscopic methods, including fluorescence, Raman scattering (see surface-enhanced Raman scattering), and second harmonic generation.
symmetric molecule: refers to molecular geometry; molecules have fixed equilibrium geometries—bond lengths and angles—about which they continuously oscillate through vibrational and rotational motions; a symmetric molecule contains identical bonds; for example, trigonal planar, tetrahedral and linear bonding arrangements often lead to symmetrical, nonpolar molecules that contain polar bonds.
symmetric vibrational mode: for example, a moving linear triatomic molecule being in a movement, when each atom oscillates or vibrates along a line connecting them, may be in symmetric or antisymmetric vibrational mode relative to a central atom.
Tissue Optics: Light Scattering Methods and Instruments for Medical Diagnosis |
655 |
systematic errors: the errors caused by finite tissue volume, curved surfaces, tissue inhomogeneity when scanning, finite source and detection size, uncertainty in their relative positions, etc.; they can be much larger than random errors induced by a shot noise.
swept-laser source: a rapidly tunable laser over a broad optical bandwidth.
tensor: a tensor has slightly different meanings in mathematics and physics; in the mathematical fields of multilinear algebra and differential geometry, a tensor is a multilinear function; in physics and engineering, the same term usually means what a mathematician would call a tensor field: an association of a different (mathematical) tensor with each point of a geometric space, varying continuously with position; in the field of diffusion tensor imaging, for instance, a tensor quantity that expresses the differential permeability of organs to water in varying directions is used to produce scans of the brain; perhaps the most important engineering examples are the stress tensor and strain tensor, which are both second-rank tensors, and are related in a general linear material by a fourth-rank-elasticity tensor; the rank of a particular tensor is the number of array indices required to describe such a quantity.
therapeutic (or diagnostic) window: the spectral range from 600 to 1600 nm within which the penetration depth of light beams for most living tissues and blood is the highest; certain phototherapeutic and diagnostic modalities take advantage of this range for visible and NIR light.
thermal blooming: a major effect in high-power laser beams transmitting through gaseous mediums as well as the atmosphere; due to this nonlinear heating effect, the beam pattern is deformed through the propagation path.
thermal diffusivity: the ratio of heat (thermal) conductivity to volumetric heat capacity in heat transfer analysis; expressed in units of m2 s−1.
thermal expansion coefficient: the energy that is stored in the intermolecular bonds between atoms changes during heat transfer; when the stored energy increases, so does the length of the molecular bond; as a result, solids typically expand in response to heating and contract on cooling; this response to temperature change is expressed as its coefficient of thermal expansion; the coefficient of thermal expansion is used in two ways: as a volumetric thermal expansion coefficient (liquids and solid state) and as a linear thermal expansion coefficient (solid state).
thermal image: pictures created by heat, received by a thermal imager, rather than light; it measures radiated IR energy and converts the data to corresponding maps of temperatures; instruments provide temperature data at each image pixel; images may be digitized, stored, manipulated, processed, and printed out.
thermal length: the length of thermal diffusivity that chacterizes the distance in a medium where heat is diffused during the heating laser pulse.
656 |
Glossary 1. Physics, Statistics, and Engineering |
thermal lensing: the virtual lens that is induced in a transparent material by its local heating, particularly by laser beam absorption; the local changes in the refractive index of a sample induce such a lens for some period; such an effect can be used to estimate tissue optical and thermal properties if a probing laser beam is applied.
thermal relaxation time: the time to dissipate the heat absorbed during a laser pulse.
thermoelastic effect: the generation of mechanical stress (acoustic) waves via the time-dependent thermal expansion of a sample.
third harmonic generation: if a narrow-band optical wave pulse at a frequency ω propagates through a nonlinear medium with a nonzero Kerr nonlinear susceptibility χ (3) due to nonlinearity, one will get a signal at a frequency 3ω (see second harmonic generation).
three-photon fluorescence microscopy: the microscopy that employs both ballistic and scattered photons at the wavelength of the third harmonic of incident radiation; it possesses the same advantages as two-photon fluorescence microscopy but ensures a somewhat higher spatial resolution and provides an opportunity to excite chromophores with shorter wavelengths.
time-correlated single-photon counting technique: the time-resolved singlephoton counting method and instrument (see photon-counting system) used for receiving low-intensity light pulses.
time-dependent radiation transfer theory (RTT): the theory that is based on the time-dependent integro-differential equation (the Boltzmann or linear transport equation), which is a balance equation describing the time-dependent flow of particles (e.g., photons) in a given volume element that takes into account their velocity c, location r¯ , and changes due to collisions (i.e., scattering and absorption).
time-domain technique: a spectroscopic or imaging technique that uses ultrashort laser pulses.
time-gating: a method for selecting photon groups with different arriving times to a detector within a selected and moveable time window; used in diffuse optical tomography and spectroscopy; may be purely electrical or optical, or a combination of both.
time-of-flight: the mean time of photon travel between two points that account for refractive index and scattering properties of the medium.
time-share control: the regime that ensures that, at one time, an optical signal of only one wavelength passes through the whole system.
tissuelike phantom: see phantom.
tissue optical parameters (properties) control: any kind of physical or chemical action, such as mechanical stress or changes in osmolarity, which induces re-
Tissue Optics: Light Scattering Methods and Instruments for Medical Diagnosis |
657 |
versible or irreversible changes in the optical properties of a tissue [see immersion medium (liquid), immersion technique, matching substance, and mechanical stress].
TOAST (time-resolved optical absorption and scattering tomography): an image reconstruction package developed at University College London that employs a finite-element-method-forward model and an iterative reconstruction algorithm.
tomographic reconstruction: the mathematical procedure of obtaining 3D images by which the size, shape, and position of a hidden object can be determined.
tomography: imaging by sections or sectioning (the Greek word tomos, meaning “a section” or “a cutting”); a device used in tomography is called a tomograph, while the image produced is a tomogram; the method is used in medicine, biology, and other sciences; in most cases it is based on the mathematical procedure called tomographic reconstruction; there are many different types of tomography, including functional magnetic resonance imaging (fMRI), magnetic resonance imaging (MRI), optical coherence tomography (OCT), optical projection tomography (OPT), positron emission tomography (PET), single photon emission computed tomography (SPECT), x-ray tomography.
total internal reflection: the reflection of light at the interface between media of different refractive indexes, when the angle of incidence is larger than a critical angle (determined by the media).
transfer matrix method: this method assumes that light consists of various plane waves traveling with oblique angles through the sample; the latent bulk image is obtained by first calculating the vertical amplitude dependence of the field, resulting from the excitation with one plane wave of definite amplitude; it is is applicable for the analysis of a stratified medium; using the vector version of the transfer matrix algorithm, an arbitrarily polarized light can be simulated.
transillumination digital microscopy (TDM): the light transillumination microscopy based on the usage of fast and high resolution CCD cameras and corresponding software; it is applicable for in vivo flow cytometry.
transition matrix (T-matrix) approach: this approach is similar to the Mie theory used for nonspherical objects such as spheroids; the T-matrix for the spherical particles is diagonal.
transmittance: the ratio of the intensity transmitted through a sample to the incident intensity; it is a dimensionless quantity.
trigger beam: the part of a laser beam used to synchronize the measuring system (for example, the streak camera).
triplet state: see singlet state.
t -test (Student’s t -test): a test for determining whether an observed sample mean differs significantly from a hypothetical normal population mean.
658 |
Glossary 1. Physics, Statistics, and Engineering |
tunable laser: most lasers emit at a particular wavelength; in tunable lasers, one can vary the wavelength over some limited spectral range.
turbidity: a cloudiness or haziness of material (biological fluid or tissue), caused by individual particles (suspended scatterers) that are generally invisible to the naked eye, thus being much like milk.
turbulent flow: a flow regime characterized by chaotic, stochastic property changes; this includes low-momentum diffusion, high-momentum convection, and rapid variation of pressure and velocity in space and time; flow that is not turbulent is called laminar flow; the dimensionless Reynolds number characterizes whether flow conditions lead to laminar or turbulent flow; e.g., for pipe flow, a Reynolds number above about 2300 will be turbulent.
two-frequency Zeeman laser: a laser with the active medium placed in the axial magnetic field; the laser produces two laser lines with a small frequency separation (about 250 kHz) and mutually orthogonal linear polarizations.
two-photon fluorescence microscopy: the microscopy that employs both ballistic and scattered photons at the wavelength of the second harmonic of incident radiation coming to a wide-aperture photodetector exactly from the focal area of the excitation beam.
ultrashort laser pulse: the pulses usually produced by mode-locked lasers (picosecond and subpicosecond range) or their modifications, such as synchronously optically pumped or colliding-pulse mode-locked dye (CPM laser) lasers (femtosecond range), or the titanium-sapphire laser with passive mode locking via a Kerr lens (KLM laser) (10–100 fs).
ultrasonic transducer: a device that converts energy into ultrasound; refers to a piezoelectric transducer that converts electrical energy into sound; alternative methods for creating and detecting ultrasound include magnetostriction and capacitive actuation; it is used in many applications including medical ultrasonography, and nondestructive testing.
ultrasound: mechanical vibrations with frequencies in the range of 2 × 10⁴ to 107 Hz.
uniaxial crystal: an anisotropic crystal that exhibits two refractive indices: an “ordinary” index (no) for light polarized in the x or y directions, and an “extraordinary” index (ne) for polarization in the z direction; a uniaxial crystal is “positive” if ne > no and “negative” if ne < no; light polarized at some angle to the axes will experience a different phase velocity for different polarization components and cannot be described by a single index of refraction; this is often depicted as an index ellipsoid.
variance: the square of the standard deviation.
vector RTT: radiation transfer theory (RTT) accounting for the polarization properties of light and its interaction with a scattering medium.
Tissue Optics: Light Scattering Methods and Instruments for Medical Diagnosis |
659 |
vibrational spectrum: see vibrational transition.
vibrational transition: denotes an energetic transition of a molecule with the change of vibrational quantum number (energetic state, or level); at vibrational transitions, only the absorption or emission of infrared light (vibrational spectrum) is possible.
vibronic spectrum: see vibronic transition.
vibronic transition: denotes the simultaneous change of a vibrational and electronic quantum number (energetic state or level) in a molecule; according to the separability of electronic and nuclear motion in the Born-Oppenheimer approximation, the vibrational transition and electronic transition may be described separately; the selection rule for vibrational transitions is described by the FranckCondon principle; most processes lead to the absorption and emission of relatively broad bands of visible light (vibronic spectra), resulting in the colorful world around us.
vibrometer: an instrument that measures amplitudes and frequencies of the mechanical vibrations of an object.
viscosity of the medium: viscosity arises from the friction between one layer of a fluid in motion relative to another layer of the fluid; it is caused by the cohesive forces between molecules; the viscosity of glycerol is high, but the viscosity of water or ethanol is low.
volume fraction: a fraction dealing with mixtures in which there is a large disparity between the sizes and refractive indices of the various kinds of molecules or particles; it provides an appropriate way to express the relative amounts of the various components; in any ideal mixture, the total volume is the sum of the individual volumes prior to mixing; in nonideal cases the additivity of volume is no longer guaranteed; volumes can contract or expand upon mixing and molar volume becomes a function of both concentration and temperature; this is why mole fractions are a safer unit to use.
waist of a laser beam: the narrowest part of a Gaussian beam.
water-binding mode: denotes biological molecule interaction with water molecules and corresponding changes in molecular-water complex spectra.
watt: a unit of power; one watt is equal to one joule per second.
wavelength: distance between two adjacent peaks in a wave.
wavelet transformation: the representation of a signal in terms of scaled and translated copies (known as “daughter wavelets”) of a finite length or fast decaying oscillating waveform (known as the “mother wavelet”); in formal terms, this representation is a wavelet series that is a representation of a square-integrable (real or complex valued) function by a certain orthonormal series generated by a wavelet.
660 |
Glossary 1. Physics, Statistics, and Engineering |
weakly scattering RPS: the RPS whose variance in induced-phase fluctuations in the scattered field is much less than unity.
Wigner phase space distribution function: the complex function that defines the coherence property of an optical field for a given position depending on the wave vector.
white noise: a random signal (or process) with a flat power spectral density; the signal’s power spectral density has equal power in any band, at any center frequency, having a given bandwidth; white noise is considered analogous to white light, which contains all frequencies.
Wollaston prism: an optical device invented by William Hyde Wollaston that manipulates polarized light; it separates randomly polarized or unpolarized light into two orthogonal, linearly polarized outgoing beams; a prism consists of two orthogonal calcite prisms cemented together on their base (typically with Canada balsam) to form two right triangle prisms with perpendicular optic axes; outgoing light beams diverge from the prism, giving two polarized rays, with the angle of divergence determined by the prisms’ wedge angle and the wavelength of the light; commercial prisms are available with divergence angles from 15◦ to about 45◦.
xenon arc lamp: a discharge arc lamp filled with xenon; it gives out very bright UV and visible light in the range from 200 nm to >1.0 μm.
x ray (or Röntgen rays): a form of electromagnetic radiation with a wavelength in the range of 10 to 0.01 nm; primarily used for diagnostic radiography and crystallography; it is a form of ionizing radiation and can be dangerous.
zigzag or snake photons: low-angle scattered photons having zigzag (or snake) trajectories.
ZnSe crystal: a crystal for ATR (attenuated total reflectance) spectroscopy; insoluble with a refractive index of 2.4, a long-wavelength cut-off frequency of 525 cm−1, a depth of penetration at 1000 cm−1 of 1.66 μm, and a pH range of samples under study of 5–9.
z-scan: see A-scan.
Sources
This glossary was compiled using mostly Refs. 1–7, 25, 40, 75, 87, 129, 130, 132, 135, 136, and the following sources:
1.Webster’s New Universal Unabridged Dictionary, Barnes & Noble Books, New York, 1994.
2.A. Godman and E. M. F. Payne, Longman Dictionary of Scientific Usage, reprint edition, Longman Group, Harlow, UK, 1979.
Tissue Optics: Light Scattering Methods and Instruments for Medical Diagnosis |
661 |
3.A. M. Prokhorov (ed.), Physical Encyclopedic Dictionary, Soviet Encyclopedia, Moscow, 1983.
4.A. M. Prokhorov (ed.), Physical Encyclopedia, vol. 1, Soviet Encyclopedia, Moscow, 1988.
5.A. M. Prokhorov (ed.), Physical Encyclopedia, vol. 2, Soviet Encyclopedia, Moscow, 1990.
6.A. M. Prokhorov (ed.), Physical Encyclopedia, vol. 3, Big Russian Encyclopedia, Moscow, 1992.
7.A. M. Prokhorov (ed.), Physical Encyclopedia, vol. 4, Big Russian Encyclopedia, Moscow, 1994.
8.http://en.wikipedia.org