


490 |
Polarization-Sensitive Techniques |
similar to that proposed by Jacques et al.383 for the polarization-sensitive detection of backscattered light (see Section 7.1.2) and is connected with that near the absorber edge; the degree of polarization may be approximately doubled in value (for a highly scattering media) because no I photons are scattered into the shadowedge pixels by the shadow region, while I photons are directly scattered into these pixels. Better quality of the shadow images of the object is obtained with the use of the polarization imaging technique in comparison with conventional transillumination.
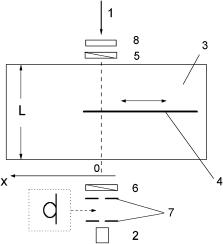
Figure 7.1 Scheme of the experimental setup for transillumination polarization imaging.1139 1, Linearly polarized beam of He:Ne laser (633 nm); 2, detector; 3, glass tank filled by scattering medium (diluted milk); 4, absorbing half-plane; 5, polarizer; 6, analyzer; 7, collimating diaphragms or light-collecting optical fiber; 8, chopper.
7.1.2 Backscattering polarization imaging
The principle of polarization discrimination of multiply scattered light has been
fruitfully explored by many research groups in morphological analysis and visualization of subsurface layers in strongly scattering tissues.129,135,136,138,376,378,379, 382,383,1139–1143,1147 One of the most popular approaches to polarization imaging
in heterogeneous tissues is based on using linearly polarized light to irradiate the object (the chosen area of the tissue surface) and to reject the backscattered light with the same polarization state (copolarized radiation) by the imaging system. Typically, such polarization discrimination is achieved simply by placing a polarizer between the imaging lens and the object. The optical axis of the polarizer is oriented perpendicularly to the polarization plane of the incident light. Thus, only the cross-polarized component of the scattered light contributes to the formation of the object image. Despite its simplicity, this technique has been demonstrated to be an adequately effective tool for functional diagnostics and for the imaging of
Tissue Optics: Light Scattering Methods and Instruments for Medical Diagnosis |
491 |
(a)
(b)
Figure 7.2 Experimental dependencies of (a) the normalized intensity and (b) degree of linear polarization of transmitted light on the absorbing half-plane edge position at different concentrations of the background scattering medium (diluted milk).1139
subcutaneous tissue layers. Moreover, the separate imaging of an object with copolarized and cross-polarized light permits separation of the structural features of the shallow tissue layers (such as skin wrinkles, the papillary net, etc.) and the deep layers (such as the capillaries in derma). The elegant simplicity of this approach has stimulated its widespread application in both laboratory and clinical medical diagnostics.
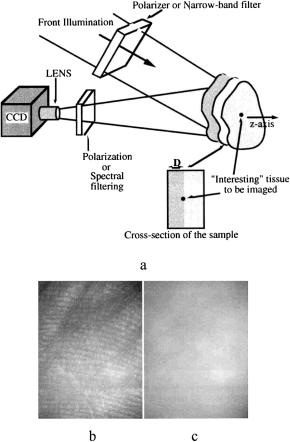
A typical scheme of instrumentation for polarization imaging using the ap-
proach discussed above is presented in Fig. 7.3. In the imaging system developed by Demos et al.,1141 a dye laser with Nd:YAG laser pumping is used as the illu-
mination source. The probe beam diameter is 10 cm and the average intensity is
492 |
Polarization-Sensitive Techniques |
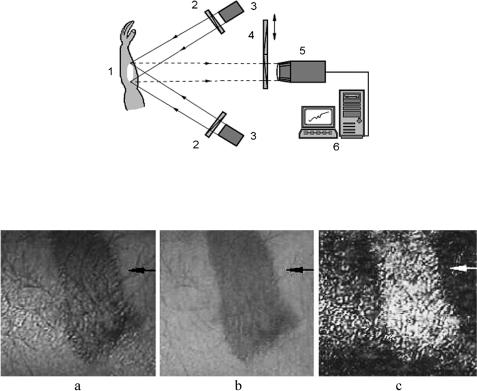
Figure 7.3 (a) An instrument for selective polarization or spectral imaging of subsurface tissue layers; (b) copolarized and (c) cross-polarized images of the human palm at 580-nm polarized laser light illumination.1141
approximately equal to 5 mW/cm2. A cooled CCD camera with a 50-mm focal length lens is used to detect back-reflected light and to capture the image. The first polarizer, placed after the beam expander, is used to ensure illumination with linearly polarized light. A second polarizer is positioned in front of the CCD camera with its polarization orientation perpendicular or parallel to that of the illumination.
The efficiency of selective polarization imaging is illustrated in Fig. 7.3, where the copolarized and cross-polarized images of a human palm are presented. Figure 7.3(b) illustrates surface imaging (copolarized), where the superficial skin papillary pattern is clearly seen. Figure 7.3(c) illustrates subsurface skin imaging (cross-polarized image).
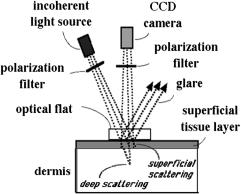
A similar camera system, but one that uses an incoherent white light source such as a xenon lamp, is described in Refs. 36, 383, and 1144, where results of a pilot clinical study of various skin pathologies using polarized light are presented. The image-processing algorithm used is based on the evaluation of the degree of
494 |
Polarization-Sensitive Techniques |
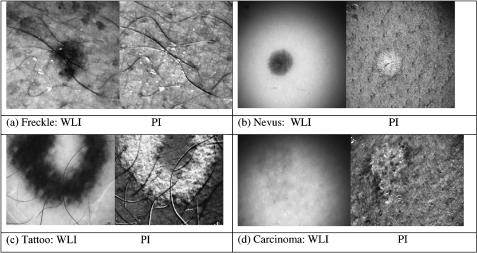
Figure 7.5 Comparison of white light (WLI) versus polarization (PI) images.383 (a) A freckle; the polarization image removes the melanin from a freckle. (b) A benign pigmented nevus; the polarization image removes the melanin and shows apparent scatter, the drop of polarized light reflectance from epidermis lining the hair follicles is seen. (c) Tattoo; the polarization image lightens the “blackness” of the tattoo, specular reflectance of polarized light off the carbon particles yields a strong image. (d) Malignant basal cell carcinoma; the white light image underestimates the extent of the skin cancer.
Comparative analysis of polarization images of normal and diseased human skin has shown the ability of the above approach to emphasize image contrast based on light scattering in the superficial layers of the skin. The polarization images can visualize disruption of the normal texture of the papillary and upper reticular layers caused by skin pathology. Polarization imaging can be considered as an adequately effective tool for identifying skin cancer margins and for guiding surgical excision of skin cancer [see Fig. 7.5(d)]. Various modalities of polarization imaging are also considered in Ref. 1145.
The evaluation of the quality of the polarization images is based on the presen-
tation of multiply scattered light as a superposition of partial contributions characterized by different values of the optical paths s in the scattering medium.135,1143
The statistical properties of the ensemble of partial contributions are described by the probability density function of the optical paths ρ(s), whereas the statistical moments of the scattered light are represented by the integral transforms of ρ(s) with the properly chosen kernels. The degree of polarization of multiply scattered radiation with initial linear polarization can be approximately represented in the
form of the Laplace transform of ρ(s) as |
∞ exp − |
ξL ρ(s)ds, |
|
||||||
PL = III |
− I ≈ |
2 |
0 |
(7.2) |
|||||
|
III |
+ |
3 |
|
|
s |
|
|
|
|
I |
|
|
|
|
||||
Tissue Optics: Light Scattering Methods and Instruments for Medical Diagnosis |
495 |
where III and I are, respectively, the intensities of the copolarized and crosspolarized components of the scattered light. The parameter ξL is the depolarization length for linearly polarized light.
By considering the polarization visualization of the absorbing macroheterogeneity, along with the degree of polarization of backscattered light as the visualization parameter, the contrast of the polarization image can be defined as135
V |
|
PLin − PLback |
, |
(7.3) |
|
P = PLin + PLback |
|||||
|
|
|
|||
where PLin is the degree of residual linear polarization of the backscattered light detected in the region of the localization of the heterogeneity and PLback is the analogous quantity determined far from the region of localization. The contrast VP of the reconstructed polarization image can be represented as a function of the scattering layer thickness l, the depth of inhomogeneity position h, the transport mean free path lt of the scattering medium, the scattering anisotropy factor g, and the depolarization length ξL.135 The probability density function of the optical paths ρ(s) can be obtained by a Monte Carlo simulation.
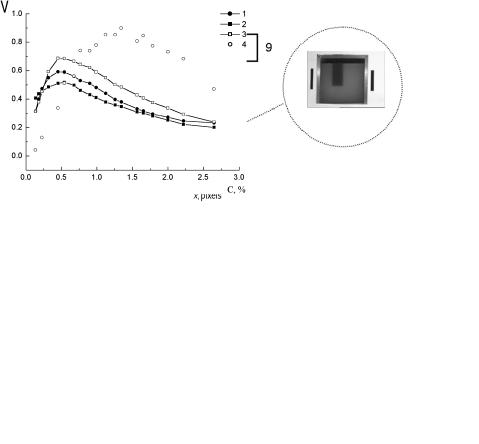
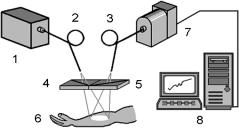
To compare the efficiency of the various polarization imaging modalities, the experimental setup shown in Fig. 7.6 was used.1139 The total normalized intensity (the intensity of the copolarized and cross-polarized components) or the degree of residual linear polarization of the backscattered light were taken as the visualization parameters. A scattering medium (a water-milk emulsion) in a rectangular glass tank (18 × 26 × 26 cm) was used as a tissue model. The side and rear walls of the tank were blackened. The absorbing object (a rectangular plate with blackened rough surfaces) was positioned in the central part of the tank at different distances h (1 to 4 cm) from the transparent front wall. The white light probe was linearly polarized perpendicular to the plane of incidence. To avoid specular reflection from the front wall of the tank, the illuminating beam was directed at an angle of 30 deg relative to the normal to the wall.
The capture of the object images for each of three chromatic coordinates (R, G, and B) was done using a color CCD camera (Panasonic NV-RX70EN) and a Miro DC20 frame grabber (MiroVideo, Germany). The color 8-bit images of the object were captured with 647 × 485 resolution with the use of copolarized and crosspolarized backscattered light. The brightness distributions for each of the R, G, and B image components along an arbitrarily chosen line of the image [Fig. 7.6(b)] are applied to reconstruct the images of the absorbing heterogeneity with different visualization parameters [Fig. 7.6(c)]. In the absence of a scattering medium and, hence, the backscattered radiation, the image contrast is equal to zero. An increase in the milk concentration results first in a sharp increase in the image contrast up to the maximum value, with the subsequent monotonic decrease caused by the
increase of scattering multiplicity.
Comparison of the experimental data and the MC simulations135,1139,1143 allows one to conclude that maximal contrast in the polarization image is obtained at
496 |
Polarization-Sensitive Techniques |
(a)
(b) |
(c) |
Figure 7.6 Polarization imaging experiment.1139 (a) Schematic diagram: 1, a cell with a scattering medium; 2, absorbing plate; 3, white marker; 4, black markers; 5, polarizer; 6, analyzer; 7, a halogen lamp; 8, CCD camera; and 9, PC. (b) Distributions of backscattered radiation intensity along an arbitrarily chosen line of the image for different volume concentrations of milk emulsion: 1, 0%; 2, 0.66%; 3, 1.96%; and 4, 5.51% (R-component of the color image). (c) Dependencies of the polarization image contrast on the volume concentration of the milk emulsion when the normalized intensity of the (1) unpolarized light, (2) copolarized components, (3) cross-polarized components, and (4) the degree of polarization of backscattered radiation are used as the visualization parameter.
the depth of an inhomogeneity position on the order of (0.25–0.6) ξL (depending on the degree of residual polarization in the backscattered background component detected outside the region of the inhomogeneity localization). In particular, this conclusion agrees with data on polarization imaging of skin, which points to the efficiency of polarization imaging for epidermis and upper layers of papillary derma (100–150 μm).1144
Tissue Optics: Light Scattering Methods and Instruments for Medical Diagnosis |
497 |
7.2 Polarized reflectance spectroscopy of tissues
7.2.1 In-depth polarization spectroscopy
Imaging and monitoring of the morphological and functional state of biological tissues may be provided on the basis of spectral analysis of the polarization properties of the backscattering light.1146 Tissue probing by a linear polarized white light and measuring of the spectral response of the copolarized and cross-polarized components of the backscattered light allow one not only to quantify chromophore tissue content, but also to estimate in-depth chromophore distribution.
In the visible wavelength range, skin may have a reduced scattering coefficient μs 30–90 cm−1 and absorption coefficient μa 0.2–5 cm−1 (see Table 2.1); therefore, the expected transport mean free path of a photon lt = (μa + μs)−1 [see Eq. (1.22)] is in the range 100–300 μm. Because of the dominating of scatterers with sizes, characterized by a diffraction parameter ka > 1 [see Eqs. (1.99) and (1.100) and Figs. 1.27 and 1.28], the depolarization length ξL in skin is comparable with the transport scattering length lt, and exceeds the skin epidermis thickness. On the other hand, such absorbers as melanin in epidermis and hemoglobin in dermis must increase the degree of the residual polarization of the backscattered light in the spectral ranges that correspond to the absorbing bands of the dominating chromophores. Moreover, these chromophores are placed at different
depths; thus, their localization may be estimated owing to the characteristic absorbing bands on the differential polarization spectra.135,1146
Figure 7.7 shows the experimental setup for the backscattering polarization spectral measurements. Light from a white light source (halogen lamp of 200 W) is guided to the object by a fiber bundle with an attached wideband linear polarization filter. The diameter of the irradiated skin surface is approximately 8 mm. The backscattered light from the skin is collected by another fiber bundle to the input of which a polarized filter is attached. This filter is variable and may change its orientation, being parallel with or perpendicular to the optical axis of the first polarization filter. Fiber bundles are used to exclude some polarization sensitivity that may take place at the use of monofibers. To exclude specular reflection from
Figure 7.7 Scheme of the experimental setup for the backscattering polarization spectral measurements:1146 1, a white light source (halogen lamp, 200 W); 2 and 3, fiber bundles; 4 and 5, polarization filters; 6, object under study; 7, photodiode-array grating spectrometer; 8, PC.
498 |
Polarization-Sensitive Techniques |
the skin surface, the detecting fiber bundle was placed at an angle of 20 deg with respect to the normal to the skin surface. A distal end of the fiber was connected with the spectrometer.
This instrument is able to measure reflectance spectra at both parallel and perpendicular orientations of filters RII (λ) and R (λ). From these spectra, the differential residual polarization spectra Rr (λ) or residual polarization degree spectra PLr (λ) are calculated as
Rr (λ) = RII (λ) − R (λ), |
(7.4) |
|||
P r |
(λ) |
RII (λ) − R (λ) |
. |
(7.5) |
L |
|
= RII (λ) + R (λ) |
|
|
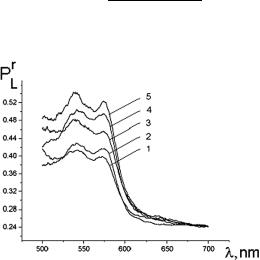
Figure 7.8 In vivo measured residual polarization degree spectra for a volunteer with UV-induced erythema of different degrees (erythema index, EI): 1, EI = 157; 2, EI = 223; 3, EI = 249; 4, EI = 275; and 5, EI = 290.1146 Erythema index was measured using the erythema-melanin meter described in Ref. 1147.
Two examples of in vivo human skin studies using polarization spectroscopy are presented in Figs. 7.8 and 7.9.1146 Figure 7.8 demonstrates spectral distributions of the residual polarization degree PLr (λ) of the backscattered light for different values of the index of erythema induced by UV light. For a higher erythema index (EI) or skin redness (increased blood volume), PLr (λ) is improved within the absorption Q-bands of the blood. This happens owing to the reduction of multiplicity of scattering for the photons with wavelengths that fall down to the absorption bands because of more intensive absorption of such photons.
Figure 7.9 presents differential polarization spectra, which are also sensitive to the absorption properties of skin that was controlled using a tape stripping technology. Less epidermal thickness corresponds to a higher blood volume within the measuring volume (higher hemoglobin absorption). Therefore, in spite of the
Tissue Optics: Light Scattering Methods and Instruments for Medical Diagnosis |
499 |
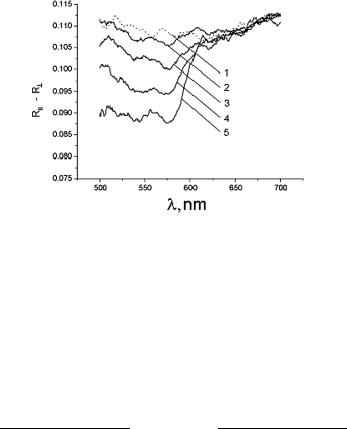
Figure 7.9 In vivo measured differential residual polarization spectra for a volunteer at epidermal stripping of different thicknesses:1146 1, normal skin; 2, thickness of the removed skin layer is 40 μm; 3, 50 μm; 4, 60 μm; and 5, 70 μm.
[RII (λ) − R (λ)] value reduction within the blood absorption bands (545 and 575 nm) due to the attenuation of both polarization components, its difference from the values measured far from the blood absorption bands, i.e., in the range 650–750 nm, is significant to providing in-depth profiling of epidermal thickness and blood vessels in skin.
As a criteria of epidermal thickness, the following parameters can be used:1146
V545 = |
R(r650 |
− |
700) − R545r |
or V575 = |
R(r650 |
− |
700) − R575r |
||
Rr |
Rr |
Rr |
Rr |
. (7.6) |
|||||
− |
− |
||||||||
|
(650 |
700) + 545 |
|
(650 |
700) + 575 |
|
|||
|
|
|
|
|
|||||
In these equations, indices 545 and 575 denote the differential residual polarization backscattering coefficients at the wavelengths of the hemoglobin absorption bands’ centers (λ = 545–575 nm) and (650–700) at the wavelength range, where hemoglobin absorption is small (λ = 650–700 nm).
This method is still simple and, owing to the spectral information received, may provide information about living tissue that is more valuable than the nonspectral polarization methods described in Section 7.1.2. The experimental system is shown in Fig. 7.10. Monochrome images of the skin are captured by a video system, VSCTT 60-075 (Videoscan Ltd., Russia). To get smoother white light irradiation of the skin surface and to avoid specular light detection, four halogen lamps of 50 W were positioned with their irradiation directed from four different sides at an angle30 deg with respect to the normal to the skin surface. The output of each light source was filtered by identical linear polarized filters, and a rotatable polarization filter-analyzer was placed in front of the monochrome CCD camera. Figure 7.11 shows an example of skin burn lesion polarization-spectral imaging at the wavelength of hemoglobin absorption ( 550 nm). It is well seen that the maximal image contrast of 0.49 is provided for the polarization degree as a visualization parameter.
500 |
Polarization-Sensitive Techniques |
Figure 7.10 Experimental setup for polarization-spectral imaging of in vivo tissues:1146 1, tissue; 2, polarization filters; 4, polarization and interferential filters; 3, light sources; 5, monochrom CCD camera; 6, PC.
Figure 7.11 Polarization-spectral (λ = 550 nm) images of a skin burn lesion of the volunteer:1146 (a) a copolarized image; (b) a crossed-polarized image; (c) degree of polarization image, PLr .
7.2.2 Superficial epithelial layer polarization spectroscopy
One of the promising approaches to early cancer diagnosis is based on the analysis of a single scattered component of light perturbed by tissue structure (see Section 6.3). The wavelength dependence of the intensity of the light elastically scattered by the tissue structure appears sensitive to changes in tissue morphology that are typical of precancerous lesions. In particular, it has been established that specific features of malignant cells, such as increased nuclear size, increased nuclear/cytoplasmic ratio, pleomorphism, etc., are markedly manifested in the elastic light scattering spectra of probed tissue. A specific fine periodic structure in the wavelength of backscattered light has been observed for mucosal tissue.180 This oscillatory component of light scattering spectra is attributable to a single scattering from surface epithelial cell nuclei and can be interpreted within the framework of Mie theory. Analysis of the amplitude and frequency of the intensity spectrum’s fine structure allows one to estimate the density and size distributions of these nuclei. However, the extraction of a single-scattered component from the masking multiple scattering background is a problem. Also, as it was shown in Section 7.2.1,
Tissue Optics: Light Scattering Methods and Instruments for Medical Diagnosis |
501 |
absorption of stroma related to hemoglobin distorts the single-scattering spectrum of the epithelial cells. Both of these factors should be taken into account when interpreting the measured spectral dependencies of the backscattered light.
The negative effects of a diffuse background and hemoglobin absorption can be significantly reduced by the application of a polarization discrimination technique in the form of the illumination of the probed tissue with linearly polarized light followed by the separate detection of the elastic scattered light at the paral-
lel and perpendicular polarization states (i.e., the copolarized and cross-polarized components of the backscattered light).150,163 This approach, called polarized elas-
tic light scattering spectroscopy or polarized reflectance spectroscopy (PRS), will potentially provide a quantitative estimate not only of the size distributions of cell nuclei, but also of the relative refractive index of the nucleus. These potentialities,
which have been demonstrated in a series of experimental works with tissue phantoms and in vivo epithelial tissues,150,163,166,180 allow one to classify the PRS tech-
nique as a new step in the development of noninvasive optical devices for real-time diagnostics of tissue morphology and, consequently, for improved early detection of precancers in vivo. An important step in the further development of the PRS method will be the design of portable and flexible instrumentation applicable to in situ tissue diagnostics. In particular, fiber-optic probes are expected to “bridge the gap between benchtop studies and clinical applications of polarized reflectance spectroscopy.”1148
7.3 Polarization microscopy
Polarized light microscopy has been used in biomedicine for more than a century to study optically anisotropic biological structures that may be difficult, or even impossible, to observe using a conventional light microscope. A number of commercial microscopes are available on the market, and numerous investigations of biological objects have been made using polarization microscopy. However, modern approaches in polarization microscopy have the potential to enable one to acquire new and more detailed information about biological cells and tissue struc-
tures. At present, it is possible to detect optical path differences of even less than 0.1 nm.168,388,754,1149–1151 Such sensitivity as well as the capability to examine
scattering samples are due to recent achievements in video, interferential, and multispectral polarization microscopy. Full Mueller matrix measurements and other combined techniques, such as polarization/confocal and polarization/OCT microscopy, promise new capabilities for polarization microscopy including in vivo measurements.
In addition to that discussed in Sections 1.4, 3.3, and 5.7.1, in this section, we will discuss only a few of the recent studies and novel techniques that have the potential to examine the anisotropic properties of scattering samples. One of the examples is the multispectral imaging micropolarimeter (MIM), which can detect
the birefringence of the peripapillary retinal nerve fiber layer (RNFL) in glaucoma diagnosis.168,388 The optical scheme of the MIM is presented in Fig. 7.12.

502 |
Polarization-Sensitive Techniques |
Figure 7.12 Optical scheme of the multispectral imaging micropolarimeter used in transmission mode.388 LS, light source; IF, interference filter; IS, integrating sphere; P, linear polarizer; SP, specimen; CB, chamber; L1, L2, and L3, lenses; C , linear retarder; A, linear analyzer; CCD, charge-coupled device.
Light from a tungsten-halogen lamp, followed by an interference filter (band of 10 nm), provides monochromatic illumination to an integrating sphere (IS). Lens L1 (F = 56 mm) collimates the beam incident onto a polarizer (P). The use of an integrating sphere assures that the output intensity of the polarizer varies less than 0.2% as it rotates 360 deg. Lens L2 (F = 40.5 mm, NA = 0.13) focuses the image of the exit aperture of the integrating sphere onto a specimen (SP) in a chamber (CB) with a flat entrance and exit windows. Lens L3 (F = 60 mm, NA = 0.07) focuses the specimen image onto a cooled CCD camera that provides a pixel size of about 4 μm on a specimen in an aqueous medium (magnification ≈ 5.8). Although the lenses are achromatic, the wide spectral range (440–830 nm) requires only small changes in the detection optics’ position (moving the lens L3 and CCD together within a 0.5-mm range) to adjust the focus for each wavelength. A liquid crystal linear retarder (C ), followed by a linear analyzer (A), is used to measure the output Stokes vector of the specimen. Both polarizer and analyzer are GlanTaylor polarization prisms. The azimuth and retardance of the retarder are set for a few discrete values, and the azimuth of the analyzer is always fixed at 45 deg. Each setting of the retarder (respectively, azimuth and retardance)—(1) 0, 90 deg;
(2) 0, 200 deg; (3) 22.5, 207 deg; (4) −22.5, 207 deg)—is characterized by a 1 × 4 measurement vector. The four retarder/analyzer settings together are characterized by a 4 × 4 matrix D, with each row corresponding to one measured vector.
A Stokes vector S can be calculated as
|
|
= D−1R, |
|
|
|
|
(7.7) |
|
S |
|
|
|
|
||
where D−1 is the inverse of the measurement matrix and |
|
is a 4 |
× |
1 response vec- |
|||
R |
|||||||
tor corresponding to the four retarder/analyzer settings. |
816 |
|
|
||||
|
|
To evaluate the linear |
|||||
retardance of a specimen, the Mueller matrix should be found from the measurements of the incident Sinc and the output S Stokes vectors (see Section 1.4) as
S |
= KM(ρ, δ) |
S |
inc, |
(7.8) |
where the factor K accounts for the losses of intensity in transmission and ρ and δ are, respectively, the azimuth and retardance of the specimen. This expression in-
Tissue Optics: Light Scattering Methods and Instruments for Medical Diagnosis |
503 |
cludes four equations for the three unknowns, K, ρ, and δ. In most cases, it is useful to overdetermine the system of equations in Eq. (7.8) by using more than one Sinc.
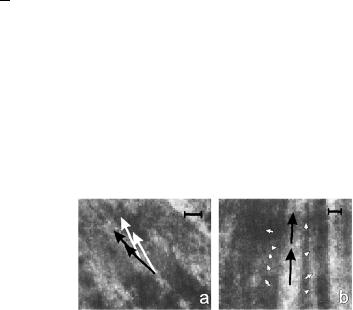
The retardance and azimuth of a living and fixed rat’s RNFLs were measured over a wide spectral range.388 It was found that the RNFL behaves as a linear retarder and that the retardance is approximately constant in a wavelength range from 440 to 830 nm. The average birefringence measured for a few unfixed rat RNFLs, with an average thickness of 13.9 ± 0.4 μm, is 0.23 ± 0.01 (nm/μm) ≡ 2.3 × 10⁻⁴. The influence of the polarization properties of the retina on the measured RNFLs’ anisotropic properties was found. Images presented in Fig. 7.13 illustrate the importance of correcting for the polarization properties of the retina and for the distributions of retardance and azimuth within the sample.
Figure 7.13 Estimated retardances (arrows’ lengths) and slow axes (arrows’ directions) of the bundle and gap areas of rat RNFLs.388 The images are at the wavelength 440 nm. Images sizes: (a) 222 × 199 μm; (b) 187 × 177 μm. Nerve fiber bundles appear as brighter bands. Each arrow starts in the center of the area measured. The calibration bar is 1 nm of retardance. (a) The white arrows represent measurements that are not corrected for retinal polarization ability, and the black arrows are corrected ones. (b) The black arrows are corrected bundle retardances; the small white arrows in the gaps show the variation of residual retardances, also after correction.
Another technique, which is related to quantitative polarized light microscopy, is based on a video microscopy technique that is applied to measure variations in the orientations of the collagenous fibers arranged in lamellae within eye corneal tissue.1149 The lamellar structure of the cornea and sclera is very visible in Figs. 3.2, 3.3, and 3.4. Within a lamella, the fibrils are parallel, but the fibrils of adjacent lamellae do not, in general, run in the same direction. They may have a relative orientation at any angle between 0 and 180 deg.
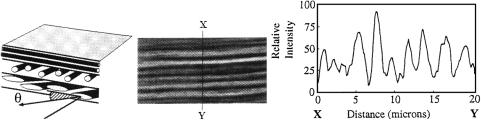
As was discussed in Section 3.1.1, in corneal stroma, the fibrils have a diameter of 25–39 nm while the mean diameter of scleral fibrils is equal to 100 nm. Therefore, the individual fibrils cannot be resolved with light microscopy; but due to the intrinsic birefringence of collagen fibrils and its dependence on the angle of their orientation from lamella to lamella, they can be recognized. Along its fiber axis, collagen is highly birefringent, so those lamellae that are cut parallel to the fiber axes [θ = 0 deg, see Fig. 7.14(a)] appear brighter under polarized light when the polarizer and analyzer are crossed and the length of the tissue section is oriented at 45 deg to the polarizer/analyzer axis [see Fig. 7.14(b)]. Collagen is not
504 |
Polarization-Sensitive Techniques |
birefringent perpendicular to its fiber axis [θ = 90 deg, see Fig. 7.14(a)], so those lamellae that are cut perpendicular to their fibril direction appear completely dark in this section [see Fig. 7.14(b)]. The variation of intensity along the transect X–Y across the cornea section [see Fig. 7.14(b)] is caused by the different angular orientation of the particular lamella (totally, about 15 lamellae are seen) and presented in Fig. 7.14(c).
Because of the regular arrangement of the lamellae, the angle θ is all that is necessary to define the three-dimensional orientation of the fibrils in sections of normal cornea. Nevertheless, to find this angle distribution for a specific tissue section, the lamellar birefringence of form that contributes about 67% to the total birefringence should be accounted for.1149 For sections of disrupted pathological cornea and for sections of sclera and limbus (the region where the cornea and sclera fuse), the situation is more complicated because the lamellae have a much less ordered “wavy” arrangement [see Fig. 3.5(b) for sclera].
(a) |
(b) |
(c) |
Figure 7.14 Polarization microscopy of a collagenous tissue structure.1149 (a) Schematic diagram of a tissue section containing three lamellae (the number of fibrils is greatly reduced and the relative fibril diameter greatly exaggerated; an actual electronic micrograph is shown in Fig. 3.2); angle θ is the angle of inclination of the fibrils relative to the plane of sectioning. (b) Digital photomicrograph of a section through part of a rabbit cornea viewed under polarized light (×500). (c) The variation in intensity along the transect X–Y across the cornea section of photomicrograph (b).
Many tissues possess very complex patterns of alignment of the structureforming elements. Some polarization microscopic methods that show promise for generating alignment maps for such tissues have been developed (see, for example, Refs. 1152–1154). The method presented in Refs. 1152 and 1153, as well as the method used in Ref. 1149, is a useful tool in cases where the tissue structure along the direction of the probing light propagation can be considered to be a uniform one. In Refs. 1152 and 1153, a microscopic polarimetry method for generating fiber alignment maps, which can be used for characterization of the structure of fibrous tissues, tissue phantoms, and other fibrillar materials, is considered. This method is based on probing the sample with elliptically polarized light from a rotated quarter-wave plate and an effective circular analyzer. Nonlinear regression techniques are implemented for estimating the optical parameters of the optic train and the sample. The processing of the sequence of images obtained with different mutual orientations of the rotated quarter-wave plate and the analyzer, which
Tissue Optics: Light Scattering Methods and Instruments for Medical Diagnosis |
505 |
is based on fast harmonic analysis, permits the recovery of an alignment direction map and a retardation map. These maps describe a spatial distribution of a sample’s local linear birefringence and, therefore, can be used for morphological analysis of tissues with an expressed structural anisotropy that have linear birefringence as their dominant optical property. The potential of this method for accurately generating alignment maps for samples that act as linear retarders to within a few degrees of retardation has been demonstrated in experiments with an in vitro sample of a porcine heart valve leaflet.
The method proposed in Ref. 1154 can also be used in more general situations when the orientation of the structure-forming elements (for instance, the collagen fibers) varies along the probing direction. Such variation should be taken into account when thick (>50 μm) tissue layers (e.g., dermis) are analyzed. In the method discussed,1154 a standard polarization microscope arranged with a CCD camera can be used. The measurements are usually carried out with wide-spectral-range color filters and without a quarter-wave plate. The following expression describes the dependence of the detected signal at any detection point on the angles of orientation of the polarizer (ϑ) and the analyzer (ϑ ) of the microscope:
iC ≈ B0 + B1 cos η + B2 cos ς + B3 sin η + B4 sin ς, |
(7.9) |
η = 2(ϑ − ϑ ), ς = 2(ϑ + ϑ ), |
|
where Bi (i = 0, 1, 2, 3, and 4) are the coefficients, which depend on the local optical properties of the sample in the probed region and the spectral properties of incident light. As was shown in Ref. 1154, the measured values of Bi are capable of providing important information about the sample structure. They can also be used for characterization of specific features of light propagation in the sample; in particular, they allow us to recognize the so-called adiabatic regime of light propagation in the studied medium. This means that in the adiabatic regime, the orientation of the local optical axis changes smoothly in the probed region of the tissue. Note that for fibrous tissues, the direction of the local optical axis typically coincides with the local preferred direction of fiber orientation. If the adiabatic regime is realized, then the angles υ and φ, which are calculated from the obtained values of Bi as υ = (1/4) arctan(B2/B4) and φ = (1/2) arctan(B1/B3), provide information about the structure of the sample. The angle φ is equal to the angle between the azimuthal projections of the local optical axes of the medium at the upper and lower boundaries of the sample, and the angle υ defines the orientation of the bisector of the angle between these projections. Analysis of the experimentally obtained “Bi -maps,” as well as the spatial distributions of υ and φ, can be proposed as an effective tool for tissue structure characterization.1154 In particular, the B0-map (this coefficient characterizes the local transmittance of the sample for nonpolarized light), the υ-map, and the φ-map for the in vitro sample of human epidermis (stratum corneum) are presented in Ref. 1154.
The study of collagen structure and function is important for understanding a wide range of pathophysiological conditions, including aging. One of the prospec-
506 |
Polarization-Sensitive Techniques |
tive laser techniques, which can provide in vivo microscopic monitoring of col-
lagen structure, is polarized second-harmonic generation (SHG) microscopy (see Sections 4.7 and 5.75).941,944 The backscattered SHG signal induced by a 100-fs
titanium:sapphire laser, with a mean wavelength of 800 nm, a maximum energy of 10 nJ, and a pulse repetition rate of 82 MHz, was measured by a polarized SHG scanning confocal microscope.944 The microscope objective has a transverse resolution of about 1.5 μm and an axial resolution of about 10 μm. It should be noted that inside the scattering media, both numbers increase. The maximum intensity in the sample was about 4 × 10¹¹ W/cm2. To avoid sample damage, a continuous scanning technique was used. A systematic analysis of type I collagen in a rat-tail tendon fascicle was conducted using this microscope. Type I collagen from the fascicles provides one of the strongest SHG signals of all of the various tissues analyzed by the authors in Ref. 944. They hypothesize that such high SHG efficiency is due to the highly ordered architecture of collagen. The polarization properties of collagen are also defined by its ordering. It was shown experimentally that the second-harmonic signal intensity varies by about a factor of two across a single cross section of the rat-tail tendon fascicle.944 The signal intensity depends both on the collagen organization and the backscattering efficiency. To characterize collagen structure, both intensityand polarization-dependent SHG signals should be detected. Actually, axial and transverse scans for different linear polarization angles of the input beam show that SHG in the rat-tail tendon depends strongly on the polarization of the input laser beam. In contrast to SHG signal intensity, the functional form of the polarization dependence does not change significantly over a single cross section of the sample, and it is not affected by the backscattering efficiency.
The measured data were in good agreement with an analytical model developed for a SHG signal at linear polarized excitation and were used to determine the fibril orientation and the ratio between the only two nonzero, independent elements in the second-order nonlinear susceptibility tensor, γ ≈ −(0.7–0.8).944 The small range of values observed for γ in a tendon fascicle suggests that there is structural homogeneity. This parameter might, therefore, be useful in characterizing different collagen structures noninvasively.
The main problem encountered in the in situ microscopy of tissues is multiple scattering, which randomizes the direction, coherence, and polarization state of incident light. A number of optical-gating methods have been proposed to filtrate ballistic and least-scattering photons, which carry information about the object structure. One of these is the polarization-gating method and its modifications, which are described in this chapter and Sections 1.4, 3.3, and 5.7.1. The fundamental limitation of all optical-gating methods, including the polarization one, is the fact that only a small number of ballistic and least-scattering photons take part in the formation of an object image. Therefore, polarization-gating techniques in
combination with image reconstruction methods can be useful for improving the image resolution in the case of a highly scattering object.1155,1156 Both reflection-
mode and transmission-mode polarization-gating scanning microscopes have been analyzed.1155,1156
Tissue Optics: Light Scattering Methods and Instruments for Medical Diagnosis |
507 |
An optical immersion technique, based on matching the refractive index of the tissue scatterers and the surrounding ground (interstitial) medium, allows one to essentially control the scattering properties of a tissue (see Chapter 5). Usually, the refractive index of the ground medium is controlled. This is accomplished by impregnating the tissue with a biocompatible agent, such as glucose, glycerol, propylene glycol, or x-ray contrasting agents. Due to the fact that the refractive index of the applied agent is higher than that of the tissue ground substance, which is close to the index of water, the refractive index of the ground increases and scattering decreases. Most of the applied agents are hyperosmotic; therefore, they can produce a temporal and local dehydration of the tissue that also leads to an increase in the refractive index of the interstitial space. Figures from 5.35 to 5.38 show experimental results on the temporal transmittance of linear polarized light through tissue sections measured by a white-light video-digital polarization microscope or polar-
ization spectrometer on the application of an immersion agent (x-ray contrasting agent, trazograph-60, or glycerol).409,410,442,946,1033,1065
Reduction of the scattering at optical immersion makes it possible to detect the polarization anisotropy of a tissue more easily and to separate the effects of light scattering and intrinsic birefringence on tissue polarization properties. It is also possible to study birefringence of form with optical immersion, but when the immersion is strong and the refractive index of tissue birefringent structure is close to the index of the ground media, the birefringence of form may be too small to be detected [see Fig. 5.36 (the tendency of polarization degree to decay at a later time of tissue impregnation by the OCA) and Fig. 5.38(b) (the complete match of refractive index at the edge region causes tissue to lose not only scattering, but also the birefringence)]. The dynamics of tissue optical clearing and the manifestation
of tissue anisotropy at the reduction of scattering are characteristic features, which correlate with clinical data.343,409,410 Figure 5.10 illustrates the reversibility of the
optical immersion effect in the controlling of the polarization properties of a turbid
tissue.343 Practically all healthy connective and vascular tissues show the strong or weak optical anisotropy typical of either uniaxial or biaxial crystals.409,410 Patho-
logical tissues show isotropic optical properties.
Polarization microscopy is also helpful for investigating individual cells; in particular, for evaluating the amount of glycated hemoglobin in erythrocytes that could be an early diagnostic marker of hyperglycemia in diabetic patients.754 Hemoglobin glycation causes changes in the cell’s refraction index. By using polarizing-interference microscopy, it is possible to measure the light refractive index in an individual erythrocyte. The refractive index of hemoglobin or a red blood cell, containing about 95% hemoglobin, varies approximately linearly with a change in glucose concentration—it saturates only under strong hyperglycemic conditions.752,753 A Nomarsky polarizing-interference microscope, MPI-5 (Poland), was used for measurements of light phase retardation.754 Using a Wollaston prism mounted on an object, the erythrocyte images for ordinary and extraordinary light beams were completely separated. In the thickest erythrocyte region, the first interference maxima were visually adjusted to the eye-sensitive

508 |
Polarization-Sensitive Techniques |
purple color for ordinary and extraordinary images by shifting the second Wollaston prism placed in the rear focus of the object. For each erythrocyte measured, the Wollaston prism displacement rendered a second value. From the whole interference bandwidth h and the measured Wollaston prism displacement 2d, the phase retardation and the refractive index n were calculated for each erythrocyte as754
|
= nv + |
dλ |
|
||
n = nv + |
|
|
, |
(7.10) |
|
t |
ht |
||||
where nv = 1.5133 ± 0.0001 is the refractive index of the embedding media, t is the thickness of the erythrocyte, and λ = 550 nm. Separate measurements of the erythrocyte thickness using two embedded media with different refractive indices gives t = 0.89 μm. Using this value, the refractive index is calculated with a standard deviation of ±0.0005.
A robust z-polarized confocal microscope employing only one or two binary phase plates with a polarizer has been suggested by Huse et al.1157 The major ad-
vantage of the microscope having a significant longitudinal field component is that it is then possible to image the z-polarized features in randomly oriented agglomerations of molecules of biomedical interest.
7.4 Digital photoelasticity measurements
Photoelasticity is an established experimental technique that has been applied to study the biomechanics of hard tissues like bone and tooth.1158,1159 The photoe-
lastic measuring technique is based on the stress-induced optical birefringence
effect, which for plane stress analysis is described by the following stress-optic
law:1158,1159
σ1 − σ2 = |
θ fσ |
= |
Nfσ |
, |
(7.11) |
||
|
|
|
|
||||
2π h |
|
h |
|||||
where (σ1 − σ2) is the difference in the in-plane principle stress, θ is the resultant optical phase generated due to stress-induced birefringence in the sample, fσ is the material fringe value, and h is the thickness of the specimen. Since the values of fσ and h are constants for the mechanical stresses, recording the optical phase (θ)
or fringe order (N = θ/2π) at every point of interest on the fringe pattern allows for analysis of the stress distribution.1158,1159
As an example, we will consider the results of photomechanical studies of postendodontically rehabilitated teeth, using a conventional circular polariscope and an image processing system, which were the basis for the digital phase shift photoelastic technique described in Refs. 1158 and 1159. A special loading device that applies loads along the long axis (0 deg) and 60-deg lingual to the long axis of the tooth was employed. Using the polariscope, four phase-stepped images were obtained for the sample at each load by rotating the analyzer at 0-, 45-, 90-, and 135-deg angles with respect to the polarizer. The fringe patterns obtained were
Tissue Optics: Light Scattering Methods and Instruments for Medical Diagnosis |
509 |
acquired using a CCD camera, and stored and processed by a computer. The four
images were evaluated using a phase-stepping algorithm to obtain a wrapped phase map.1158 Phase unwrapping was done on selected lines to make the fringe modu-
lation continuous and to get information on the nature of the stress distribution.
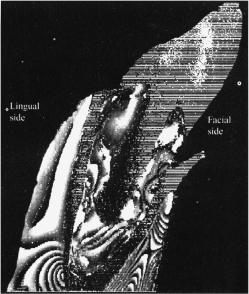
Figure 7.15 Phase-wrapped image obtained from four-phase shifted images in a rehabilitated tooth model, loaded at 125 N, 60 deg lingual to the long axis of the tooth.1159
Figure 7.15 shows a phase-wrapped image of the rehabilitated tooth model, loaded at 125 N at an angle of 60 deg in the direction of the long axis of the tooth. It was found that there is a significant (up to threefold) increase in the magnitude of the stress within the rehabilitated tooth model in comparison with the model of the intact tooth. Increased bending stress is identified in the cervical region and in the middle region of the root. This results in higher compressive stress in the cervical region (facial side) and higher tensile stress in the midregion (lingual side). The designed digital phase-shift photoelastic technique is of importance for the investigation of hard tissue elasticity distributions; here, for instance, it highlighted the behavior of a postcore rehabilitated tooth to functional forces.
7.5 Fluorescence polarization measurements
Fluorescence polarization measurements are used to estimate various parameters of the fluorophore environment.573 They therefore have a potential role to play in
biomedical diagnosis; in particular, in discriminating between normal and malignant tissues.1160–1163 At polarized light excitation, the emission from a fluorophore
in a nonscattering media becomes depolarized because of the random orientation

510 |
Polarization-Sensitive Techniques |
of the fluorophore molecules and the angular displacement between the absorption and emission dipoles of the molecules.573 These intrinsic molecular processes that result in additional angular displacement of the emission dipoles are sensitive to the local environment of the fluorophore. As was already shown in preceding chapters, light depolarization in tissues is determined by multiple scattering; there-
fore, both excitation and emission radiations should be depolarized in scattering media.573,1160–1163 Polarization state transformation in scattering media depends
on the optical parameters of the medium: the absorption coefficient μa, the scattering coefficient μs, and the scattering anisotropy factor g. Because of the different structural and functional properties of normal and malignant tissues, the contribution of multiple scattering to depolarization may be different for these tissues. The reduced (transport) scattering coefficient μs, or the transport mean free path (MFP) lt, in particular, determines the characteristic depolarization depth for different tissues. Thus, fluorescence polarization measurements may be sensitive to tissue structural or functional changes, which are caused, for instance, by tissue malignancy at the molecular level (the sensitivity of excited molecules to the environmental molecules) or at the macrostructural level (the sensitivity of propagating radiation to tissue scattering properties).
Mohanty et al.1162 have considered a fluorophore located at a distance z from the surface of a turbid medium. The homogeneous distribution of the fluorophores and the validity of the diffusion approximation for light transport in a scattering medium were assumed. The average number of scattering events experienced by the excitation light before it reached the fluorophore, and by the emitted light before it exited the medium, are described, respectively, as
N1(z) = z × μsex, |
(7.12) |
and
N2(z) = z × μsem. |
(7.13) |
The fluorescence polarization ability is characterized by polarization anisotropy
r, which is a dimensionless quantity independent of the total fluorescence intensity of the object,573
r |
I − I |
. |
(7.14) |
|
= I + 2I |
|
|
It is defined as the ratio of the polarized component to the total intensity and is connected with the light polarization value P ,
r = |
|
|
2P |
(7.15) |
||
|
|
|
|
. |
||
3 |
− |
P |
||||
|
|
|
|
|
|
|
Tissue Optics: Light Scattering Methods and Instruments for Medical Diagnosis |
511 |
||
The polarization, measured as |
|
|
|
P |
I − I |
, |
(7.16) |
|
= I + I |
|
|
is an appropriate parameter for describing a light source when a light ray is directed along a particular axis. The polarization of this light is defined as the fraction of light that is linearly polarized. In contrast, the radiation emitted by a fluorophore is symmetrically distributed around this axis, and the total intensity is not given by I + I , but rather by I + 2I (see Section 10.4 of Ref. 573).
Assuming that each scattering event reduces the fluorescence polarization anisotropy r by a factor of A (A = 0–1), the anisotropy of fluorescence that is due to a fluorophore embedded at a depth z can be written as
r(z) = r0 × A[N1(z)+N2(z)], |
(7.17) |
where r0 is the value of the fluorescence anisotropy without any scattering. For a homogeneous distribution of fluorophores in a tissue of thickness d, the observed value of the fluorescence anisotropy is defined by each ith tissue layer as
robs = $(Iif ri )/ |
$Iif , |
(7.18) |
i |
i |
|
where Iif is the contribution to the observed fluorescence intensity from the ith layer of thickness dz at a depth z, and ri is the value of the fluorescence anisotropy for this layer.
For the broad-beam illumination of a flat tissue surface, the propagation of excitation (ex) light beyond a few MFPs [MFP ≡ lph = μ−t 1, μt = μa + μs, see Eq. (1.8)] is well described by one-dimensional diffusion theory. In this approximation, and taking into account μext μexeff [see Eq. (1.18)], which is valid for many tissues, the excitation intensity reaching depth z is expressed as
I (z) Cex exp( |
− |
μeffex z), |
(7.19) |
= |
|
|
where Cex is proportional to the excitation intensity and is the function of the tissue optical parameters at the wavelength of the excitation light.
The fluorescence from the fluorophores, embedded at depth z from the tissue surface, reaching the same surface will therefore be
I f (z) ≈ (Cex exp(−μeffex z)),ϕ(Cem exp(−μeffemz))-, |
(7.20) |
where Cem and μexeff for the emission wavelength are defined similarly as Cex and μexeff for the excitation wavelength, and ϕ is the fluorescence yield.

Tissue Optics: Light Scattering Methods and Instruments for Medical Diagnosis |
513 |
|
|
|
|
|
|
|
(a) |
(b) |
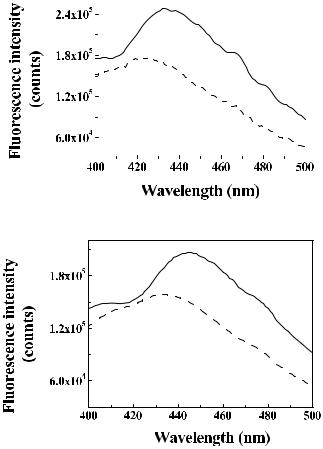
Figure 7.16 Typical polarized fluorescence spectra at 340-nm excitation of human breast tissue samples of 2-mm thickness.1162 Solid curves, spectra with excitation and emission polarizers oriented vertically (I ); dashed curves, spectra with crossed excitation and emission polarizers (I ). (a) Malignant tissue; (b) normal tissue.
with 440-nm emission and 340-nm excitation, are presented in Fig. 7.17.1162 The theoretical fit to experimental data using Eq. (7.24) and the parameter of single-
scattering anisotropy reduction A = 0.7 gives the following data for the anisotropy
and optical parameters: r0 = 0.34, μtots = 590 cm−1, μtoteff = 53.5 cm−1 for malignant tissue, and r0 ≈ 0.25, μtots = 470 cm−1, μtoteff = 34.5 cm−1 for normal tissue.
The anisotropy values are higher for malignant tissues as compared to normal for very thin tissue sections, where d ≤ 30 μm. By contrast, in thicker sections, the malignant tissue shows smaller fluorescence anisotropy than the normal tissue.
The fact that fluorescence anisotropy varies with tissue thickness is associated with the manifestation of various mechanisms of fluorescence depolarization that are caused by energy transfer and rotational diffusion in the fluorophores and by

Tissue Optics: Light Scattering Methods and Instruments for Medical Diagnosis |
515 |
scattered probe light, which may be easily integrated in traditional optical diagnostical techniques such as diffuse reflectance spectroscopy and imaging, offers a possibility for improving the diagnostic potential of these techniques. Another novel contribution to optical medical diagnostics should emerge from the morphological study of tissues with expressed structural anisotropy. Typically, almost all of the polarization-sensitive techniques that we considered in this chapter can be realized with inexpensive commercially available instrumentation. Neither do they require sophisticated data processing algorithms. In other words, these methods are completely suitable for widespread implementation in clinical diagnostic practice. Fluorescence polarization measurements that can provide additional information at the molecular level may be useful for discriminating malignant sites from normal ones.