

3
Optical Properties of Eye Tissues
In this chapter, optical models of tissues with basic single and low-step scattering, with ordered and randomly distributed scatterers are analyzed. Three types of eye tissues with various structure and turbidity such as cornea, healthy or cataract lens, and sclera are presented as examples. Basic principles of transmission, reflection, and scattering spectra formation are discussed. Examples of measurements of the Mueller matrix elements for diagnostics and monitoring of biological objects are presented.
3.1 Optical models of eye tissues |
|
|
|
3.1.1 Eye tissue structure |
|
|
|
Healthy tissues of the anterior human eye chamber (see Fig. 3.1)780–783 (e.g., |
|||
the cornea and lens) are highly transparent for visible light because of their |
|||
ordered structure and the absence of strongly absorbing chromophors. Scat- |
|||
tering is an important feature of |
light propagation in |
eye tissues. The |
size |
of the scatterers and the distance |
between them are |
smaller than or |
com- |
parable |
to the wavelength |
of visible light, and the relative refractive index |
of the |
scatterers is equally |
small (soft particles). Typical eye tissue models |
are long round dielectric cylinders (corneal and scleral collagen fibers) or spherical particles (lens protein structures) having a refractive index ns; they are randomly (or quasi-orderly) (sclera, opaque lens) or regularly (transparent
cornea and lens) distributed in the isotropic base matter with a refractive index
n0 < ns.3,10,24,61,63,64,77,129,172,397,399,402,403,432,433,435,436,439,440,722,723,762,778–799
Light scattering analysis in eye tissue is often possible using a single scattering model owing to the small scattering cross section (soft particles).
Let us first consider the structure of the cornea and the sclera in more de-
tail to demonstrate tissues with different size distributions and spatial ordering of scatterers.3,129,432,722,723,762,778–787 The cornea is the frontal section of the eye’s
fibrous capsule; its diameter is about 10 mm. The sclera is a turbid opaque tissue that covers nearly 80% of the eye and serves as a protective membrane to provide, along with the cornea, for counteraction against internal and external forces
and to retain eye shape. Both tissues are composed of collagen fibrils immersed in a ground substance.432,722,723,762,778–780,784–787 The fibrils have a shape similar to
that of a cylinder. They are packed in bundles like lamellae. Within each lamella, all of the fibers are nearly parallel with each other and with the lamella plane. Fibrils
257
258 |
Optical Properties of Eye Tissues |
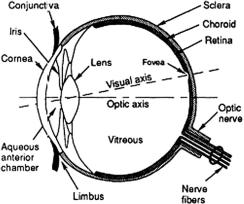
Figure 3.1 Diagram of the human eye showing the location of cornea, lens, sclera, and other eye components.783
and lamellar bundles are immersed within an amorphous ground (interstitial) substance containing water, glycosaminoglycans, proteins, proteoglycans, and various salts. The glycosaminoglycans play a key role in regulating the assembly of the collagen fibrils as well as in tissue permeability to water and other molecules.786 The indices of refraction for the fibers and the ground substance differ markedly.
The structural elements that give the cornea the strength to preserve its proper curvature while withstanding intraocular pressure (14–18 mm Hg) are
located within its stromal layer, which constitutes 0.9 of the cornea’s thick- ness.432,433,435,762,781–783 The stroma is composed of several hundred successively
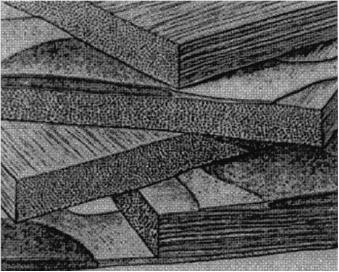
stacked layers of lamellae (see Fig. 3.2), which vary in width (0.5–250 μm) and thickness (0.2–0.5 μm), depending on the tissue region762 (three sequential lamellae are shown in Fig. 3.3). A few flat cells (keratocytes) are dispersed between the lamellae, and these occupy only 0.03–0.05 of the stromal volume. Each lamella is composed of a parallel array of collagen fibrils. Human corneal thickness averages 0.52 mm.
Although the cornea fibril diameters vary from 25 to 39 nm in different mammals, the fibrils are quite uniform in diameter within each species.762,778,786 Spac-
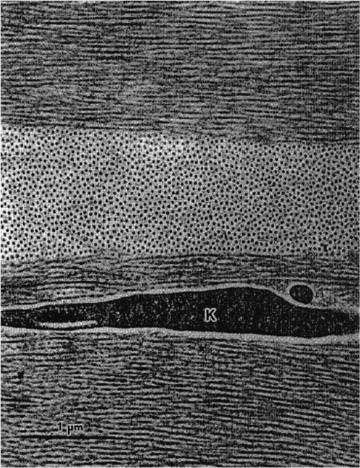
ing between fibril centers is equal to 45–65 nm; intermolecular spacing within fibrils is in the range of 1.56–1.63 nm.778 The fibrils in the human cornea have a uniform diameter of about 30.8 ± 0.8 nm with a periodicity close to two diameters, 55.3 ± 4.0 nm, and rather high regularity in the organization of fibril axes about one another (see Fig. 3.3). The intermolecular spacing is 1.63 ± 0.10 nm.778 Thus, the stroma has at least three levels of structural organization: the lamellae that lie parallel to the cornea’s surface; the fibrillar structure within each lamella that consists of small, parallel collagen fibrils with uniform diameters that have some degree of order in their spatial positions; and the collagen molecular ultrastructure.
The sclera contains three layers: the episclera, the stroma, and the lamina fusca.723 The stroma is the thickest layer of the sclera. The thickness of the sclera and the arrangement of scleral collagen fibers show regional (limbal, equatorial,
Tissue Optics: Light Scattering Methods and Instruments for Medical Diagnosis |
259 |
Figure 3.2 Schematic illustration of the lamellar organization of the cornea stroma. The diagram also depicts how keratocytes are interspersed between lamellae.433
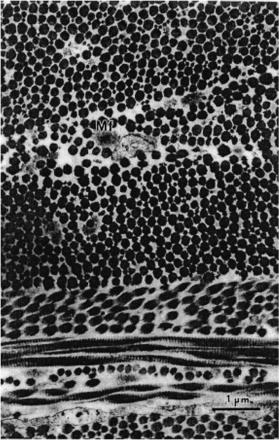
and posterior pole region) and aging differences. In the scleral stroma, the collagen fibrils exhibit a wide range of diameters, from 25 to 230 nm (see Fig. 3.4).762
The average diameter of the collagen fibrils increases gradually from about 65 nm in the innermost part to about 125 nm in the outermost part of the sclera;785 the
mean distance between fibril centers is about 285 nm.787 Collagen intermolecular
spacing is similar to that in the cornea; in bovine sclera, particularly, it is equal to 1.61 ± 0.02 nm.786
These fibrils are arranged in individual bundles in a parallel fashion, but more randomly than in the cornea; moreover, within each bundle, the groups of fibers are separated from each other by large empty lacunae randomly distributed in space.762 Collagen bundles show a wide range of widths (1 to 50 μm) and thicknesses (0.5 to 6 μm) and tend to be wider and thicker toward the inner layers. These ribbonlike structures are multiply cross-linked; their length can be a few millimeters.723 They cross each other in all directions, but remain parallel to the scleral surface. The episclera has a similar structure, with more randomly distributed and less compact bundles than in the stroma. The lamina fusca contains a larger amount of pigments, mainly melanin, which are generally located between the bundles. The sclera itself does not contain blood vessels, but has a number of channels that allow arteries, veins, and nerves to enter into or leave the eye.723
The thickness of the sclera is variable. It is thicker at the posterior pole (0.9 to
1.8 mm); it is thinnest at the equator (0.3 to 0.9 mm), and at the limbus is in the range of 0.5 to 0.8 mm.723 Hydration of the human sclera can be estimated as 68%.
About 75% of its dry weight is due to collagen, 10% is due to other proteins, and 1% to mucopolysaccharides.723
260 |
Optical Properties of Eye Tissues |
Figure 3.3 Collagen fibrils in the human cornea have a uniform diameter and are arranged in the same direction within the lamellae.762 K is the keratocyte (×32,000, scanning electron microscopy).
In designing an optical model of a tissue, in addition to form, sizes, and density of the scatterers (fibrils) and the tissue thickness, it is important to have information on the refractive indices of the tissue components. Following Refs. 172, 723, 778, and 780, we can estimate the refractive index of the corneal and scleral fibrils (hydrated collagen) nc using Eq. (1.151), which was written for the average refractive index of the tissue, n¯ t:
n |
c = |
n¯t − (1 − fc)nis |
, |
(3.1) |
|
||||
|
fc |
|
||
where fc is the volume fraction of the hydrated collagen and nis is the refractive index of the interstitial fluid. The refractive indices measured for the dry corneal collagen and for the interstitial fluid are: ndryc = 1.547 and nis = 1.345–
Tissue Optics: Light Scattering Methods and Instruments for Medical Diagnosis |
261 |
Figure 3.4 Collagen fibrils in the human sclera.762 Scleral collagen fibrils display various diameters. They are much larger than those in the cornea. Mf is the microfibril (×18,000, scanning electron microscopy).
1.357.432,433,435,723,778,780 The refractive index of the corneal stroma measured for many species is n¯ t = 1.375 ± 0.005.778 Therefore, for nis = 1.356 and fc = 0.32,
corresponding to a tissue hydration of 76.2% and a collagen content of 61.3% of the dry weight,778 on the basis of Eq. (3.1), it is easy to obtain the refractive index of the hydrated fibrils as nc = 1.415. The direct measurement of the average refractive index of sclera using an Abbe refractometer gives n¯ t = 1.385 ± 0.005 for λ = 589 nm. Because of the similarly fibrous nature of the cornea and the sclera, it is expected that at equal hydration the refractive indices of scleral collagen and its interstitial fluid should be equal to these indices in the cornea. For n¯ t = 1.385, nis = 1.345, and fc = 0.31, corresponding to a tissue hydration of 68% and a collagen content of 75% of the dry weight, it follows from Eq. (3.1) that for the refractive index of the scleral fibrils, nc = 1.474. Changes of nc and fc with hydration can be evaluated from measurements of the refractive index and the thickness of the collagen films.764
262 Optical Properties of Eye Tissues
Although both tissues are composed of similar molecular components, they have different microstructures and thus very different physiological functions. The cornea is transparent, allowing for more than 90% of the incident light to be transmitted. The collagen fibrils in the cornea have a much more uniform size and spacing than those in the sclera, resulting in a greater degree of spatial order in the organization of the fibrils in the cornea compared with the sclera. The sclera of the eye is opaque to light; it scatters almost all wavelengths of visible light and thus appears white.
Light propagation in a densely packed disperse system can be analyzed using the radial distribution function g(r), which statistically describes the spatial arrangement of particles in the system. The function g(r) is the ratio of the local number density of the fibril centers at a distance r from a reference fibril at r = 0 to the bulk number density of fibril centers.433 It expresses the relative probability of finding two fibril centers separated by a distance r; thus, g(r) must vanish for values of r ≤ 2a (a is the radius of a fibril—fibrils cannot approach each other closer than touching). The radial distribution function of scattering centers g(r) for a certain tissue may be calculated on the basis of tissue electron micrographs (see Figs. 3.3 and 3.4).
The technique for the experimental determination of g(r) involves counting the number of particles, placed at a specified spacing from an arbitrarily chosen initial particle, followed by statistical averaging over the whole ensemble. In a two-dimensional case, the particle number N at the spacing from r to r + r is
related to the function g(r) by the following equation: |
|
N = 2πρg(r)r r, |
(3.2) |
where ρ is the mean number of particles for a unit area.
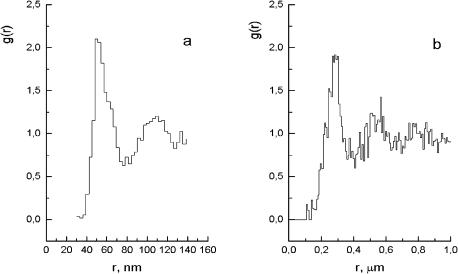
The radial distribution function g(r) was first found for rabbit cornea by Farrell et al.433 Figure 3.5(a) depicts a typical result for one of the cornea regions, which was obtained by determining the ratio of the local mean density of the centers as a function of radii taken from 700 fibril centers. The function g(r) = 0 for r ≤ 25 nm, which is consistent with a fibril radius of 14 ± 2 nm, can be calculated from the electron micrograph.433 The first peak in the distribution gives the most probable separation distance, which is approximately 50 nm. The value of g(r) is essentially unity for r ≥ 170 nm, indicating that the fibril positions are correlated over no more than a few of their nearest neighbors. Therefore, a short-range order exists in the
system.
Similar calculations for several regions of human eye sclera439,798 are illustrated in Fig. 3.5(b). Electron micrographs from Ref. 762, averaged for 100 fibril centers, were processed (see Fig. 3.4). The function g(r) for the sclera was obtained on the basis of the spatial distribution of the fibril centers, neglecting discrepancies in their diameters. Some noise is due to the small volume of statistical averaging. The obtained results present evidence of the presence of a short-range order in the sclera, although the degree of order is less pronounced than in the
Tissue Optics: Light Scattering Methods and Instruments for Medical Diagnosis |
263 |
Figure 3.5 Histograms of radial distribution functions g(r) obtained from electron micrographs of rabbit cornea (a)433 and human sclera (b).439,798
cornea. The function g(r) = 0 for r ≤ 100 nm, which is consistent with the mean fibril diameter of ≈ 100 nm derived from the electron micrograph (see Fig. 3.4).762 The first peak in the distribution gives the most probable separation distance, which is approximately 285 nm. The value of g(r) is essentially unity for r ≥ 750 nm, indicating a short-range order in the system. The short-range order, being characterized by a ratio of this specific distance (decay of spatial correlation) to the most probable particle separation distance, (750/285) ≈ 2.7, is smaller than the similar ratio for the cornea, (170/50) = 3.4.
The spatial density (refractive index) fluctuations of a tissue can also be analyzed by resolving 2D profiles of refractive index variations into Fourier components, which provides a basis for a detailed and quantitative description of the microstructure.779,787 These Fourier components represent the predominant spatial density fluctuations and the structural ordering. A comparable study of human cornea and sclera has shown that cornea reveals much less collagen fibril spacing and greater spatial order than sclera.
The eye lens is also an example of a tissue in which the short-range spatial order is of crucial importance. Because of its high index of refraction and transparency, a lens focuses light to form an image at the retina (see Fig. 3.1). The eye lens material exhibits a certain viscosity that is capable of altering its radius of curvature and thus its focal length through the action of accommodating muscles. The
healthy human lens is a coherent structure containing about 60% water and 38% protein.789–797 The lens consists of many lens fiber cells. The predominant dry
components of a mammalian lens are three kinds of structural proteins, named α-, β-, and γ-crystallins, and their combined weight accounts for about 33% of the total weight of the lens.619 The crystalline lens grows throughout life and in addition
264 |
Optical Properties of Eye Tissues |
undergoes a variety of biochemical changes as one ages. These changes include the possibility of age-related cataract formation, leading to greatly increased light scatter and coloration, and eventually to lens opacity. Photooxidation of lens proteins by chronic UV, UVA, or visible light results in oxidized forms of these proteins, which cross-link to other proteins, causing opacities or pigment formation.800 The
light scattering is caused by random fluctuations in the refractive index. These fluctuations can be density or optical anisotropy fluctuations.64,397,401,402,409,789,791,795
Fluctuations in the refractive index due to density may arise because of (1) aggregation of lens proteins, (2) microphase separation (cold-induced cataract), or
(3) syneresis (water is released from the bound state in the hydration layers of lens proteins and becomes bulk water; this increases the refractive index difference between the lens proteins and the surrounding fluid). Analyses of polarized light scattering of human cataracts have shown that 15 to 30% of the turbidity results from optical anisotropy fluctuations.
Eye lens transparency can be explained by a short-range ordering in the packing structure of the lens proteins. This idea was first suggested by Benedek.801 The primary role among the ocular lens proteins is played by the water-soluble α-crystallin, which has a shape that is close to spherical with a diameter of about
17 nm. Studies of lens transparency, birefringence, and optical activity are of importance to the facilitation of early diagnosis of cataracts.619,789–797,800–804
The types of fiber cell disruption due to cataract formation include intracellular globules, clusters of globules, vacuoles with the contents wholly or partially removed, clusters of highly curved cell membranes, and odd-shaped domains of high or low density.797 These spherical objects are variable in size (often in the range 100 to 250 nm) and occur in clusters that create potential scattering centers.
Optical models of the eye tissues have the following specific features:
•Optical inhomogeneity gives rise to light scattering.
•The mean distance between scatterers and their dimensions are less than or comparable with the wavelength.
•Scattering particles are “soft,” i.e., the refractive index of their material,
ns, is close to the refractive index of the ground (interstitial) substance, n0 (ns ≥ n0).
•In the major cases, absorption is small.
•Transparent tissue has an approximately monodispersive and ordered structure.
The major structural characteristics of the human eye tissues are summarized in Table 3.1.
3.1.2 Tissue ordering
A certain correlation exists between waves scattered by adjacent particles in a densely packed medium that has characteristic dimensions on the order of a wavelength. Therefore, it is necessary to sum the amplitudes of scattered waves with

Table 3.1 Structural and optical properties of human eye tissues (the refractive index of the ground (interstitial) substance n0 = 1.345).
Tissue |
Model |
Tissue |
Diameter of |
Refractive index |
Multiplicity |
|
|
thickness, mm |
scatterers, nm |
of scatterers, ns |
of scattering |
Cornea |
Monodispersive system |
0.46–0.52 |
30.8 ± 0.8 |
1.470 |
Single or |
|
of regularly distributed |
|
|
|
low-step |
|
long dielectric cylinders |
|
|
|
|
Sclera |
Polydispersive system |
0.3–1.8 |
25–230 |
1.474 |
Multiple |
|
of randomly distributed |
|
|
|
|
|
long dielectric cylinders |
|
|
|
|
Normal |
Monodispersive system |
5.0 |
20–200 |
1.380 |
Single or |
lens |
of regularly distributed |
|
|
|
low-step |
|
dielectric spheres |
|
|
|
|
Cataract |
Two-phase system of |
5.0 |
200–2000 |
1.40–1.48 |
Low-step or |
lens |
randomly distributed |
|
|
|
multiple |
|
dielectric spheres |
|
|
|
|
|
|
|
|
|
|
Diagnosis Medical for Instruments and Methods Scattering Light Optics: Tissue
265

266 Optical Properties of Eye Tissues
regard to their phase relations. The interference interaction may result in an essential alteration of the total scattered intensity, of its angular dependence, or of the polarization characteristics of the scattered light as compared with similar quantities for a system of noninteracting particles.
To illustrate light scattering in a correlated disperse system, we will use a radial
distribution function g(r), which is a statistical characteristic of the spatial arrangement of the scatterers129,433 (see Fig. 3.5). Let us consider N spherical particles in
a finite volume. The pair distribution function gij (r) is proportional to the conditional probability of finding a particle of type j at distance r from the origin, given that there is a particle of type i at the origin (Fig. 3.6).805 In a model of mutually impenetrable (hard) spheres, the interparticle forces are zero, except for the fact that two neighbor particles cannot interpenetrate each other.
The arrangement of particles in a densely packed system is not entirely random. A short-range order can be observed that is more ordered when the density of the scattering centers is greater and their size distribution is narrower. Near the origin of the coordinates, in the region within the effective particle diameter, the function g(r) = 0, which points to the impenetrability of a particle. Function g(r) has a few maxima whose positions correspond to distances from the chosen particle to its first, second, etc., neighbors. Nonzero values of minima are indicative of a particle distribution between various coordination spheres. It is obvious that the correlation between the pairs of particles should be degraded with r; hence, limr→∞ g(r) = 1. Function g(r) is the ratio of the local number density of the scattering centers at a distance r from an arbitrary center to the bulk number density.
The medium composed of N scatterers considered here is analogous to an ensemble mixture of L types of particles in the study of statistical mechanics, by considering the dynamics and positions of the particles with regard to the interparticle forces. Studies have been made in obtaining the pair distribution functions using various approximate theories. One of the important results is based on the PercusYevick (PY) approximation. As applied to a model of hard spheres distributed in a three-dimensional space, there exists an analytical solution of this equation. To find the function of radial distribution, the Monte Carlo method is also used. The solution of the Ornstein-Zernice equation for the case of single species has been solved by Wertheim.806 For the case of two species, the solution can be found in Ref. 807. For the general case of L species, the solution based on a generalized Wiener-Hopf technique is obtained by Baxter.808 The polydispersity of the real system is approximated by an L-step distribution function.
For monodisperse systems of spherical particles with a diameter of 2a, g(r) is
represented by an approximation of the hard spheres as follows:809 |
|
||||||
g(r) = 1 + |
1 |
0 |
∞ H32(z) |
sin zx |
z2dz, for x > 1, |
(3.3) |
|
4πf |
|
1 − H3(z) |
zx |
||||
Tissue Optics: Light Scattering Methods and Instruments for Medical Diagnosis |
267 |
Figure 3.6 Diagram of the radial distribution function g(r), which is proportional to the probability of particle displacement at a certain distance r from an arbitrarily fixed particle.805
where x = r/2a, |
|
|
|
|
|
|
|
|
|
|
|
|
|
|
|
|
||||
H3(z) = 24f 0 |
c3(x) |
zx |
x2dx, c3(x) = −α − βx − δx3 |
, |
(3.4) |
|||||||||||||||
|
|
|
|
|
|
1 |
|
sin zx |
|
|
|
|
|
|
|
|
|
|
|
|
α |
= |
|
(1 + 2f )2 |
, |
β |
6f |
(1 + 0.5f )2 |
, δ |
|
1 |
f |
(1 + 2f )2 |
, |
(3.5) |
||||||
|
|
|
|
|||||||||||||||||
|
(1 |
− |
f )4 |
|
= − |
(1 |
− |
f )4 |
|
= 2 |
|
(1 |
− |
f )4 |
|
|
||||
|
|
|
|
|
|
|
|
|
||||||||||||
where f is the volume fraction of the particles.
Let us consider light scattering by a system of N spherical particles.442 In general, the field affecting a particle differs from the field of the incident wave Ei since the latter also contains the total field of adjacent scatterers. Within the single-scattering approximation (Born’s approximation), the field that affect the particle does not essentially differ from that of the initial wave. In cases where double scattering of the field affects the particle, one needs to take the sum of the initial field plus the single-scattered field, and so on.75 For transparent tissues composed of optically soft quasi-regularly packed par-
ticles, the use of the single-scattering approximation yields quite satisfactory
results.10,24,63,64,77,129,399,402,403,433,435,436,440,780,789,791,801,802
A field scattered by a particle with the center defined by radius vector rj differs from one scattered by a particle placed at the origin of the coordinates by a phase
268 Optical Properties of Eye Tissues
multiplier characterizing the phase shift of the waves. The phase difference is equal
to (2 |
π |
λ)(S |
− |
|
|
, where S |
and S |
are the unit vectors of the directions of |
|
|
S )r |
j |
|||||||
/ |
0 |
|
1 |
|
0 |
1 |
|
||
the incident and the scattered waves (see Fig. 1.23). The difference between these vectors is called the scattering vector q:
= |
λ |
& 0 |
− 1 |
' |
|
q |
2π |
S |
S |
. |
(3.6) |
|
Taking into account that the wave vector module is invariable with elastic scattering, the value of the scattering vector is found as follows:
|q| ≡ q = |
4λ sin |
2 |
, |
(3.7) |
|
|
π |
|
θ |
|
|
where θ is the angle between directions S |
and |
S |
i.e., it is the scattering angle. |
||
|
0 |
1, |
|
||
The amplitude of a wave scattered by a system of N particles will be
NN
$ |
$ |
|
Es = Esj = |
E0j eiqrj , |
(3.8) |
j =1 |
j =1 |
|
where E0j is the scattering amplitude of an isolated particle. The single-scattering intensity for the given spatial realization of the N particle arrangement is
NN
|
|
|
|
|
$ |
|
$ |
|
I |
= | |
Es |
| |
2 |
= |
E j |
E eiq(rj −ri ). |
(3.9) |
|
|
|
0 |
0i |
|
|||
|
|
|
|
|
j =1 |
|
i=1 |
|
For real systems, the only mean scattering intensity of an ensemble of particles is detected; the natural averaging is caused by thermal particle motion, finite measuring time, and a finite area of a photodetector, thus
I = |
. N N |
E0j E0i eiq(rj −ri )/. |
(3.10) |
|
$$ |
|
|
j =1 i=1
The brackets show the averaging over all possible configurations of the particle arrangement in the system. This equation represents the sum of the two contributions to the noncoherent scattered intensity. One defines the light distribution on the assumption that there is no interference of light scattered by various particles. The other term regards the interference affect on the light field structure and depends on the degree of order in the particle arrangement that is characterized by the radial distribution function g(r). For an isotropic system of identical spherical particles, we may write436
I = |E0|2N S3(θ), |
(3.11) |

Tissue Optics: Light Scattering Methods and Instruments for Medical Diagnosis |
269 |
|||||||
|
|
*1 + 4πρ |
|
R |
sin qr |
|
+, |
|
S3 |
(θ) = |
0 |
r2[g(r) − 1] |
qr |
dr |
(3.12) |
||
|
|
|
|
|
|
|
|
|
where q is defined by Eq. (3.7), ρ is the mean density of particles, and R is the distance for which g(r) → 1. Quantity S3(θ) is the 3D structure factor. This factor describes the alteration of the angle dependence of the scattered intensity that appears with a higher particle concentration (Fig. 3.7). To approximate the hard spheres used for the derivation of Eq. (3.12), the structure factor is defined as
S3(θ) = |
1 |
(3.13) |
1 − H3(q) , |
where H3(q) is defined by Eq. (3.4).
Figure 3.7 The structure factor S3(θ) [Eq. (3.12)] as a function of the scattering angle θ and particle radius a; the wavelength 633 nm; the volume fraction f = 0.4; the relative refraction index m = 1.105 (calculated by I. L. Maksimova).
For small particle concentrations, the approximation of the excluded volume is applicable: g(r) = 0 for r that are shorter than the particle diameter and have unity over long distances. In this approximation, the structure factor for a system of spherical particles takes the form that was first discovered by Dirac as442
S3(θ) = 1 − f (qa), |
(3.14) |
where a is the particle radius and (qa) is the function defined by the following equation:
(qa) |
= |
|
3(sin qa − qa cos qa) |
. |
(3.15) |
|
|||||
|
|
(qa)3 |
|
||

270 |
Optical Properties of Eye Tissues |
Function (qa) modulates the angular dependence of the scattering intensity by diminishing its value at small angles and generating a diffusion ring at 10-deg angles for particle dimensions comparable with the wavelength.
For the case of infinitely long identically aligned cylinders with a radius a and a light that is incident normally to their axes, the 2D structure factor is defined within the approximation of a single scattering as follows:
S2(θ) = *1 + 8πa2ρ |
0 |
[g(r) − 1]J0 |
2 |
λa r sin |
2 |
dr+, |
(3.16) |
|
|
|
R |
|
|
π |
θ |
|
|
where R is the distance for which g(r) → 1. Since the light is incident perpendicularly to the cylinder axis, the scattered light propagates only in the direction perpendicular to the axis.
For a very small concentration of particles, the structure factor is nearly a unit and the intensity of scattering by a disperse system is essentially a sum of the contributions of the independent scatterers. For systems of small soft particles, the structure factor only changes slightly as a function of the scattering angle. Therefore, the particle interaction reveals itself mainly by a uniform decrease in scattering intensity in all directions for linearly polarized and unpolarized incident light (see Figs. 3.8 and 3.9). For systems of large particles, the structure factor is noticeably less than a unit only in the region of small scattering angles (see Figs. 3.10 and 3.11). The interference interaction of scatterers in some angular bands reduces the scattering intensity and in the other bands the scattering intensity is raised as compared with that for a system of an equivalent number of independent particles (Fig. 3.11). In general, particle interaction makes the angular dependence of the scattering intensity more symmetric with less overall scattered intensity, and therefore allows much more collimated transmittance for both small and large soft particles.
Figure 3.8 The calculated angular dependences of the scattered intensity for a system of small spherical particles, 20-nm radius; the incident wave is linearly polarized (a) parallel with or (b) perpendicular to the scattering plane; dotted line—independent particles; wavelength, 633 nm; volume fraction, f = 0.1; relative refraction index, m = 1.105 (calculated by I. L. Maksimova).

Tissue Optics: Light Scattering Methods and Instruments for Medical Diagnosis |
271 |
Figure 3.9 The calculated angular dependences of the scattered intensity for a system of small spherical particles, 50-nm radius; the incident wave is unpolarized; dotted line—independent particles; wavelength, 633 nm; volume fractions, (a) f = 0.04 and
(b) f = 0.1; relative refraction index, m = 1.105.442
Figure 3.10 The calculated angular dependences of the scattered intensity for a system of large spherical particles, 500-nm radius; the incident wave is linearly polarized (a) parallel with or (b) perpendicular to the scattering plane; dotted line—independent particles; wavelength, 633 nm; volume fraction, f = 0.4; relative refraction index, m = 1.105 (calculated by I. L. Maksimova).
The scattering strongly deforms the spectral tissue characteristics because the extinction of transmitted light is defined not only by the absorption factor as a function of the wavelength, but also by a light fraction taken away from the beam because of the scattering. The latter process depends complexly on the wavelength, structure, and size of the particles.
The spectrum of collimated transmission of a disperse layer is interpreted as a spectral dependence of a weaker coherent component of light. Finding the coherent component of light, scattered at a system of inhomogeneities correlated in the space, is a complicated physical task exhibiting all of the difficulties inherent in the problem of light propagation through a system of many bodies.809 Assuming that the intensity of the coherent light component Ic is reduced with a longer distance
272 |
Optical Properties of Eye Tissues |
Figure 3.11 The calculated angular dependences of the scattered intensity for a system of large spherical particles, 500 nm radius; the incident wave is unpolarized; dotted line—independent particles; wavelength, 633 nm; volume fractions, (a) f = 0.04 and
(b) f = 0.4; relative refraction index, m = 1.105.442
d by the exponent law due to scattering and absorption, the disperse layer collimated transmittance would be described by the Bouguer-Beer-Lambert law [see Eq. (1.1)] as
Tc(λ0, d) ≡ [Ic(λ0, d)/I0(λ0)] exp[−ρsσext(λ0)d], |
(3.17) |
where σext is the extinction cross section of an individual particle of the layer [see Eq. (1.4)]. For small volume concentrations (ρs), it is equivalent to the extinction cross section of an independent particle. For greater f values, the quantity σext is determined not only by the properties of single particles, but also by their concentration. Within the assumption that the absorption cross section σabs is independent of the packing density, σext may be calculated as a sum of σabs for the independent particle and the scattering cross section σsca obtained by taking into consideration the correlation of scatterers.
With the measuring of the scattered intensity angular distribution of the particle system, one would calculate the scattering cross section of a single particle of the system. Having integrated the scattering intensity over all directions in the space, the total energy scattered by the system can be found. The scattering cross section for the system of spherical particles is obtained similarly to Eq. (1.6); however, to calculate the scattering cross section of a single particle of the system, the scattered intensity must be divided by the particle number N and corrected by using the 3D or 2D structure factor S3 [Eq. (3.12)] or S2 [Eq. (3.16)].
The scattering cross section for the system of rods (cylinder particles) sca (cm), illuminated by a plane incident wave of intensity I0 in the direction normal to the cylinder axis, is defined by numerically integrating over all possible scattering
Tissue Optics: Light Scattering Methods and Instruments for Medical Diagnosis |
273 |
|||
directions in plane perpendicular to the cylinder axis:148 |
|
|||
|
2π |
2π |
|
|
sca = |
|
0 |
I (θ)dθ, |
(3.18) |
λI0 |
||||
where I (θ) is the angular distribution of the scattered intensity of a system of N particles. Dividing sca by the particle number N , one may find the scattering cross section σsca for a single particle of the system. For an interacting particle system, the result obtained may differ substantially from the scattering cross section of an independent particle.
Even the scattering cross section for an independent particle sized on the order of a wavelength has a very strong nonmonotonous dependence on the wavelength. Effects associated with dense packing also have a substantial dependence on the wavelength. As a result, the transmission spectra for a system of identical particles can differ highly depending on the packing density and its degree of order. Wonderful examples are the transmission spectra of the cornea in the norm and with turbidity caused by a disrupted spatial degree of order and by appearing regions denuded of fibrils, the so-called lakes.435
The extinction of a collimated incident beam due to scattering, even in systems of nonabsorbing particles, would result in a substantial difference in the transmittance in different spectral regions. The values of the real and imaginary part of the indices of refraction depend weakly on the wavelength far from the absorption bands and they may be assumed to be constant under calculation. In systems of small nonabsorbing particles, the interference interaction causes the shift of the short-wavelength transmission spectrum boundary to a smaller wavelength and a slightly greater steepness of the spectrum.442 If a scattering system is formed by particles whose sizes are comparable with the light wavelength, then the spectrum of this system would be nonmonotonous, even with no absorption. In the vicinity of the absorption bands, the real and imaginary parts of the complex index of refraction of the particle substance [see Eq. (1.192)] show a pronounced spectral dependence, which determines the specificity of transmission spectra for systems of differently sized particles, with the imaginary part of refractive index usually described by the Lorentz contour.442 The scattering deforms the symmetric contour of the absorption line and the spectra appear essentially different for systems of small and big particles with varying packing densities.
In general, this is typical for spectroscopy of tissue or blood when an absorbing band of a chromophore (hemoglobin) is detected on the background of the scattering part of the spectrum. For example, evaluation of hemoglobin saturation by oxygen in tissues is the problem that is usually solved by the exclusion of the scattering part of measured tissue spectra. The calculated transmission spectra also explain a phenomenon of substantial difference of spectra for the whole blood, where hemoglobin with a high index of refraction and strong absorption band is concentrated in erythrocytes (system of big particles with absorption), and for hemolyzed blood, where only small particles (blood residuals—cell skeletons, etc.) scatter light.
274 |
Optical Properties of Eye Tissues |
For the densely packed system of large weakly refracting particles, the following equation was obtained in Ref. 810 within the approximation of hard spheres and neglecting of mutual particle radiation for the coherent transmission of a layer with thickness d:
Tc = 1 − |
2b σ |
+ |
|
b2 2λ |
d/2a |
(3.19) |
|||||
(1 + b) πa2 |
(1 + b)2 πa3 σscaI1(0) |
, |
|||||||||
|
|
|
ext |
|
|
|
|
|
|
|
|
where b = 1.5f exp(1.5f ) and I1(0) is the intensity of forward scattering by an individual particle of radius a. This formula is transformed into Bouguer’s law [see Eq. (3.17)] for the scattering systems of noninteracting particles at the rarefaction of the scattering layer.
Not only coherent weakened light, but also a portion of noncoherently scattered light is usually recorded in real experiments owing to the finite angular aperture of the receiving unit. For this reason, a transmittance called the instrumental transparency, which is found experimentally, is somewhat different from the coherent transmission Tc.
For the first time, the approximation regarding the near-order degree of tissue arrangement has been used to describe light propagation in the cornea with calculating its transmission spectrum by the authors of Refs. 432, 433, and 435. The near order in the arrangement of scattering particles and the related interference
interaction of scattered light are the course of the high transparency of the human eye’s cornea and lens in their normal state.63,64,802
The light-scattering intensity angular dependences for systems of spherical and cylindrical particles in the single-scattering approximation are described by Eqs. (3.11), (3.12), and (3.16). The structure factor, which transforms these dependences, is defined by the spatial particle arrangement, and it is independent of the state of light polarization. Therefore, for systems of identical particles, when the single scattering approximation is valid, the angular dependences of all of the elements of the light-scattering matrix (LSM) are multiplied by the same quantity, accounting for interference interaction [see Eq. (3.11)], as
Mij (θ) = Mij0 (θ)N S3(θ), |
(3.20) |
where Mij0 (θ) is the LSM element for an isolated particle. Consequently, the LSM for the system of monodispersive interacting particles coincides with that of the isolated particle [see Eq. (1.72)] if normalization to the magnitude of its first element M11 is used.
Unlike in monodispersive systems, in differently sized densely packed particle systems, the normalization of the matrix elements to M11 does not eliminate the influence of the structure factor on the angular dependences of the matrix elements. In the simplest case of a bimodal system of scatterers, expressions analogous to Eqs. (3.12) and (3.16) can be found using four structural functions, g11(r), g22(r), g12(r), and g21(r), which characterize the interaction between particles of similar
Tissue Optics: Light Scattering Methods and Instruments for Medical Diagnosis |
275 |
and different sizes.436 A bimodal system formed by a great number of equally sized small particles, and a minor fraction of coarse ones, provides a good model of pathological tissue, e.g., a cataract eye lens.
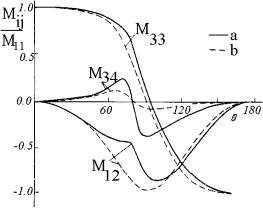
Figure 3.12 depicts the calculated results for the LSM elements for a binary mixture of spherical particles with two different diameters, 60 and 500 nm, and corresponding volume fractions of f1 = 0.3 and f2 = 0.02.436 For comparison, the LSM elements’ angular dependences for the same binary mixture, neglecting cooperative effects, have also been calculated. It is seen from the figure that the normalized LSM elements of a dense binary mixture are substantially altered due to the interference interaction. As a consequence, the results of the solution of the inverse problem for the experimental LSM of a dense mixture, neglecting the cooperative effects, should yield an overestimated value for the relative fraction of large particles. The LSM variations due to cooperative effects are of a more complicated nature for a binary system whose two components are sized on the order of the wavelength of incident light, and they could not be interpreted as uniquely as those in the preceding case. Numerical estimates for binary systems of different compositions show436 the considered effects to be of the most crucial importance for the LSM in the visible region for the mixtures of particles with 2a1 < 200 nm and 2a2 > 250 nm.
Figure 3.12 The LSM elements’ angular dependences for a binary mixture of spherical particles.436 Calculated taking into account particle interactions (solid lines), and neglecting cooperative effects (dashed lines). Particle diameters, 2a1 = 60 nm and 2a2 = 500 nm; volume fractions, f1 = 0.3 and f2 = 0.02; relative index of refraction, m = 1.07; wavelength, 633 nm.
Unlike the transmission spectra, the spectral dependences of the intensity of light scattered in different directions are poorly studied. This is related, on the one hand, to experimental difficulties due to the need for standard spectral devices to be modernized. On the other hand, an additional problem of correct comparison of different experimental results arises with examining the scattering spectra because the form of the scattering spectrum depends substantially on the macrogeometry of
276 |
Optical Properties of Eye Tissues |
the sample and measuring system. Nevertheless, the scattering spectra are of great
interest.47,58,94–96,150–153,163,166,170,173,180,736,790 The authors of Ref. 736 deal with
the absorption and scattering spectra of the chest muscle of a chicken in the visible range. The scattering spectra visually define the observed tissue color, and they can be employed for express estimating its state. For example, one traditional method for eye ocular lens diagnostics assumes the observation of varying color characteristics for light scattered at different angles. The theoretical background for quantitative analysis of scattering spectra and color formation by eye lens (presented as a model of dispersive system of spherical particles with low absorption) and in vitro measured scattering spectra of the human eye lens are given in Ref. 811. The age-related alterations of the eye lens particle composition and corresponding transmittance and light-scattering spectra are modeled173 and compared with experimental data from Ref. 790.
The spectral characteristics vary most strongly with high packing densities because the volume fraction occupied by particles exceeds 50%. For these dense systems, the considered approximation of single scattering is incorrect and it is necessary to account for the effects of the reradiation of the particles.
3.2 Spectral characteristics of eye tissues
The collimated transmission spectrum of a tissue layer of thickness d with a mean density ρs of scattering particles with absorption is defined by Eq. (3.17), where Ic(λ0) is the spectrum of the transmitted intensity detected in a far field using a pinhole; the scattering cross section σsca for a given scattering model can be calculated using Eq. (1.6) for the corresponding angular dependence of the intensity scattered by a particle, I (θ). In the framework of Mie theory, the scattering and the absorption cross sections can be calculated using Eqs. (1.192)–(1.94). For example, for unpolarized collimated light incidence on a system of Mie particles, the scattered intensity is defined as
I (θ, λ0) ≈ N &|S1|2 + |S2|2', |
(3.21) |
where N is the number of spherical particles and the S1 and S2 functions are defined by Eq. (2.11). Particle interaction can be accounted for using Eqs. (3.11), (3.12), and (3.16). The simpler Eq. (3.19) also can be used.
In turn, the transmission spectrum when a measuring system with a finite angle of view is used (a collimated light beam with some addition of a forward scattered
light in the angle range 0 to θ is detected) is defined by |
|
|||||
Tθ(λ0) = Tc(λ0) + |
I0 |
(λ0) |
θ I (θ, λ0)d , |
(3.22) |
||
|
|
|
1 |
|
|
|
where is the solid angle in steradians.
Tissue Optics: Light Scattering Methods and Instruments for Medical Diagnosis |
277 |
The total transmission spectra Tt(λ0) and the spectrum of light scattered under the angle (θ + dθ), Rθ(λ0) can be calculated using the following definitions:
Tt(λ0) = Tc(λ0) + I0 |
(λ0) 2π I (θ, λ0)d , |
(3.23) |
|||||||
|
|
|
|
|
1 |
|
|
|
|
Rθ(λ0) = |
I0 |
(λ0) |
θ |
θ |
+ |
dθ |
(3.24) |
||
|
I (θ, λ0)d . |
||||||||
|
|
|
1 |
|
|
|
|
|
|
Corneal transmittance was calculated using a model monodisperse system of long dielectric nonabsorbing cylinders (fibrils) of 26 nm in diameter and with a refractive index nc = 1.470. The cylinders were regularly oriented parallel to the corneal surface in the ground matter (n0 = 1.345). Figure 3.13 demonstrates the transmittance anisotropy for linearly polarized radiation and the marked effect of scattering on corneal transmittance in the UV spectral region. The corneal transparence in the visible range is explained by the high degree of its fibrils’ arrangement, so the diffuse light intensity decreases owing to interference along all directions (destructive interference), except the incident light direction (constructive interference). The effect of scattering is the most essential in a short-wavelength region and defines small UV radiation transmittance of the cornea, which is approximately 50% for 320 nm. It should be noted that in the UV range, light extinction is defined not only by scattering; the absorption bands of water and proteins provide a very strong extinction as well (see Figs. 1.3 and 1.5).
Figure 3.13 Collimated transmittance spectra of human cornea: I , I , and I are calculated spectra for two orthogonal states of linear polarization and unpolarized light. Light polarization is parallel, I , to the fibrils (calculations were made for the light normally incident on the corneal surface; they are valid for the peripheral conical portion where the fibrils are similarly oriented in tissue layers). The cornea is 0.46-mm thick, with a scatterer density
ρs = 3 × 1010 cm−2. The dotted line shows the experimental data for unpolarized light. The circles are measurements for two orthogonal states of polarization at λ = 633 nm.63
278 |
Optical Properties of Eye Tissues |
Disordering of the fibrils’ arrangement (for example, after keratotomy) results in a decrease in corneal transmission, especially for the short wavelengths (Purkinje’s effect).63 Another essential feature of the cornea is the presence of a preferable direction of the fibrils’ alignment. The results of such anisotropy are the form birefringence and dichroism of the cornea.63 The transmission spectrum substantially depends on the orientation of the polarization vector of the linear polarized light relative to the collagen fibrils; light polarized along fibrils is scattered more effectively. As follows from calculations and measurements presented in Fig. 3.13, the peripheral corneal polarization sensitivity in the UV region (320 nm) is about fivefold higher than in the red region (633 nm). In the Rayleigh limit (λ 2a), the form birefringence is defined by Eq. (1.53). The birefringence can be high for small-diameter cylinders and goes to zero for a system that consists of parallel cylinders with large diameters (2a ≥ λ).402
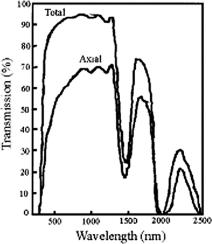
The total and collimated (axial) experimental transmission spectra for the human cornea are presented in Fig. 3.14. They illustrate well that the cornea scatters light since the total and axial transmissions are not identical. Water absorption peaks are evident at 300, 980, 1180, 1450, 1900, and 2940 nm (see Fig. 1.3);812 they provide poor transmission in the cornea in the UV and IR spectral regions.
Figure 3.14 Total and axial (collimated) transmission through human cornea.812
No age effect was found when corneal transmittance in the spectral range 320 to 700 nm on 10 aphakis subjects (14 to 75 yr) was measured.813 The average
spectral transmittance derived from these measurements was modeled by the following functions for the total transmittance (acceptance angle close to 180 deg) and on-axis transmittance (acceptance angle on the order of 1 deg):
t |
(λ) |
= − |
0.016 |
− |
21 |
× |
108 |
0 |
(3.25) |
log T |
= − |
− |
× |
λ−4, |
|||||
c |
(λ) |
0.016 |
85 |
108 |
0 |
(3.26) |
|||
log T |
|
|
|
λ−4, |
where λ0 is the wavelength in nanometers.

Tissue Optics: Light Scattering Methods and Instruments for Medical Diagnosis |
279 |
The lens is less transparent than the cornea. The visible light passing through the human lens undergoes an appreciable degree of both scattering and absorption by different chromophores, including protein-bound tryptophane, 3-hydroxy- L-kynurenine-O-β-glucoside (3-HKG), and age-related protein (responsible for lens yellowing in aged subjects) (Fig. 3.15).800 The 3-HKG content slightly decreases with age. In the single-scattering model being examined, absorption is taken into account by introducing a complex refractive index for the scatterers24 [see Eq. (1.192)] as
n |
(λ |
) |
= |
n |
+ |
in |
= |
n |
i |
tn |
(λ |
) |
+ |
kn |
(λ |
) |
+ |
pn |
(λ |
) |
, |
(3.27) |
s |
0 |
|
s |
s |
s |
+ [ |
t |
0 |
|
k |
0 |
|
p |
0 |
] |
|
|
where the coefficients t, k, and p characterize the contribution of each chromophore to absorption.
Figure 3.15 The main species in the human lens that absorb light transmitted by the cornea: protein-bounded tryptophan (TRP), 3-hydroxy-L-kynurenine-O-β-glucoside (3-HKG), and aged lens protein (AP).800
Age-related changes in the lens optical properties are, as a rule, due to the
appearance of scatterers with increased diameters and refractive index, and also to the enhanced content of age-related protein.24,64 Figure 3.16 presents colli-
mated transmittance spectra calculated using “young” and “old” lens models. A remarkable difference between the short-wave portions of the two profiles is readily apparent. The total transmittance spectra experimentally obtained for senile and cataractous lenses are shown in Fig. 3.17.24 Age-related variations in the composition of scatterers and absorbers led to significant differences in scattering spectra. There is a qualitative correlation between the experimental findings and the
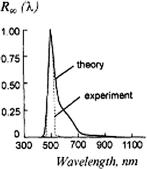
calculated values for both backscattering and scattering at 90 deg (see, for instance, Fig. 3.18).24,173,790

280 |
Optical Properties of Eye Tissues |
(a) |
(b) |
Figure 3.16 Collimated transmittance spectra of the human lens calculated for ordered (1, 3) and disordered (2, 4) scatterers. 1, 2, in the absence of absorption; 3, 4, with absorption: (a) Model of a “young” lens (diameter of scatterers 2a = 20 nm, n = 1.43, t = 0.003, k = 0.005, p = 0). (b) Model of an “old” lens (2a = 40 nm, n = 1.47, t = 0.003, k = 0.002, p = 0.015). Volume density of scatterers fs = 0.3, n0 = 1.345, lens thickness 5 mm.24,173
Figure 3.17 Experimental total transmittance spectra of isolated human lens for normal lens of a 56-year-old subject and a cataractous lens (88 yrs). Measurements were made on a spectrophotometer with an integrating sphere.24
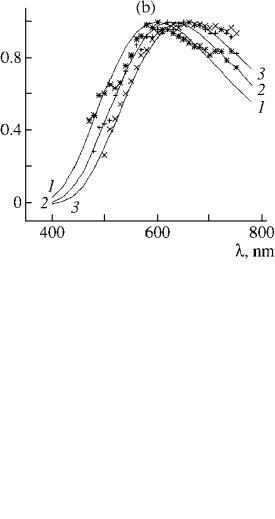
Calculations of the scattering spectra for the eye lens model based on the first order of multiple scattering theory (see Fig. 3.19), which accounts for attenuation of a singly scattered light intensity, and in vitro measured experimental scattering spectra within a whole human cataractous crystallin lens for a certain scattering angle and different locations of a measuring volume also demonstrate the usefulness of scattering spectra for prediction of eye lens pathology.811
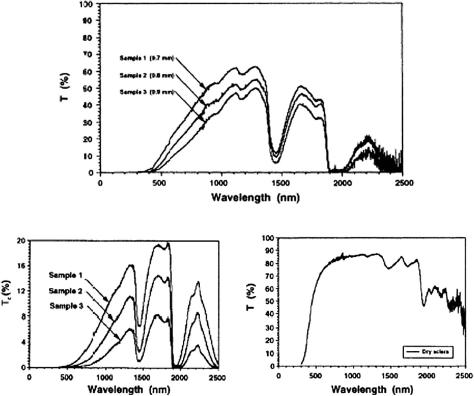
As discussed above, eye sclera is a nontransparent turbid medium, at least in the visible range. Figure 3.20 displays the experimental spectra obtained for three samples of human sclera with different thicknesses, showing its poor transparency
for visible light and a sufficiently high one for the wide bands in the NIR region between absorption bands of water.722,723 In addition, a dry scleral sample has a
high transmittance within a very large spectral band, including visible and IR. The origin of scleral spectra formation can be understood on the basis of light scattering
Tissue Optics: Light Scattering Methods and Instruments for Medical Diagnosis |
281 |
Figure 3.18 Calculated and experimental scattering spectra of the lens at 90 deg (relative units, experimental data from Ref. 790). Calculations were made for a mixture of ordered small particles (99%) having diameter 2a = 60 nm (t = 0.003, k = p = 0.03, n0 = 1.345, n = 1.47) and large disordered particles (1%) (2a = 600 nm, t = 0.003, k = 0, p = 0.1).173
by a system of polydispersive irregularly arranged collagen cylinders immersed in the ground substance with a lower refractive index.798,799 For natural thickness of
0.7–0.8 mm, this tissue shows multiple scattering [Figs. 3.20(a) and 3.20(b)], but the transition from multiple to low-step or even single scattering can be provided
not only by tissue histological cutting, but also at dehydration of a whole tissue sample [Fig. 3.20(c)] or at its impregnation by an immersion liquid.172,798,799 Such
control of tissue scattering properties can be done in vivo; thus, this technology is very attractive for many biomedical applications (see Chapter 4).
3.3 Polarization properties
It has already been shown that light propagation in opaque multiply scattering tissues depends not only on the scattering and absorption coefficients and the scattering phase function, but also on the polarization properties of the tissue. The latter
in turn depend on the scatterers’ size, morphology, refractive index, internal structure, and the optical activity of the material.5,6,10,43,149,181,182,814 The polarization
properties of elastically scattered light are described by a 16-element LSM, each element being dependent on the wavelength, size, shape, and material of the scatterers [see Eqs. (1.69) and (1.70)].
For measurements of the LSM elements of transparent biological tissues
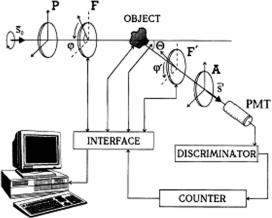
and fluids, computer-controlled laser scattering matrix meters (LSMM) were developed.3,5,6,10,43,64,135,149,380,450,451 The principle of operation of the LSMM5,10,815 (Fig. 3.21), which is the modulation of the polarization of the in-
cident laser beam followed by the scattered light demodulation (transformation of polarization modulation to intensity modulation), is described by the following matrix equation:
S = AF MFPS0, |
(3.28) |
282 |
Optical Properties of Eye Tissues |
Figure 3.19 (a) The scattering spectra calculated in the first order of multiple scattering theory (accounting for attenuation of a singly scattered light intensity within a sample) for different angles: θ = (2) 149 deg and (Q) 90 deg. The particle radius is 25 nm, the radius of the system is 5 mm, and the relative volume of the particles is 0.3. The elementary scattering volume of 1 mm2 is located at a distance l = (1) 0.5 mm, (2) 0.6 mm, and (3) 0.7 mm. (b) The experimental (symbols) and corresponding calculated (1–3) scattering spectra at an angle of 149 deg for a cataractous crystallin lens of a human eye for three different locations of scattering volume: ( , 1) in the vicinity of front surface, (+, 2) in the central part, and (×, 3) in the vicinity of a rare part of the crystallin lens.811
where S and S0 are the Stokes vectors of the recorded and source radiation, respectively; P and A, and F and F are the Mueller matrices for the linear polarizers and the phase plates placed, respectively, ahead of and after the scattering medium. As the phase plates are rotated, the intensity recorded by a photodetector, i.e., the first element of the Stokes vector S, depends on time. By multiplying the matrices in
Tissue Optics: Light Scattering Methods and Instruments for Medical Diagnosis |
283 |
(a)
(b) |
(c) |
Figure 3.20 Transmittance spectra of the human sclera.722,723 (a) Total transmittance for three samples. (b) Axial (collimated) transmittance for the same three samples. (c) Total transmittance of the dry sclera sample.
Eq. (3.28) and performing the appropriate trigonometric transformations, one can show that the output intensity can be represented as a Fourier series, namely,816
K |
|
$ |
|
I = a0 + (a2k cos 2kϕ + b2k sin 2kϕ), |
(3.29) |
k=1
where
N |
N |
|
$ |
$ |
|
a2k = |
I (ϕi ) cos 2kϕi , b2k = I (ϕi ) sin 2kϕi , |
(3.30) |
i=1 |
i=1 |
|
I (ϕi ) is the intensity of the scattered light detected by the photoreceiver for a certain orientation of the fast axis of the first retarder, ϕi , and N is the number of measurements per one rotation cycle of the first phase plate F.
284 |
Optical Properties of Eye Tissues |
Figure 3.21 Scheme of a laser scattering matrix meter (see text for details).5,10
The coefficients of the series described by Eq. (3.29) are defined by the values of the matrix M elements of the object under study, and their measurement ensures a system of linear equations to determine the matrix M. The number of equations and the degree of stipulation for this system of equations are dependent on the choice of the ratio between the rotation rates of the phase plates (retarders). An optimal choice of the rotation rates’ relationship at 1:5 allows an optimally stipulated system of linear equations [K = 12 equations to be derived to find the full matrix M of the object under study using Eq. (3.29)].816
A scheme shown in Fig. 3.21 was designed with the rotating retarders (λ/4- phase plates) that uses a comparatively simple software and allows one to avoid many of the experimental artifacts peculiar to dc measurements and to systems utilizing electrooptic modulators.43 The LSMM has a fixed polarizer P and analyzer A, and two rotating-phase plates F and F ahead and after the sample. The polarizer and analyzer are aligned in parallel with each other and their transmission planes are orthogonal to the scattering plane; the fast optical axis of each of the phase plates F and F forms an angle with the scattering planes ϕ and ϕ ; as a result, respective phase differences δ and δ are induced. The ratio of the rotation rates of the phase plates was taken as equal to 1:5, i.e., ϕ = 5ϕ, because all of 16 matrix elements are uniquely determined in this case. The computer-controlled LSMM provides the automatic scattering angle scanning in the range 0 ± 175 deg with a step of 4 and accuracy of 5 . A single-mode stable He:Ne laser (633 nm) was used as a light source. Computer-driven retarders provided N = 256 indications per one rotation cycle of the first phase plate F [see Eq. (3.30)]. A photon-counting system was used with the photomultiplier tube (PMT), amplitude discriminator (clipping amplifier), and counter. The fast Fourier transform (FFT) analysis allowed one to measure and calculate all 16 S-matrix elements for the fixed scattering angle during the time of about 1 s with an accuracy of 3–5%.
The measurement of angular dependencies of LSM elements in a human lens shows their significant difference for clear and opaque (cataractous) eyes (see
Tissue Optics: Light Scattering Methods and Instruments for Medical Diagnosis |
285 |
Fig. 3.22). This difference may be caused by the appearance of large nonspherical scattering particles due to aggregation of high-molecular-weight proteins.
Figure 3.22 Experimental angular dependencies for LSM elements of (a) a normal lens 5 hr after the death of a 56-year-old subject and (b) a cataractous lens 5 hr after the death of an 88-year-old subject.24
The comparison of transmittance (see Fig. 3.17) and angular dependencies of LSM elements measured at the same wavelength indicates that the latter are more sensitive to variations in the structure of scattering media. This allows for measured LSM elements to be used for early diagnosis of structural changes in a tissue, e.g., those caused by a developing cataract.
This inference can be illustrated by the results of direct model experiments presented in Fig. 3.23.6,10,335 The measurements were performed in an α-crystallin
solutions (quasi-monodispersive particle fraction about 0.02 μm in diameter) from a freshly isolated calf lens (a contribution by J. Clauwaert, University of Antwerp, who also participated in the experiment) and in solutions of high-molecular-weight proteins (mean diameter 0.8 μm) from opaque lenses. The figure shows that measurements of the indicatrices of LSM elements permits the identification of a

286 |
Optical Properties of Eye Tissues |
Figure 3.23 Indicatrices for LSM elements of α-crystallin solutions and a fraction of large-sized scatterers isolated from cataractous lens. The relative volume concentrations of α-crystallin wp = 0.3 and the large-particle fraction w2 = 0 (τ = 99%), 5 × 10⁻⁵ (τ = 98%); 1.4 × 10⁻⁴ (τ = 94%); and 2.5 × 10⁻⁴ (τ = 90%). τ is the transmittance of the 5-mm thick solution at λ = 633 nm.24
coarsely dispersed fraction of scatterers that is difficult to achieve by spectrophotometry because the corresponding decrease in sample transmittance does not exceed 1%.
Laser scattering matrix measurements may be employed for in vitro examination of various eye tissues, from cornea to retina. In vivo measurements in the intact eye are equally feasible, provided a fast LSMM is used to exclude a sensorimotor eye globe response. In this case, structural information about selected eye tissues can be obtained to diagnose cataract and other ophthalmologic disorders.
A survey of rabbit eye LSM has demonstrated that the aqueous humor in the anterior eye chamber is actually a transparent isotropic substance exhibiting weak
Tissue Optics: Light Scattering Methods and Instruments for Medical Diagnosis |
287 |
light-scattering properties (the intensity of scattered light does not exceed 1.5–2% of the incident light intensity) owing to the presence of dissolved organic components. The results of an LSM study in the vitreous humor indicate that its amorphous tissue does not affect the polarization of straight-transmitting light, offer-
ing the possibility of examining the ocular fundus and imaging the optic nerve structure, which is important for early diagnosis of glaucoma.168,377,388 On the
other hand, certain pathological changes in the vitreous humor may be responsible for the alteration of LSM elements. Specifically, a minor intraocular hemorrhage is easy to identify by virtue of conspicuous light scattering from erythrocytes.
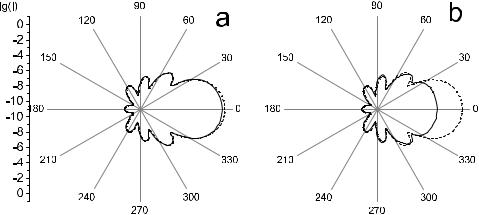
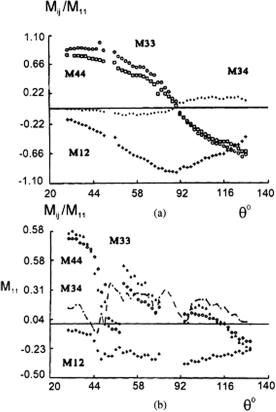
The angular dependence of LSM elements in a monolayer of disk-shaped or spheroidal erythrocytes in relation to their packing density was examined in Ref. 69. The angular dependence of the matrix element M11 in both cell types turned out to be influenced by the packing density in the angular scattering range of θ = 15–16 deg. The angular dependencies of the elements M11, M22, M33, and M21 at θ = 110–170 deg were found to be affected far more by the shape of the scatterers than by their concentration. It was possible to derive the refractive indices of erythrocytes from measurements of the M12 magnitude at scattering angles θ ≈ 140–160 deg. A study814 revealed the high susceptibility of the angular dependencies of LSM elements (M11 and M12) to the degree of erythrocyte aggregation in blood plasma.
LSM measurements were also used to examine the formation of liposome complexes with plague capsular antigen and various particle suspensions,10 e.g., those of spermatozoid spiral heads and different bacterial species.43,149 The angular dependencies of the normalized element M34 for different bacteria turned out to be oscillating functions (similar to those in Fig. 3.23) whose maxima positions are
Figure 3.24 Angular distributions of the normalized (to M11) LSM elements of the monolayer of erythrocytes: experimental: M22 (1, 3), M33 (5, 6), M12 (7), M21 (8); theoretical (Mie theory): M22 (2), M33 (4); for disklike erythrocytes (3, 5, 7, 8) and spherocytes (1, 2, 4, 6) (from Ref. 69 with corrections).
288 |
Optical Properties of Eye Tissues |
very sensitive to the varying size of bacteria.817,818 This allows bacterial growth
to be followed. Determination of LSM elements is equally promising for more effective differentiation between blood cells by time-of-flight cytometry.149,819,820