


330 |
Controlling of the Optical Properties of Tissues |
optical (scattering) properties using various physical and chemical actions such as compression, stretching, dehydration, coagulation, UV irradiation, exposure to low temperature, and impregnation by chemical solutions, gels, and oils. All these phenomena can be understood if we consider tissue as a scattering medium that shows all optical effects that are characteristic to turbid physical systems. It is well known that the turbidity of a dispersive physical system can be effectively controlled by providing matching refractive indices of the scatterers and the ground material. This is a so-called optical immersion technique. Another possibility to control optical properties of a disperse system is to change its packing parameter and/or scatterer sizing (see Chapters 1–3).
In vivo control of tissue optical properties is very important for many medical applications. A number of laser surgery, therapy, and diagnostic technologies include tissue compression and stretching, which is used for better transportation of a laser beam to underlying layers of tissue. The human eye com-
pression technique allows one to perform transscleral laser coagulation of the ciliary body and retina/choroid.266,667,723 The possibility of selective translucence
of the upper tissue layers should be very useful for development of the eye globe imaging techniques and for detecting local inhomogeneities hidden by a highly scattering medium in functional tomography. Results on control of human sclera optical properties by tissue impregnation with optical clearing agents (OCA), which are typically hyperosmotic chemical agents, such as x-ray con-
trast (trazograph or hypaque), glucose, and polyethylene glycol (PEG), were also
reported.6,24,61,77,155,172,788,812,949,958–964,1022,1023,1033
In general, the scattering coefficient μs and scattering anisotropy factor g of a tissue is dependent on refractive index mismatch between cellular tissue components: cell membranes, cytoplasma, cell nucleus, cell organelles, melanin granules, and the extracellular fluid. For fibrous (connective) tissue (eye scleral stroma, corneal stroma, skin dermis, cerebral membrane, muscle, vessel wall noncellular matrix, female breast fibrous component, cartilage, tendon, etc.), index mismatch of the interstitial medium and long strands of scleroprotein (collagen-, elastin-, or reticulin-forming fibers) is important. The refractive index matching is manifested in the reduction of the scattering coefficient (μs → 0) and increase of single-
scattering directness (g → 1). For skin dermis and eye sclera, μs reduction can be very high.172,571,722,788,965 For hematous tissue like the liver, its impregnation by
solutes with different osmolarity also leads to refractive index matching and reduc-
tion of the scattering coefficient, but the effect is not as pronounced as for skin and sclera due to cells changing size as a result of osmotic stress.956,957
Soft tissue is composed of closely packed groups of cells entrapped in a network of fibers through which interstitial liquid percolates. At a microscopic scale, the tissue components have no pronounced boundaries; thus, tissue can be considered as a continuous structure with spatial variations in the refractive index. As it was already discussed, to model such a complicated structure as a collection of particles, it is necessary to resort to a statistical approach (see Chapter 1). The tissue components that contribute most to the local refractive index variations are the

Tissue Optics: Light Scattering Methods and Instruments for Medical Diagnosis |
331 |
connective tissue fibers (collagen-, elastin-, or reticulin-forming), which form part of the noncellular tissue matrix around and among cells and cell membranes, cy-
toplasmic organelles (mitochondria, lysosoms, and peroxisomes), cell nuclei, and melanin granules.63,64,96,156,558,781–783,956,957 Figure 1.45 shows a hypothetical in-
dex profile formed by measuring the refractive index along a line in an arbitrary direction through a volume of tissue and the corresponding statistical mean index profile. The average background index n0 is defined as the weighted average of refractive indices of the cytoplasm and the interstitial fluid, ncp and nis [see Eq. (1.151)]. The refractive index of a particle can be defined as the sum of the background index and the mean index variation, n , described by Eqs. (1.152)– (1.154).
For a two-component model, the mean refractive index of a tissue n is defined by the refractive indices of its scattering center’s material ns and ground matter n0, n = fsns + (1 − fs)n0 [see Eq. (2.57)]. The ns/n0 ≡ m ratio determines the scattering coefficient. For example, in a simple monodisperse model of scattering dielectric spheres (Mie theory), the reduced scattering coefficient μs is defined by Eq. (2.24), where μs (m − 1)2. It follows from Eq. (2.24) that only a 5% increase in the refractive index of the ground matter (n0 = 1.35 → 1.42), when that of the scattering centers is ns = 1.47, will cause a sevenfold decrease of μs. In the limit of equal refractive indices for nonabsorbing particles and background material, m = 1 and μs → 0. In a living tissue, the relative refractive index is a function of the tissue physiological or pathological state. Independence of the specificity of the tissue state refractive index of the scatterers and/or the background may be changed (increased or decreased); therefore, light scattering may correspondingly increase or decrease.
Light scattering and absorption of particles that compose tissue or blood can be calculated by Mie theory. The relevant parameters are the size (radius a) of the particles, their complex refractive index [see Eq. (1.192)], the complex refractive index of the dielectric host (ground material in tissues, or plasma in blood) n0, and the relative refractive index of the scatterers and the ground materials, m = ns/n0. The imaginary part of the complex refractive indices is responsible for light losses due to absorption. Mie theory yields the absorption and scattering efficiencies and the phase function from which the absorption and scattering coefficients μs = ρσsca and μa = ρσabs and the scattering anisotropy g are calculated; ρ is the scatterers’ (particles) density. The corresponding scattering and absorption cross sections σsca and σabs, and g-factor are described by Eqs. (1.193), (1.194), and (1.195), respectively.
The transport scattering coefficient increases strongly with the ratio of the real
part of the scaterer index and the background medium index, ns/n0, especially for 0.1–1 μm-sized particles (see Fig. 1.56).632,633 For fully matched refractive indices
of scatterers and background material, the scattering coefficient goes to zero and the scattering anisotropy factor is maximal and approaches 1 for particles with sizes above 1 μm.
332 |
Controlling of the Optical Properties of Tissues |
However, in practice, the total index matching cannot always be provided; thus, other mechanisms of tissue clearing may be essential. Sometimes, action of hyperosmotic chemical agents or strong mechanical compression may lead to a reversible or irreversible change in the scatterers’ size. The wavelength dependencies of the scattering parameters for systems of partially matched refractive indices of scatterers and background (ns/n0 = 1.07) are shown in Fig. 1.57. Such a level of matching is typical for many normal connective and cell-structured tissues. The spectral variation of the relative index has been neglected in calculations, but may be relevant in practice. If the particle size and ratio of refractive indices are fixed, the wavelength dependencies are caused by the spectral variation of the ratio of the wavelength to the particle size. For particles with a refractive index close to that of the host (see Fig. 1.57), the scattering coefficient of the particle systems with very small or very big diameters of particles is almost independent of the wavelength in the range from 400 to 800 nm, while that of the system with intermediate diameters of particles decreases with wavelength. The same tendency in the wavelength dependence (no dependence for very small and very big scatterers, and decreasing for intermediate diameters) is expected for the scattering anisotropy factor.
It follows from this consideration that reduction of scattering may be associated not only with the refractive index matching, but also with the changes of the scattering system sizing. Both aggregation to big-sized particles and disaggregation to small-sized particles leads to scattering damping, but the scattering anisotropy properties of the newly formed system should be quite different. The latter can be used in the understanding of the tissue clearing mechanisms associated with the particle sizing and the refractive index matching. Conceptually, for many situations, the leading mechanism of tissue clearing might be a refractive index match because the equalizing of the refractive indices of scatterers and surrounding media always takes place at tissue immersion, dehydration, or compression, and the sensitivity of the scattering properties to refractive index matching is very high.
As a particle system, whole blood shows pronounced clearing effects that may be accompanied by induced or spontaneous aggregation and disaggregation
processes as well as RBC swelling or shrinkage at application of biocompatible clearing agents with certain osmotic properties.737,748,981–985,932,1036,1037,1042,1043
It is possible to achieve a marked impairment of scattering by means of intratissue administration of appropriate OCAs. Conspicuous experimental optical clearing in human and animal sclera; human, animal, and artificial skin; human gastrointestinal tissues; and human and animal cartilage and tendon in the visible and NIR wavelength range induced by administration of x-ray contrast agents (verografin, trazograph, and hypaque), glucose, propylene glycol, polypropylene glycol-based polymers (PPG), polyethylene glycol (PEG), PEG-based polymers, glycerol, and other solutions has been described in Refs. 6, 24, 61, 77, 155, 172, 343, 339–341, 409, 410, 453, 571, 704, 717, 777, 788, 798, 799, 812, 831, 866, 867, 916, 932, 946, 949, 958–975, 977–980, 986, 987, 997, 1008, 1009, 1011, 1012, 1021–1034, 1038–1041, 1044–1047, and 1052–1065.
Coordination between refractive indices in multicomponent transparent tissues showing polarization anisotropy (e.g., cornea) leads to its decrease.5,10 In
Tissue Optics: Light Scattering Methods and Instruments for Medical Diagnosis |
333 |
contrast, for a highly scattering tissue with a hidden linear birefringence or optical activity, its impregnation by immersion agents may significantly improve the
detection ability of polarization anisotropy due to reduction of the background
scattering.409,410,1033,1034
Concentration-dependent variations in scattering and transmission profiles in α-crystallin suspensions isolated from calf lenses are believed to be related to osmotic phenomenon.952 Osmotic and diffusive processes that occur in tissues treated with verografin, trazograph, glucose, glycerol, and other solutions are also important.172 Osmotic phenomena appear to be involved when optical properties of biological materials (cells and tissues) are modulated by sugar, alcohol, and electrolyte solutions. This may interfere with the evaluation of hemoglobin saturation
with oxygen or identification of such absorbers as cytochrome oxidase in tissues by optical methods.956,957
Experimental studies on optical clearing of normal and pathological skin and its components (epidermis and dermis) and the management of reflectance and transmittance spectra using water, glycerol, glycerol-water solutions, glucose, sunscreen creams, cosmetic lotions, gels, and pharmaceutical products were carried out in Refs. 57, 213, 255, 341, 343, 453, 571, 777, 916, 932, 946, 961–967, 969, 970, 973, 975, 978, 980, 988, 1027, 1031, 1038, 1039, 1044–1047, 1049, 1052, 1053, 1055–1063, and 1065. The control of skin optical properties was related to the immersion of refractive indices of scatterers (keratinocytes components in epidermis, collagen, and elastic fibers in dermis) and ground matter, and/or reversible collagen dissociation.946 In addition, some of the observed effects appear to have been caused by the introduction of additional scatterers or absorbers into the tissue or, conversely, to their washing out.
A marked clearing effect through hamster,571 porcine,1058 and human932,965,967,973 skin, human and rabbit eye sclera,61,960 and rabbit dura mat-
ter831 occurred for an in vivo tissue within a few minutes of topical application (eye, dura matter, skin) or intratissue injection (skin) of glycerol, glucose, propylene glycol, trazograph, and PEG and PPG polymers.
Albumin, a useful protein for index matching in phase contrast microscopy experiments,749,953–955 can be used as the immersion medium for tissue study and
imaging.58,96 Proteins smaller than albumin may offer a potential alternative because of the relatively high scattering of albumin. Sometimes, medical diagnosis or contrasting of a lesion image can be provided by the enhancement of tissue scat-
tering properties by applying, for instance, acetic acid, which has been successfully used as a contrast agent in optical diagnostics of cervical tissue.58,96,998–1003 It has
been suggested that the whitening effect caused by acetic acid seen in cervical tissue is due to coagulation of nuclear proteins. Therefore, an acetic acid probe may also prove extremely significant in quantitative optical diagnosis of precancerous conditions because of its ability to selectively enhance nuclear scatter.58,96
Evidently, the loss of water by tissue seriously influences its optical properties. One of the major reasons for tissue dehydration in vivo is the action of endogenous or exogenous osmotic liquids. In in vitro conditions, spontaneous water evaporation from tissue, tissue sample heating at noncoagulating temperatures, or its
334 |
Controlling of the Optical Properties of Tissues |
freezing in a refrigerator cause tissue to loose water. Typically in the visible and NIR regions, far from water absorption bands, the absorption coefficient increases by a few dozens of percent and the scattering coefficient by a few percent due to closer packing of tissue components caused by its shrinkage. However, the overall
optical transmittance of a tissue sample increases due to decrease of its thickness at dehydration.569,570 Specifically, in the vicinity of the strong water absorption
bands, the tissue absorption coefficient decreases due to less concentration of water in spite of a higher density of tissue at its dehydration.
It is possible to significantly increase transmission through a soft tissue by squeezing (compressing) or stretching it.951 The optical clarity of living tissue is due to its optical homogeneity, which is achieved through the removal of blood and interstitial liquor (water) from the compressed site. This results in a higher refractive index of the ground matter, whose value becomes close to that of the scatterers (cell membrane, muscle, or collagen fibers) [see Eq. (2.24)]. Closer packing of tissue components at compression makes the tissue a less chaotic, but more or-
ganized, system, which may give less scattering due to cooperative (interference) effects.442,950 Indeed, the absence of blood in the compressed area also contributes
to altered tissue absorption and refraction properties. Certain mechanisms underlying the effects of optical clearing and changing of light reflection by tissues at compression and stretching were proposed in Refs. 61, 62, 442, 667, 722, 723, 950, and 1013.
Long-pulsed laser heating induces reversible and irreversible changes in the optical properties of tissue.569,570,997 In general, the total transmittance decreases
and the diffuse reflectance increases, showing nonlinear behavior during pulsed laser heating. Many types of tissues slowly coagulated (from 10 min to 2 hr) in a hot water or saline bath (70–85◦C) exhibit an increase of their scattering and absorption coefficients (see Table 2.1).
UV irradiation causes erythema (skin reddening), stimulates melanin synthesis,
and can induce edema and tissue proliferation if the radiation dose is sufficiently large.54,575,991,992 All these photobiological effects may be responsible for varia-
tions in the optical properties of skin and need to be taken into consideration when
prescribing phototherapy. Also, UV treatment is known to cause color development in the human lens.800
Natural physiological changes in cells and tissues are also responsible for their altered optical properties, which may be detectable and thus used as a measure of
these changes. For example, measurements of the scattering coefficient allow one to monitor glucose339–341,534,549–551,1018,1019 or edema1017 in the human body, as
well as blood parameters.568 A nearly parabolic dependence between the scattering coefficient and hematocrit values (Hct) in thin blood layers was demonstrated [see Eq. (1.172)].568 Many papers report optical characteristics of blood as a function of hemoglobin saturation with oxygen. The alterations of the optical properties of blood caused by changes of hematocrit value, temperature, and parameters of flow can be found in Tables 2.1–2.4 and 2.6.
Tissue Optics: Light Scattering Methods and Instruments for Medical Diagnosis |
335 |
5.2 Tissue optical immersion by exogenous chemical agents
5.2.1 Principles of the optical immersion technique
Let us consider the principles of the optical immersion technique based on the impregnation of a tissue or dilution of blood by a biocompatible chemical agent, which also may have some hyperosmotic properties. Any connective (fibrous) tissue can be effectively impregnated by a liquid agent or its solution. As an example of fibrous tissue, human sclera will be analyzed.
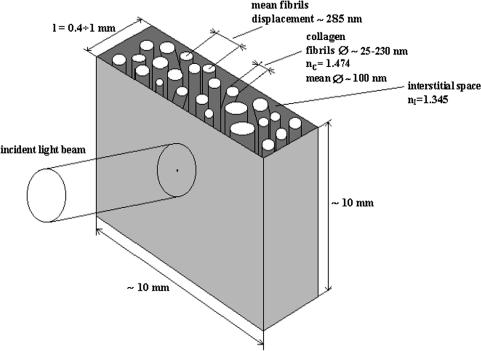
A model of human sclera in a local region can be represented as a slab with a
thickness d that is filled by thin and long dielectric cylinders (collagen fibers) with average diameter 100 nm and refractive index nc = 1.474 (see Fig. 5.1).172,798,799
The cylinders are located in planes that are in parallel to the slab surface, but within each plane their orientations are random (see Fig. 3.4). The space between collagen fibers is filled by a homogeneous ground substance with refractive index n0 = 1.345. Considerable refractive indices are mismatched between collagen fibers, and a ground substance causes the system to become turbid, i.e., causes multiple scattering and poor transmittance of propagating light. The refractive index of the background is a controlled parameter and may be changed in the range of 1.345 to 1.474, which transits the system from multiple to low-step and even
Figure 5.1 Schematic representation of a human scleral sample and the geometry of light irradiation.172

336 |
Controlling of the Optical Properties of Tissues |
single-scattering mode. For nc = n0 = 1.474, the medium becomes totally homogeneous and optically transparent if absorption of scatterers is small.
The described model of tissue is applicable to any fibrous tissue including skin dermis and muscle. Indeed, refractive indices and fibers’ diameters and their spacing should be changed. The transmission of collimated light by a tissue layer of thickness d is defined by the Bouguer-Beer-Lambert law [see Eq. (1.1)] as
Tc = |
I (d) |
= exp(−μtd), |
(5.1) |
I0 |
where I0 and I (d) are the intensities of the incident and detected light, respectively, and μt = μa + μs is the attenuation coefficient. As it follows from Table 2.1, for
the human sclera at wavelength λ |
= |
800 nm, the absorption coefficient is |
= |
|||||||||
|
μa |
|||||||||||
|
|
|
|
|
s |
= |
|
− |
|
|
|
|
1.6 cm−1 |
and reduced scattering coefficient is μ |
μs(1 |
g) |
= |
38 cm−1. For |
|||||||
|
|
|
||||||||||
g |
= |
|
= |
|
|
|
|
|
|
|
|
|
|
0.9, μs 380 cm−1. |
|
|
|
|
|
|
|
|
|
||
Owing to the fibrous structure of the sclera, it is quite reasonable to assume that
the dynamics of fluid diffusion within the tissue could be approximated by free diffusion.172,1021,1066 Therefore, to describe the dynamics of the refractive index
change and the corresponding decrease of the scattering coefficient when a chemi-
cal agent diffuses within the interfibrillar substance of a tissue, we used the model of free diffusion with the approximate solution of the diffusion equation172,1066
∂Cf (x, t) |
= Df |
∂2Cf (x, t) |
(5.2) |
|
|
|
, |
||
∂t |
∂x2 |
|||
where Cf (x, t) is the fluid concentration, Df is the coefficient of diffusion, and x is the spatial coordinate. This equation is applicable in cases where the rate of the process is not limited by membranes, such as the diffusion of substances in the
interfibrillar space or when a substance in solution has a high rate of permeation through membranes.1066 For a plane slab with a thickness d that is placed at the
moment t = 0 in a solution with the initial concentration of the agent Ca0 (the initial concentration of the agent within the slab is equal to 0; i.e., t = 0; 0 ≤ x ≤ d; Ca (x, 0) = 0; the boundary conditions are Ca (0, t) = Ca (d, t) = Ca0), Eq. (5.2)
has the following solution describing the time-dependent distribution of agent concentration within a sample:172,1066
Ca (x, t) = Ca0 1 − π exp − τ |
sin d |
|
|
||||||||||
|
|
4 |
|
|
t |
|
|
|
|
πx |
|
|
|
+ |
3 exp − |
τ sin |
|
d |
|
|
|
|
|||||
|
1 |
|
|
|
9t |
|
3πx |
|
|
|
|
|
|
+ |
5 exp − |
τ |
sin |
5dx + · · · , |
(5.3) |
||||||||
|
1 |
|
|
|
25t |
|
|
π |
|
|
|
|
|

Tissue Optics: Light Scattering Methods and Instruments for Medical Diagnosis |
337 |
||
where |
|
|
|
τ = |
d2 |
(5.4) |
|
|
, |
||
π2Da |
|||
and Da is the agent diffusion coefficient.
The ratio of the amount of dissolved matter mt at the moment t to its equilib-
rium value m |
∞ |
is defined as1066 |
|
|
|
|
|
|
|
|
|
|
|
|
|||||||
|
|
|
|
|
|
|
|
|
|
|
|
|
|
|
|
|
|
|
|
||
|
m t |
= |
0 |
|
Ca0d |
|
|
|
|
|
|
|
|
|
|
|
|
|
|
||
|
m |
|
|
d Ca (x, t)dx |
|
|
|
|
|
|
|
|
|
|
|
|
|
|
|||
|
∞ |
= 1 − π2 |
exp − |
τ |
+ |
9 exp − |
τ |
+ |
25 exp − |
τ |
+ · · · . (5.5) |
||||||||||
|
|
|
|
|
|
8 |
|
t |
|
|
1 |
|
9t |
|
1 |
|
25t |
|
|||
|
|
|
|
|
|
|
|
|
|
|
|
|
|
|
|
|
|
|
|
|
|
This ratio in its turn defines the volume-averaged concentration of an agent Ca (t), which in the first-order approximation has the form172,987,1021
Ca (t) = |
2 |
0 |
d |
1 − exp − τ |
. |
(5.6) |
|
Ca (x, t)dx = Ca0 |
|||||||
|
1 |
|
|
|
t |
|
|
Equations (5.3)–(5.6) allow one to find the time-dependent concentration of chemical agents with a relatively low molecular weight at a depth x within a tissue sample, or time variations of the total amount of these agents in the sample if the diffusion coefficient Da of these molecules in the tissue is known. On the other hand, measurements of Ca (t) make it possible to estimate the Da value of implanted molecules in the interstitial fluid of the tissue. For low molecular weight
compounds, the values of their diffusion coefficients in their own media are about
10−5 cm2 s−1, for water, Da = 2.5 × 10⁻⁵ cm2 s−1, and Da = 0.5 × 10⁻⁵ cm2 s−1 for saccharose.1066
When the agent is administrated through only one sample surface (such a situation also may take place for in vivo topical agent application), Eq. (5.6) is still valid, but with another expression for the characteristic diffusion time:1038
d2 |
|
τ = Da . |
(5.7) |
Equations (5.3)–(5.7) were received for diffusion through a homogeneous slab. Due to its fibrous structure, a tissue can be presented as a porous material, which leads to modification of the chemical agent diffusion coefficient as
Da = |
Dai |
(5.8) |
p . |
338 |
Controlling of the Optical Properties of Tissues |
Here, Dai is the chemical agent diffusion coefficient within the interstitial fluid and p is the porosity coefficient defined as
p |
= |
|
V − VC |
, |
(5.9) |
|
|||||
|
|
V |
|
||
where V is the volume of the tissue sample and VC is the volume of collagen fibers.
To describe the bigger molecules’ diffusion, the theory of hindered diffusion through a permeable membrane should be used.172,1021,1066 Based on Fick’s law,
which limits the flux of matter J (mol/s/cm2) to a gradient of its concentration,
dC |
|
J = −Da dx . |
(5.10) |
For stationary transport of matter through a thin membrane, we have1066 |
|
J = Pa (C1 − C2), |
(5.11) |
where Pa = Da /d is the coefficient of permeability, and C1 and C2 are the concentrations of molecules in two spaces separated by a membrane.
Using Eqs. (5.10) and (5.11), it is possible to find the variation in concentration of molecules inside a closed space with a volume V surrounded by a permeable
membrane with an area S by using the following equation:1066 |
|
||||
|
dC2 |
= |
Pa S |
(C1 − C2). |
(5.12) |
|
|
|
|||
|
dt |
V |
|||
For a large external volume, where C1 can be considered as a constant, Eq. (5.12) has an approximate exponential solution in a similar form to Eq. (5.6),172,1021,1066
with C2 = Ca , C1 = Ca0, and
d2 |
|
τ = Da . |
(5.13) |
Equation (5.13) indicates that in experiments with tissue plane slabs (see Fig. 5.2), V = Sd, where S and d are the area and thickness of the sample. The form of this equation is the same as that for free diffusion, but the values of the diffusion coefficient for free and hindered diffusion can be significantly different.
At tissue impregnation by a chemical agent, the refractive index of the background (interfibrillar) media n0 is a time-dependent function of the agent concentration, which penetrates into a sample Ca (t) and is defined by Eq. (5.6). The timedependent volume fraction of the agent within the tissue sample fa is proportional to its concentration Ca ; thus, using the law of Gladstone and Dale [see Eq. (1.150)], we can write
n0(t) = n0(t)f0(t) + na fa (t), |
(5.14) |

Tissue Optics: Light Scattering Methods and Instruments for Medical Diagnosis |
339 |
where f0(t) + fa (t) = 1. For application of nonosmotic or low-osmotic agents, the initial refractive index of the interfibrillar space can be considered as being
= |
|
= |
0). |
independent of time, n0(t) n0 |
(t |
|
The expression for the scattering coefficient, derived for a system of noninteracting thin cylinders with a number of fibrils per unit area ρs , has the form172,1021
|
|
|
π5a4n03 |
2 |
|
|
2 |
|
|
2 |
|
|
μs |
= |
|
|
|
− |
1) |
|
|
+ |
|
|
(5.15) |
λ03 |
|
(m2 + 1)2 |
||||||||||
|
ρs |
|
(m |
|
|
1 |
|
|
, |
|||
where ρs = fcyl /πa2, fcyl |
is the surface fraction of the cylinders’ faces, a is the |
|||||||||||
cylinder radius, m = ns/n0 is the relative index of refraction of cylinders (scatterers) to the background (interfibrillar space), and λ0 is the wavelength in vacuum.
As a first approximation, it is reasonable to assume that the radii of the scatterers (fibrils) and their density cannot be significantly changed by chemicals (no tissue swelling or shrinkage take place), the absolute changes of n0 are not very high, and variations in μs are caused only by the change in the refractive index of the interstitial (interfibrillar) space in respect to the refractive index of the scatterers. Then, accounting for the fact that a majority of tissues has m ≈ 1, the ratio of the scattering coefficients at a particular wavelength as a function of the refractive
index ratio m can be written in the following form:172,1021 |
|
|||||||
μs2 |
= |
μs1 |
m |
− |
1 |
|
2 |
(5.16) |
m1 |
1 |
. |
||||||
|
|
|
2 |
|
|
|
|
|
−
Indeed, this relation describes tissue scattering properties’ change due to refractive index match or mismatch caused by changes of refractive indices of the scatterers or the background, or both. The similar equation for Mie spherical particle systems follows from Eq. (2.24). Due to square dependence, the sensitivity to indices
matching is very high, for instance, for m1 |
= |
1.1 and m2 |
= |
1.01, |
= |
0.01μs1. |
|
|
μs2 |
For the immersion technique, the refractive index of the scatterers ns is usually kept constant during tissue impregnation by an agent. Thus, we can use Eq. (5.14) to rewrite Eq. (5.16) in a form that is specific for the tissue impregnation by an
agent with a weak osmotic strength as |
|
|
|
||||||||
μ |
(t) |
= |
μ |
(t |
= |
0) |
× |
{[ns/n0(t)] − 1}2 |
. |
(5.17) |
|
{[ns/n0(t = 0)] − 1}2 |
|||||||||||
s |
|
s |
|
|
|
|
|||||
It should be noted that a more rigorous approach to calculating the scattering coefficient must be based on consideration of light scattering by densely packed systems of thin dielectric cylinders or spherical particles with a particular size distribution (see Chapters 1–3).
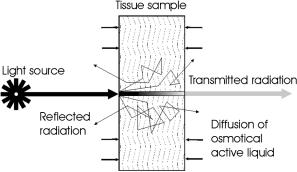
To estimate changes of tissue collimated transmittance caused by agent diffusion into a sample (see Fig. 5.2), Eqs. (5.1), (5.6), (5.14), and (5.17) should be used together. Usually, immersion agents do not have strong absorption bands within the
340 |
Controlling of the Optical Properties of Tissues |
Figure 5.2 Schematic representation of the diffusion of the immersion agent into a tissue sample and light transmittance and scattering.987
wavelength range of interest; thus, the absorption coefficient often may be considered as a constant value. Indeed, the diffuse transmittance and reflectance as well as differential scattering characteristics (angular dependent scattering) for a tissue sample can be calculated if the behavior of the scattering anisotropy factor g at optical immersion is known. For Mie particles, the analysis of the g-factor behavior due to refractive index matching can be done using Eq. (1.195); corresponding calculations are presented in Figs. 1.54 and 1.55, and Eqs. (5.6), (5.14), and (5.17).
For in vivo studies, the back-reflectance geometry of the measurements is principle; thus, Eqs. (5.6), (5.14), and (5.17) should be used together with Eqs. (1.27) or (2.17), or their analogous equations received for the interacting particles (see Chapters 1–3).
5.2.2 Water transport
A water balance in living tissues is one of the important features of tissue condition. At tissue interaction with external or internal molecules’ diffusion (proteins, sugars, alcohols, polymers, etc.), tissue water should be involved in molecular displacement processes.172 Water may be transported through a membrane (a certain tissue layer) by an increased concentration of dissolved substance in one of two parts of the system. This happens for membranes more permeable for water than for dissolved material and is called osmosis.1066 The simplest case of water transport is when a membrane is permeable for water and totally unpermeable for molecules of dissolved substances. However, in general, biological membranes are permeable for both water and dissolved substances, but the degree of permeability for them can be quite different. This is the most complicated case to describe, but the situation becomes simpler when water and dissolved substance permeate by the same paths inside a membrane [such as interfibrillar spaces (pores) in fibrous tissues, which are filled by the interstitial fluid containing water]. In that case, fluxes of water and dissolved substance interact and each flux is dependent on the degree of interaction. Such interaction between the stationary fluxes can be well described within the framework of irreversible thermodynamics.1066

Tissue Optics: Light Scattering Methods and Instruments for Medical Diagnosis |
341 |
Assuming that in a system there is only one type of dissolved molecule (i.e., two fluxes move through a membrane: the water flux JW and a dissolved matter
flux JS , which are proportional to the gradients of the chemical potential of water and dissolved matter), we can find the volumetric flux defined as1066
JV = JW |
V |
W + JS |
V |
S , |
(5.18) |
where V W and V S are the partial mole volumes, in the form
JV = Lp( p − σRT CS ). |
(5.19) |
The flux of dissolved matter can be expressed as1066
JS = RT ω CS + CS (1 − σ)JV . |
(5.20) |
Here, in Eqs. (5.19) and (5.20), Lp is the phenomenological coefficient indicating that the volumetric flux can be induced by rising hydrostatic pressure p; σ is the reflection coefficient [σ = −(Lpd /Lp), where Lpd is the phenomenological coefficient indicating on the one hand that the volumetric flux that can be induced for the membrane by the osmotic pressure RT CS , and on the other, the efficiency of the separation of water molecules and dissolved matter]; ω = (LD − Lpσ2)CS , where LD is the phenomenological coefficient characterizing the interchange flux induced by osmotic pressure RT CS ; and CS is the average concentration of dissolved matter in two interacting solutions.
For the ideal partially permeable membrane, σ = 1. For membranes that are permeable for molecules of dissolved matter, 0 < σ < 1. Equations (5.19) and (5.20) are valid for solutions with a low concentration. It should be noted that the volumetric flux for a partially permeable membrane described by Eq. (5.19) has the same mechanism of creation for both hydrostatic and osmotic pressure. So for porous (fibrous) materials (such as sclera, derma, muscle, dura mater), it is expected that osmotic pressure induces the flux of water due to increasing hydrostatic pressure, but not through independent diffusion of water molecules caused by their concentration gradient, because this entails considerably more resistance.
5.2.3 Tissue swelling and hydration
When applying a chemical agent, a change of environmental pH level is very important because swelling or shrinkage of tissue is expected.1067 The swelling or shrinkage of a fibrous tissue is caused not only by the increase (decrease) of collagen (elastin) fibril size, but also by the increase (decrease) of the sample volume due to the rise (diminution) of the mean distance between fibrils. It is well known that the change of the environmental pH to the more acid or more alkaline side from a colloid isoelectric point increases the degree of swelling. It is explained by the appearance of a positive or negative charge of colloid particles and, therefore, by the increase of hydration degree. In general, the initial pH condition of the tissue

342 |
Controlling of the Optical Properties of Tissues |
under study and the acid or alkaline nature of the impregnated solution may lead to different dependencies of tissue thickness or volume on chemical agent concentration (or time of impregnation) due to changes of pH. Such behavior of a tissue sample should be taken into account when optical measurements are used for estimation of tissue properties. For example, the swelling or shrinkage was watched
for different initial conditions of scleral tissue sample preparation and solutions
used.172,343,960,963,1022,1023
A detailed study of the swelling of bovine sclera and cornea as a function of pH and ionic strength of the bathing medium, using an equilibration technique that prevents the loss of proteoglycans during swelling, is presented in Ref. 786. X-ray diffraction was used to measure the intermolecular spacings (IMS), fibril diameters and D-periodicity, and interfibrillar spacings (IFS) of collagen as functions of pH, ionic strength, and tissue hydration. Hydration H was defined as
H = |
Weightwet − Weightdry |
. |
(5.21) |
Weightdry |
It was found that both tissues swelled least near pH 4 (the isoelectric point), that higher hydrations were achieved at low ionic strengths, and that sclera swelled about one-third as much as cornea under most conditions. The IMS in both tissues
decreased as the ionic strength was increased; for sclera, hydration H .
= 2 5 and pH 7.0 IMS changed from 1.71 to 1.61 nm at a 33-fold increase of ionic strength. The IMS has virtually no change on hydration when H > 1, H = 3.2 is physiological hydration; the corresponding mean value for the cornea was 1.75 ± 0.04 nm (n = 12), and for the sclera it was 1.65± 0.02 nm (n = 9) at pH 7.4. For dehydrated tissues (H = 0), the mean spacing was 1.25 ± 0.02 nm (n = 2) for the cornea and 1.27 ± 0.01 nm for the sclera.
The packing of fibrils, defined as IFS2, is another important parameter, which determines control of tissue light scattering. For bovine cornea at physiological pH 7.4, the squared IFS decreased linearly from approximately 9.2 × 10³ nm2 for a highly hydrated tissue (H = 9.7) to approximately 2.1 × 10³ nm2 at tenfold less hydration, and was equal to 4.2 × 10³ nm2 at physiological hydration, H = 3.2. Both fibril diameters [mean value 39.0 ± 1.1 nm (n = 6)] and the D-periodicity [mean value 64.50 ± 0.35 nm (n = 6)] of corneal collagen were essentially independent of hydration and pH when hydration was above unity. This means that the fibrils preferentially absorb the initial water and then remain at a relatively constant diameter. The remaining unchanged value of the D-periodicity with hydration indicates no significant changes in the dimensions along the axis of the fibrils during swelling. The same tendencies are expected for sclera as a collagen-based media. The volume of a tissue at a given hydration may be expressed in terms of the dry
volume. The corresponding expression that describes the volume of the cornea at its hydration can be written as786
VH = VT (1 + 1.066H ). |
(5.22) |
Tissue Optics: Light Scattering Methods and Instruments for Medical Diagnosis |
343 |
This equation should apply equally to any volume of the tissue, i.e., to the volume associated with each fibril.
The swelling of scleral tissue follows similar principles as for cornea with the same isoelectrical point around pH 4, but at a lower level of swelling. As it was noted in Ref. 786, there are several reasons for the low hydrations of the sclera: the low concentration of proteoglycans; a high collagen content and larger fibrils with a smaller combined surface area than in the cornea; and structural peculiarities connected with the fibrils arranged in bands, which may branch and interweave with each other.
It was found by the authors of Ref. 786 that the high light scattering (low transmittance) of bovine cornea increased more rapidly with hydration (even below physiological hydrations) at pH values around the isoelectric point. For example, at pH 5, transmittance was approximately 98% for H = 2, 87% for H = 3.2, and only 12% for H = 6. In contrast, the light scattering at higher pH values (6–8) changed slowly with hydration: transmittance was higher than 90% for each level of hydration from 1 to 7 with the local maximum of transmittance of 98% for H = 4. According to current models, discussed in detail in Chapter 2, corneal transparency at a given wavelength depends on certain structural parameters such as fibril diameters, the density of fibril packing, the position of each fibril relative to its neighbors, and the refractive indices of the collagen and the interfibrillar matrix, and changes in one or more of these parameters may be sufficient to decrease or increase light scattering.
From these studies, it follows that to improve corneal transparency caused by stromal edema, hypertonic drops extracting enough water from tissue may be used. As it was shown in Ref. 786, sodium chloride could be better than other hypertonic preparations for the treatment of corneal edema because it may also reduce the swelling pressure in the stroma and decrease the fibril diameter if used frequently.
The connection between the hydration H (milligrams water per milligrams dry
tissue weight) and corneal thickness d (in millimeters) is described by the following empirical formulas:772,1024,1025
for rabbit cornea
H = 10d − 0.42, |
(5.23) |
and for bovine cornea
H = 5.3d − 0.67. |
(5.24) |
5.3 Optical clearing of fibrous tissues
5.3.1 Spectral properties of immersed sclera
Normally, eye sclera (see Section 3.1 and Fig. 3.20) is a turbid medium that is nontransparent in the visible range.722,723 The origin of scleral spectra formation
344 |
Controlling of the Optical Properties of Tissues |
can be understood on the basis of light scattering by a system of polydispersive
irregularly arranged collagen cylinders immersed in the ground substance with a lower refractive index (see Chapter 3)798 and strong absorption bands.722,723,788
With a natural thickness of 0.6–0.8 mm, this tissue shows multiple scattering and
looks like white matter. The transition from a multiple to a low-step/single scattering can be provided by the drying of a tissue sample722,723 [Fig. 3.20(c)] or its impregnation by an immersion liquid.172,788,798,1021
Figure 5.1 is a schematic representation of the human scleral sample structure and geometry of light irradiation. Analytical approaches for describing the propagation of light in the sclera are valid only when strongly simplifying assumptions are used, which make the model substantially less adequate. Thus, the direct simulation of photon migration in a medium using a Monte Carlo simulation was used for calculating spectral characteristics and photon statistics.172,798 The Monte Carlo simulation of the sclera transmission and reflection spectra was carried out using the probability function for the free photon path l (see Section 1.1.3). The ordering of scatterers (thin dielectric cylinders) was taken into account, using the
experimental radial distribution function g(r) obtained from electron micrographs of the human sclera 762,798 (Fig. 3.5). It was assumed that the ordering affects only
each individual event of the interaction between a photon and a particle. As the angular dependence of the scattered light intensity by a particle it was taken the scattering indicatrix for a fiber with a diameter corresponding to the modal value of the size distribution, 120 nm. The effect of the multiple scattering is included automatically in the procedure of simulation of the photon path by the Monte Carlo method, in that part of simulations the spatial distribution of scattering centers being assumed completely arbitrary. This approximation is valid if the dimension of the region of local ordering of scattering particles is far smaller than the mean free path of a photon in the medium, which takes place for the sclera.
The results of such modeling for a scleral sample (1-mm thickness, 120nm mean fibril diameter, and 285-nm mean separation between collagen fibrils; their refractive index nc = 1.474; and initial refractive index of interfibrillar space n0 = 1.345) are presented in Figs. 5.3–5.6. The collimated transmittance represents a fraction of photons leaving a tissue layer in the direction that differs from the direction of the incident radiation no more than by ±0.5 deg, which corresponds to their entering into the aperture of a spectrometer. Total transmittance and diffuse reflectance spectra accounting for a real geometry (losing of some amount of the scattered light) of the integrating spheres used in experiments were also calculated. The calculations were performed for different values of the refractive index of the background substance, from 1.345 to 1.450, corresponding to different levels of indices matching. It is clearly seen that the model describes the major features of normal and immersed tissue spectra in the visible range. A comparison of calculated and experimental spectra (see Fig. 5.7) shows that refractive index matching can be considered as the main mechanism responsible for tissue-enhanced translucence.
The Monte Carlo simulation technique allows one to describe the transition of the tissue scattering mode from complete diffusion to a coherent (ballistic photons
346 |
Controlling of the Optical Properties of Tissues |
(a)
(b)
(c)
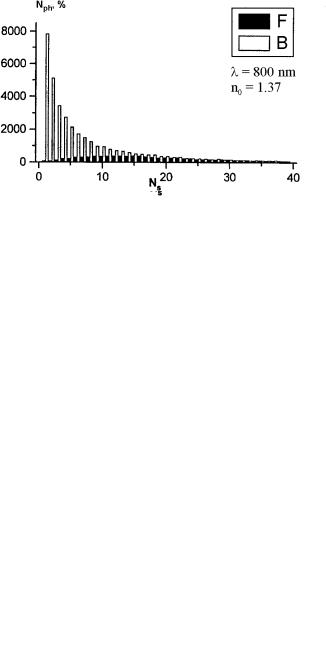
Figure 5.4 Distributions of the number Nph of forward-scattered (F) and backscattered (B) photons calculated by the Monte Carlo method that undertake a definite number of collisions Ns before escaping a human scleral slab of 1-mm thickness (two integrating sphere geometry) for slightly matched refractive indices of collagen fibrils and interfibrillar material (nc = 1.474, n0 = 1.370): (a) λ = 400 nm; (b) λ = 600 nm; (c) λ = 800 nm.439,798

Tissue Optics: Light Scattering Methods and Instruments for Medical Diagnosis |
347 |
(a)
(b)
(c)
Figure 5.5 Distributions of the number Nph of forward-scattered (F) and backscattered (B) photons calculated by the Monte Carlo method that undertake a definite number of collisions Ns before escaping a human scleral slab of 1-mm thickness (two integrating sphere geometry) for partly matched (midlevel) refractive indices of collagen fibrils and interfibrillar material (nc = 1.474, n0 = 1.410): (a) λ = 400 nm; (b) λ = 600 nm; (c) λ = 800 nm.439,798
348 |
|
|
|
Controlling of the Optical Properties of Tissues |
||||
|
|
|
|
|
|
|
|
|
|
|
|
|
|
|
|
|
|
|
|
|
|
|
|
|
|
|
|
|
|
|
|
|
|
|
|
|
|
|
|
|
|
|
|
|
|
|
|
|
|
|
|
|
|
|
|
|
|
|
|
|
|
|
|
|
|
|
|
|
|
|
|
|
|
|
|
|
|
|
|
|
|
|
|
|
|
|
|
|
|
|
|
|
|
|
|
|
|
|
|
|
|
|
|
|
|
|
|
(a)
(b)
(c)
Figure 5.6 Distributions of the number Nph of forward-scattered (F) and backscattered (B) photons calculated by the Monte Carlo method that undertake a definite number of collisions Ns before escaping a human scleral slab of 1-mm thickness (two integrating sphere geometry) for strongly matched refractive indices of collagen fibrils and interfibrillar material (nc = 1.474, n0 = 1.450): (a) λ = 400 nm; (b) λ = 600 nm; (c) λ = 800 nm.439,798
Tissue Optics: Light Scattering Methods and Instruments for Medical Diagnosis |
349 |
(a)
(b)
(c)
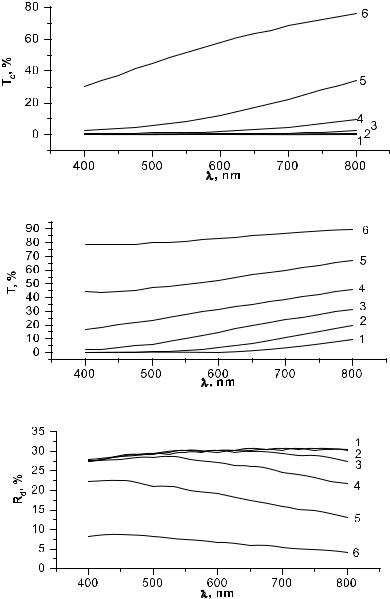
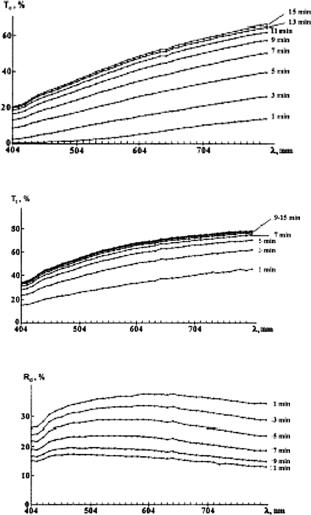
Figure 5.7 Experimental spectra of human scleral samples measured for different time intervals of administration of trazograph-60. Spectra were measured 1 min after the sample was immersed in solution and then at 2-min intervals. The measurement time for an individual spectrum, scanning from higher to lower wavelengths, was about 85 s. (a) Collimated transmittance Tc ; sample thickness, 0.6 mm. (b) Total transmittance Tt ; sample thickness, 0.7 mm. (c) Diffusion reflection Rd ; sample thickness, 0.7 mm (heavily pigmented tissue).172,1021
that for sclera with unmatched or slightly matched refractive indices (n0 = 1.370), there is a broad distribution of the number of scattering events (with the mean value of 25–30 collisions for the NIR region) that forward-traveling photons undergo; no ballistic photons (the coherent part of transmitted light) are seen. For fairly matched refractive indices, there are ballistic photons that come into being. In particular, for moderately matched refractive indices (n0 = 1.410), the unscattered and low-step
350 |
Controlling of the Optical Properties of Tissues |
scattered photons dominate in both directions, forward and back, with the mean number of collisions for the forward-traveling NIR photons of 3–4 and a rather big ballistic component. For strongly matched indices (n0 = 1.450), the ballistic component dominates and both scattering components in the forward and backward directions are small. In the NIR region, the optical clearing of tissue and transformation of scattering mode from multiple to low or even single steps begins much earlier than for visible light. A strong ballistic component formed at tissue clearing gives perspectives to coherent-domain diagnostic methods to be more widely used in biomedicine.
The total transmittance, diffuse reflectance, and collimated transmittance were measured in the 200–2200-nm wavelength range using a commercially available
Varian Cary 5E, 500, or 2415 spectrophotometers with an internal integrating sphere.172,571,971,972,1021 To reconstruct the absorption and reduced scattering co-
efficients of a tissue from such measurements, the inverse adding-doubling (IAD) method680 or inverse Monte Carlo (IMC) method was applied.960
For in vitro, and especially in vivo, studies of tissue optical clearing, fiberoptic grating-array spectrometers such as the LESA-5, 6, and 7 (BioSpec, Russia), and the PC1000, PC2000, and USB2000 (Ocean Optics Inc., USA) are
suitable due to their fast spectra collection in a course of immersion agent
action.575,704,960,965,978,980,986,987,831,1031,1034 Typically, the spectral range of inter-
est is from 400 to 1000 nm and the spectrometer fiber probe consists of seven optical fibers. One fiber transmits light to the object and six fibers collect the reflected radiation. The mean distance between the irradiating and receiving fibers is about 200 μm for the PC1000 and LESA-6, and about 2 mm for the LESA-5. The
spectrometers are calibrated using white slab of BaSO4 with a smooth surface. Spectra were measured in vitro with human sclera samples.172,1021 The sclera
was carefully purified from ciliary body and retina, washed, and cut into pieces of area 10 × 10 mm. The sclera sample was placed into a cell of volume 1 ml filled with osmotic liquid or physiological solution. Three different types of chemical agents were used for scleral optical clearing in Refs. 172 and 1021. The main parts of the experiments were performed using the x-ray contrast agent trazograph (a derivative of 2,4,6-triiodobenzene acid) with a molecular weight of about 500; 60% and 76% solutions in water. Some measurements were performed for two OCAs with quite different molecular weights, such as glucose ( 180) and PEG (6000 or 20,000). At room temperature and measured by the Abbe refractometer, refractive indices of some of the used agents were the following: trazograpth-60, n = 1.437; trazograph-76, n = 1.460; PEG (6000) solutions, n = 1.368 (0.4 g/ml), 1.394 (0.6 g/ml), 1.403 (0.8 g/ml), and 1.469 (1.0 g/ml); glucose solutions, n = 1.363 (0.2 g/ml), 1.378 (0.3 g/ml), 1.391 (0.4 g/ml), and 1.415 (0.54 g/ml). For the glucose-water solutions, the refractive index at any wavelength in the visible and NIR regions, where glucose has no strong absorption bands, can be estimated using Eqs. (1.202) and (2.36).
The typical transmission spectra Tc(λ) and Tt (λ), and diffusion reflection spectra Rd (λ) measured by the integrating sphere spectrophotometer for different time
Tissue Optics: Light Scattering Methods and Instruments for Medical Diagnosis |
351 |
intervals of trazograph-60 administration, are presented in Fig. 5.7.172,1021 It is easily seen that the untreated sclera is poorly transparent for visible and NIR light. Trazograph administration makes this tissue highly transparent—up to 70–75% at 600–800 nm for the sample kept in solution for 7–10 min. In addition, its spectral reflectivity decreased from 35–40% to 13–15% in this wavelength range.
In general, for many of measured samples, it can be concluded that for untreated scleral samples transmittance was less than 1–2% in the range of 400 to 500 nm and increased up to 6–30% for NIR wavelengths, depending on the sample thickness and pigmentation. Trazograph or other agent administration not only leads to increased transmittance but changes the form of the spectral curve: on average, for the short wavelengths, collimated transmittance increased from 1–2 to 20% (10–20 times) and for the long wavelengths from 20–30 to 50–80% ( 2.5 times).
For optically cleared sclera, the collimated light makes the main contribution to transmittance. Direct measurements performed for a scleral sample of 0.75-mm thickness treated with trazograph-60 for 40 min showed that transmittance for the
|
|
= |
= |
85% at 840 nm, |
detector acceptance angle of 30 deg T30 |
35% at 400 nm and |
|||
= |
= |
85% at 840 nm. It also follows from the CCD image |
||
Tc |
27% at 400 nm and |
|||
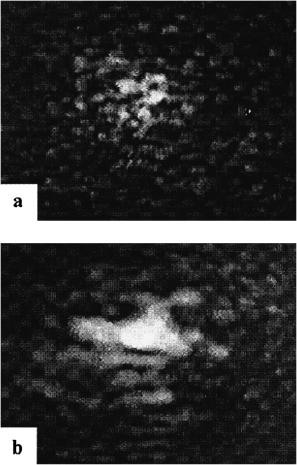
of a laser beam transmitted through the sclera at different levels of optical clearing (see Fig. 5.8), that showing the process of formation of a ballistic group of photons (see the center of the pattern) at reduction of scattering multiplicity. These images also qualitatively support the calculated statistics of photon interactions at tissue clearing (Figs. 5.4–5.6).
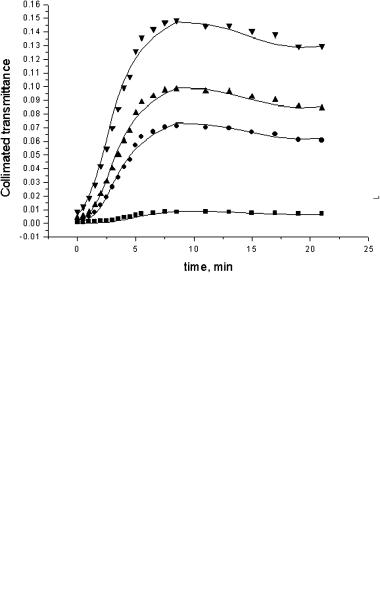
The efficiency of tissue clearing depends on the concentration and temperature of the solutions used. For bovine sclera at room temperature (18.5◦C), the maximum collimated transmittance at 450 nm is in the range Tc max = 13% (trazograph60), 22% (glucose, 45%), 39% (trazograph-76), and 46% [(PEG (6000), 80%]; and at 700 nm Tc max = 73% (glucose, 45%), 76% (trazograph-60), and 99% [trazograph-76 and PEGs (6000 and 20,000), 80%].1028 The maximal transmittance is achieved at 15–30 min. At physiological temperature, this time interval is considerably shortened. For example, for a PEG 20,000 solution (80%), the time interval for maximal tissue clearing changed from 27 min at 18.5◦C to 12 min at 38◦C.
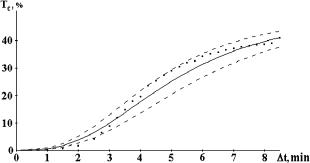
The time-dependent collimated transmittance of scleral sample measured at 633 nm concurrently with trazograph-60 administration is presented in Fig. 5.9. It shows the dynamics of tissue clearing. Similar characteristics were measured for glucose and PEG administration. The registration of the dynamic response of the intensity of transmission can be used to estimate diffusion coefficients of the interacting fluids: water and agent (trazograph, glucose, glycerol, PEG, etc.). Based on the theoretical background given earlier, we can estimate the coefficient of diffusion of the agent assuming that water and agent have the same paths for diffusion. The following set of equations gives the simple algorithm for diffusion coefficient determination: Eqs. (5.1), (5.4), (5.6), (5.14), and (5.17). More sophisticated algorithms accounting for tissue swelling and shrinkage and appropriate to
the measuring procedure of inverse optical problem solving (IAD, IMC) are also
available.960,986,987,1020,1022
352 |
Controlling of the Optical Properties of Tissues |
Figure 5.8 Specklegrams recorded at two different moments of time in the far-field zone for a sample of translucent human eye sclera irradiated with a focused beam of an He:Ne laser (633 nm). Enhanced translucence was provided by trazograph-60 in a cuvette during (a) 2.5 and (b) 10 min.343
Data for the diffusion coefficient values of different samples of human sclera are collected in Table 2 of Ref. 949. The estimated values of DT calculated using about 30 magnitudes of Tc measured for different time intervals for each sample have quite reasonable rms errors and differences in mean values from sample to sample. As can be seen from Fig. 5.9, the rms values include the low-frequency oscillations of Tc(t), which can be caused by spatial-temporal fluctuations of the
agent diffusivity at interacting with tissue structure. On average, the DT values are not far from the values of Da for diffusion of low-weight molecules in water.1066
It should be noted that for the hyperosmotic agents, fluid transport within tissue is more complicated because there are at least two interacting fluxes, so the model for describing these processes should be more complicated and should include monitoring additional measurement parameters such as the refractive index of the
Tissue Optics: Light Scattering Methods and Instruments for Medical Diagnosis |
353 |
Figure 5.9 The time-dependent collimated transmittance (dots) of a 0.5-mm-thick scleral sample measured at 633 nm concurrently with the administration of trazograph-60.172 The solid and dashed lines represent the mean value and the upper and lower limits of Tc obtained by a calculation of Tc using experimental data: DT = (1.46 ± 0.19) × 10−5 cm2/s.
chemical agent, tissue weight and/or thickness, and osmotic pressure in a process of tissue clearing. Such monitoring of the refractive index of a trazograph-60 in a bath during a process of scleral clearing gave 1.4370 (t = 0), 1.4321 (12 min), 1.4222 (20 min), and 1.4025 (40 min). Measurements of tissue samples’ weights before and after administration of the agents gave the following values: trazograph60 (sample 5 × 8 × 0.6 mm), 54 mg (t = 0) and 51 mg (34 min); glucose (40%, pH 3.5) (sample 10 × 11 × 0.5 mm), 82 mg (t = 0) and 66 mg (20 min); and PEG (6000) (1 g/ml) (sample 8 × 10 × 0.5 mm), 65 mg (t = 0) and 48 mg (60 min). Thus, the relative decrease of the sample weight is: 5.5% for trazograph-60, 15.5% for 40%-glucose, and 28% for PEG (6000). Both experiments with refractive index and weighting show differences in osmotic properties of the used agents and their tissue dehydration abilities, which are in the range: low (trazograph-60), midlevel (40%-glucose), and high [PEG (6000)]. It follows from the experiment that in optical clearing of the sclera, trazograth-60 dominates the process of the replacement of the interfibrillar fluid (mostly water) by trazograph-60, which has a refractive index higher than water. The rather large reduction of refractive index in the bath with the sample means that water effectively escapes tissue and small loss of sample weight indicates that water is replaced by trazograph-60. Thus, we may assume that in the system there are two approximately equal fluxes moving through a tissue layer: the water flux JW directed out of a layer and a dissolved matter flux JS into a layer, which are proportional to the gradients of the chemical potential of water and dissolved matter [see Eq. (5.19)].1066 For glucose, and especially for PEG, dehydration plays an important role due to the unequality of two fluxes: the water flux JW out of a tissue layer is stronger than a dissolved matter flux JS into a layer. Thus, structural changes of collagen fibrils and interfibrillar spacings caused by tissue dehydration and described in Section 5.2.3786 should be accounted for in the tissue-clearing model based on tissue dehydration.
The interaction of the OCA penetrated inside a tissue with collagen fibrils may be responsible for a quasi-periodic low-frequency (3–4 min of period) oscillations
354 |
Controlling of the Optical Properties of Tissues |
of the light transmittance that are well seen in Fig. 5.9. The oscillating character of tissue response may be explained as a multistep origin of fluid diffusion.172,343
The first step, OCA penetration into the tissue, leads to refractive index matching of interstitial fluid and hydrated fibril collagen—the significant translucence of tissue growth. The second step is characterized by the interaction of the OCA, contained within the renovated interfibrillar liquid with fibril collagen, which leads to collagen dehydration and consequent growth of its refractive index that slightly breaks down optical matching and causes a slight decrease of transmittance. The subsequent imbalance of water-OCA concentrations leads in turn to penetration of an additional amount of OCA into the sample, which causes reestablishment of the refractive index matching and a corresponding light transmittance—this is the origin of the third step. The inertia of each of the considered processes may cause the establishing of a quasi-periodic oscillation with the period and amplitude, depending on parameters of the nonlinear system. Rather regular oscillations of OCT image depth of hamster and rat skin with the period close to 2.5 and 3.5 min, respectively, was also found at tissue immersion by glycerol.1059
Measured values of osmotic pressure for trazograph-60 were equal to 4.3 MPa, and 7.1 MPa for trazograph-76.172 For untreated sclera, the value of osmotic pressure was equal to 0.74 MPa, and it increased after administration of trazograpth-60 for 30 min—up to 5.02 MPa. On one hand, the osmotic pressure causes the flows generation and their intensities [see Section 5.2.2 and Eqs. (5.19) and (5.20)]; but on the other hand, rather strong osmotic pressure may destroy tissue structure. A direct histological study showed that there were no serious irreversible changes in the cellular and fibrous structure of human sclera for a rather long period of OCA administration.1029 For example, for a trazograph-60, the time is at least about 30 min, and rather minor changes of tissue structure, which are characterized by a moderate tissue swelling, were seen.
The reversibility of tissue structure change at an OCA administration is also demonstrated by the data in Fig. 5.10,343,1030 which show that the multiple-single
scattering transition (i.e., optical translucence, improvement of linear polarization) is reversible when the OCA bath is replaced by a physiological solution and vice versa when the OCA is administrated again.
The theoretical and experimental results show that administration of OCAs to the sclera affects the refractive index matching of the collagen fibrils and interfibrillar fluid, leading to dramatic changes (a reduction) in the scattering properties of the sclera. For different OCAs, refractive index matching can be implemented in different ways: (1) water can leave the interfibrillar space and exit the sample (dehydration); (2) the administered fluid can enter the tissue and fill up the interfibrillar space, and water can partly leave the interfibrillar space and partly exit the sample. The first mechanism is characteristic only for highly hyperosmotic agents. For fibrous tissue similar to sclera, the second mechanism is preferable for all tested chemical agents because their molecule sizes are much less than the mean cross section of interfibrillar space, which is about 185 nm, whereas the diameter of the biggest molecule of PEG (20,000) should be less than 5 nm. Indeed, the

Tissue Optics: Light Scattering Methods and Instruments for Medical Diagnosis |
355 |
Figure 5.10 Temporal dependencies for the values of mean speckle intensity Is and its polarization components I and I measured in the paraxial region of a sample of human sclera with a thickness of 0.4 mm and averaged over the scanning trajectory (1.5 mm): 1, 2, 3, sequential measurements with a sample that was first placed in trazograph-60, then in physiological solution (0.9% NaCl), and then again in trazograph-60; λ = 633 nm.1030
structure of the interfibrillar matrix and molecular structural properties may also have their influence on diffusion; thus, the diffusivity of foreign molecules and the corresponding strength of the water flux is different for the various agents used. A stronger water flux in the sclera was induced by PEGs, a midlevel one by 40%- glucose, and a small one by trazograph-60 (see weight measurements).172
The dynamics of tissue optical clearing using OCA is defined by a characteristic time response of about 3 to 10 min. This is in good agreement with results obtained by Rol,723 but he used a pointwise mechanical stress or local heating induced by a laser beam. Actually, as follows from Eq. (5.19), osmotic pressure and hydrostatic pressure caused, for example, by mechanical stress, have the same mechanism for inducing the fluid flux, and the time response is defined by water diffusion through the interfibrillar space. Therefore, optical clearing using local mechanical stress should be somewhat equivalent to the action of a hyperosmotic agent because a local stress picks up water from the compressed site and diminishes the tissue layer thickness. In practice, optical clearing with OCAs may be preferable over a mechanical stress because there are more possibilities to control the time/spatial response and efficiency using various chemical agents; in addition, the function of these agents may be combined (tissue optical clearing and treatment).
These results are general and can be used to describe many other fibrous tissues. It should be noted that human sclera can be considered a living scattering etalon in the visible range, like a white glass (see diffuse reflectance spectra in Fig. 5.7). For example, due to the simpler structure and stable and controllable parameters
of sclera in comparison with skin, light-scattering technologies of glucose monitoring designed for skin measurements339–341,534,549–551 may be more effective in
the application to sclera. In this connection, it is interesting to analyze a change in the sclera color during its clarification.410,798 The quantitative estimation of this
356 |
Controlling of the Optical Properties of Tissues |
change from transmission and reflection spectra in Fig. 5.7 was done by calculating the chromaticity coordinates for the CIE 1964 color system. From the calculated color triangles follows that the native sclera has a reddish tint in the transmitted light; however, this does not appreciably change the visual perception because of a very low transmission coefficient. During sclera clarification, its color becomes whiter. In diffuse reflectance, the native sclera is white, as is visually observed. Upon clarification, the sclera color in the reflected light slightly shifts from white to bluish.
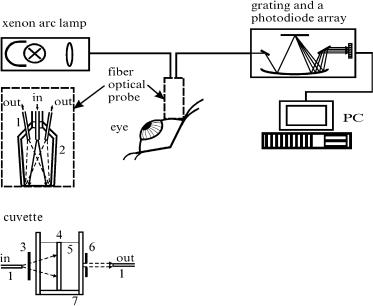
Figure 5.11 Experimental setup for in vitro and in vivo measurements of the collimated light transmittance and the reflectance spectra.960 In vitro measurements: 1, optical fiber; 2, aluminum jacket; 3, neutral filters; 4, sclera sample; 5, OCA; 6, 0.5 mm pinhole; 7, cuvette.
To study more precisely the time-dependent transmittance and reflectance of a tissue, a fiber-optic photodiode array or CCD spectrometer that provides a fast collection of spectra should be used. This is especially important for diffusion coefficient determination in in vitro studies and in in vivo monitoring of tissue clarification. A fiber-optic photodiode array spectrometer, as shown in Fig. 5.11, detailed in vitro measurements for human sclera at tissue impregnation by various solutions such as glucose, trazograph, verografin, and propylene glycol, which do not have strong absorbing bands within the spectral range of interest, 400–800 nm.986 In the in vitro study, the conjunctiva and ciliary body, as well as the retina with choroid were removed. The mean thickness of samples was about 0.5 mm. They were fixed on a plastic plate with a square aperture 5 × 5 mm (effective impregnation by a chemical agent via both surfaces of the sample was provided) and placed in a 5-ml cuvette filled with the solution under study.
Tissue Optics: Light Scattering Methods and Instruments for Medical Diagnosis |
357 |
Figure 5.12 The time-dependent collimated transmittance spectra of a human sclera sample impregnated by 40%-glucose: (1) 10 sec; (2) 1 min; (3) 2 min; (4) 3 min; (5) 4 min;
(6) 5 min; (7) 6.5 min; and (8) 8.5 min after the scleral sample was immersed in 40%-glucose.960
Figure 5.13 The time-dependent collimated transmittance of a human sclera sample measured at 420 nm (squares); 589 nm (circles); 630 nm (up triangles); and 700 nm (down triangles) concurrently with administration of 40%-glucose.960
To understand the mechanisms of scleral tissue optical clearing, the collimated transmittance spectra and change of the scleral sample weight were measured concurrently with the administration of glucose solution. Figures 5.12, 5.13, and 5.14 illustrate the dynamics of the transmittance spectra and typical weight change. It is easily seen that the untreated sclera is a poorly transparent media for the visible
358 |
Controlling of the Optical Properties of Tissues |
Figure 5.14 The calculated time-dependent thickness of a human sclera sample (Monte Carlo simulation as the best fit to the experimental data for the collimated transmittance shown in Figs. 5.12 and 5.13).703
light. Glucose administration makes this tissue highly transparent. As it follows from Fig. 5.13, the characteristic time response of sclera optical clearing is about 5 min.
Based on these measurements and accounting for the fact that a commercially available 40%-glucose from the drug store, which has a low pH of 3.5, was used, the following model of action of an osmotically active liquid on a fibrous tissue seems to be adequate. At the first stage, which takes place approximately 5 min after a sample is placed in glucose solution, the substantial optical clearing was accompanied by the sample thickness decrease. Thus, we may suppose that optical clearing occurs due to two main mechanisms: (1) refractive index matching between collagen fibers and penetrated glucose, and (2) glucose osmotic action that dehydrates tissue, resulting in up to 25% decrease of thickness. In the late stage of glucose administration, to the seventh minute, the optical clearing process saturates due to equilibration of fluid (glucose, water, proteins, salts, etc.) concentrations in the system and the thickness increases somewhat. From the seventh to the fifteenth minute, the inclusion of the thickness change (increase to its initial thickness) in optical clearing is well seen on the background of the inclusion of the saturated molecular fluxes—collimated transmittance is slightly reduced, but is still very high. The further tissue swelling with time up to 20% of the initial thickness to the twenty-first minute does not seriously influence tissue transmittance. It is important that in spite of the complex behavior of tissue thickness at administration of this specific chemical agent (40%-glucose with pH 3.5), thickness variations do not strongly affect the optical clearing. Such nonmonotonous behavior of tissue thickness (first shrinkage and later swelling) can be explained using the results of Ref. 786, where it was experimentally shown that for bovine sclera, hydration (swelling) may change from H = 2.48 for pH 7, close to physio-
Tissue Optics: Light Scattering Methods and Instruments for Medical Diagnosis |
359 |
logical, to H = 7.15 for pH 3. In our case, this means that at the first stage when the tissue pH, which is close to the physiological one, is not seriously affected by glucose (a small amount penetrated into the sclera), the dehydration of tissue dominates due to osmotic action of glucose; but in the late stages of glucose administration, due to a large amount of glucose penetrating and in the bath, the pH of the whole system (tissue/glucose bath) is reducing and swelling takes place.
It should be stressed again that the discussed effects with tissue shrinkage and swelling are important but do not dominate at glucose action; thus, the experimental data for the collimated transmittance (Figs. 5.12 and 5.13) and the time-
dependent measurements of tissue sample thickness changes under OCA action (Fig. 5.14) can be used to estimate the glucose diffusion coefficient in sclera.442,703
The detailed model of glucose transport in fibrous tissue is described in Ref. 987. Equations (5.1), (5.6), (5.14), and (5.17) are the basis for this model, which can be used for reconstruction of the diffusion constant. The estimated average value of the diffusion coefficient of 40%-glucose transport in the scleral sample is DG = (3.45 ± 0.46) × 10−6 cm2 s−1 at a temperature of 20◦C. This value is not far from the values of Da for diffusion of low-weight molecules (such as
sucrose, glucose, etc.) in water at zero concentration (3.6–5.2) × 10−6 cm2 s−1 at 12–15◦C.1066,1068,1069 When hyperosmotic agents are used, the diffusion coef-
ficient should be close to that of water diffusion in a tissue because this is the main flux in the system. Depending on the tissue structure, this value should
be equal to or above the value of the diffusion coefficient of water in water, DW = 2.5 × 10⁻⁵ cm2 s−1.
The diffusion coefficient is a function of the dimension and form of the diffus-
ing molecule,1066 |
|
Da = const × M−S . |
(5.25) |
For small molecules, S = 1/2, and for spherical molecules diffusing in water (large proteins), S = 1/3. In general, the parameter S for diffusion in water is in the range 0.3–0.5, and for diffusion through a biological membrane, it is about 3.5. For example, changing of the molecule weight M from 45 to 122 at diffusion in water changes the diffusion coefficient from 1.6 × 10⁻⁵ cm2 s−1 to 0.8 × 10⁻⁵ cm2 s−1
(twofold); and for the same molecules’ diffusion through the plasmatic membrane, from 1.4 × 10⁻⁸ cm2 s−1 to 2.0 × 10⁻¹⁰ cm2 s−1 (70-fold).1066
5.3.2 Scleral in vitro frequency-domain measurements
The dynamic response of optical properties (modulation depth and phase shift of intensity modulation of the backscattered light) of human eye sclera in respect to the interval of an OCA administration can be measured using a photon-density wave (frequency-domain) technique.961 When the intensity of the light source is modulated at a frequency ω, a photon-density wave is induced in a scattering

360 |
Controlling of the Optical Properties of Tissues |
|
medium as1–4,129 |
|
|
|
A(r) = Adc + Aac exp[−i(ωt − θ)], |
(5.26) |
where Adc, Aac, and (ωt − θ) are the dc and ac components of the amplitude of the photon-density wave and its phase, respectively.
Photon-diffusion theory provides independent determination of the absorption and reduced scattering coefficients from the measurements at a single modulation
frequency. The expressions for the measured quantities phase delay θ and ac amplitude Aac have been presented elsewhere1–4,129 (see Sections 1.3 and 7.2). These
expressions depend on the source-detector separation rsd, reduced scattering coefficient μs, and absorption coefficients μa.
(a) |
(b) |
Figure 5.15 Frequency-domain measurements. The time-dependent changes in the amplitude of an optical signal from a human eyeball in situ after (a) trazograph-60 injection and
(b) trazograph-60 drops in the vicinity of the detector fiber tip.961
Data shown in Fig. 5.15 are the temporal changes of ac amplitude during trazograph-60 administration for three different source-detector separations and two different techniques of immersion solution administration, by injection and by drops. The intensity and phase of photon-density waves generated by the NIR optical source were measured at several source-detector separations. The light source was a laser diode with a wavelength of 786 nm and 4-mW power at the end of a coupled multimode fiber (core diameter of 62.5 μm).961 The intensity modulation depth of approximately 80% at a frequency of 140 MHz was provided by modulation of the injection current of the laser diode. The experimental setup was designed at the University of Pennsylvania. A multifiber detection system with small sourcedetector separations together with a Dicon multichannel fiber-optic switcher was used for the immersion experiment on human sclera in situ for a whole eyeball. The clearing of scleral tissue was observed during the first 3 min of trazograph-60 administration by injection. For small source-detector separations (about 1–2 mm)
Tissue Optics: Light Scattering Methods and Instruments for Medical Diagnosis |
361 |
and a relatively large one (3.5 mm), the temporal dependencies are quite different. Keeping in mind that in the first 3 min after injection of the OCA the positive time scale corresponds to a decrease of scattering due to tissue immersion, the opposite tendencies of considered dependencies can be understood as follows. For the small source-detector separation close to the back-reflectance geometry, the intensity of reflected light decreases along with scattering decrease; and for rather large separations, where lateral photon diffusion effects are important, the intensity at first goes up with decreased scattering, but if scattering continues to decrease, intensity will lessen. That is why a local maximum on a curve for a separation of 3.5 mm was observed. At the third minute after OCA injection, due to its diffusion into neighboring tissue regions, amplitudes for all separations have a tendency to go to the initial values. Another technique of OCA administration by drops shows the same tendencies for small and large separations as for injection, but essential changes of the amplitudes happen momentarily after chemical agent drops are applied, and then amplitudes slowly change in opposite directions. Such behavior depends on the specific features of an OCA application, which are (1) superficial impregnation (underlines the importance of surface immersion effect) and (2) continuous renovation of the OCA on the tissue surface (many drops during the measurement interval).
This study, which was performed under circumstances that are very close to in vivo measurements, also shows that the impregnation of eye sclera by a hyperosmotic OCA affects the reversible refractive indices matching the collagen fibrils and interstitial media that leads to dramatic reduction of the tissue scattering ability, up to 60% in ac signal change for 10–12 min at trazograph-60 application.
5.3.3 Scleral in vivo measurements
In vivo measurements were done for rabbit eye using the experimental setup presented in Fig. 5.11. Experimental spectra and dynamic response on selected wavelengths are shown in Figs. 5.16 and 5.17. The surface temperature of the rabbit eye was 38◦C. 40%-glucose was used as a chemical agent for the scleral optical clearing, administered in the form of eye drops. A significant decrease of the reflectance during the first 5 min of glucose administration is seen. Dips appearing at 420, 530, and 570 nm are caused by blood perfusion. The lower reflectance at 420 nm is caused by the strong absorption of blood. Evidently, faster decay at this wavelength reflects blood perfusion dynamics due to eye conjuctiva and sclera inflammation induced by light irradiation and the osmotic action of glucose. Because blood absorption has less influence at 630 to 700 nm, measured dynamic responses can be used for in vivo estimation of diffusion coefficient for glucose in scleral tissue.
From the experimental data presented in Figs. 5.16 and 5.17, one can see that for in vivo measurements reflectance decreases up to twofold; such a value of decrease is comparable with in vitro studies for trazograph-60 immersion [see Fig. 5.7(c)]. Transmittance measurements are difficult to provide in in vivo experiments; thus, to estimate translucent efficiency at optical immersion, we may
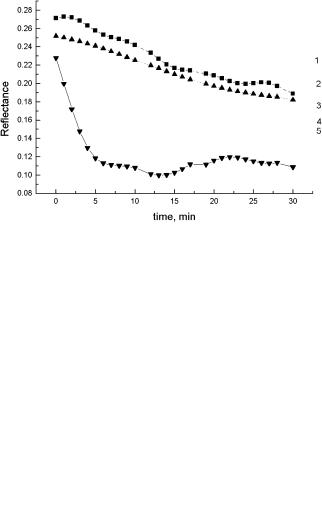
362 |
Controlling of the Optical Properties of Tissues |
Figure 5.16 The in vivo time-dependent reflectance spectra of rabbit eye sclera measured concurrently with administration of 40%-glucose solution: 1, 1 min; 2, 4 min; 3, 21 min;
(4) 25 min; and (5) 30 min after drop of glucose into the rabbit eye.960
Figure 5.17 The in vivo time-dependent reflectance of rabbit eye sclera measured concurrently with administration of 40%-glucose at 420 nm (a), 630 nm (2), and 700 nm (Q).960
use results of in vitro measurements of collimated transmittance that show up to a 26-fold increase in transmittance. Using Monte Carlo modeling based on experimental data and the arrangement used for in vivo and in vitro measurements, a correct comparison of in vivo and in vitro clearing efficiency can be done.1032 The calculated ratios of maximal (untreated tissue) to minimal (well-treated tissue) diffuse reflectance Rd for in vitro and in vivo measurements show the same tendency of their change with the wavelength. Differences in the absolute values of this ratio
= |
= |
2 for in vivo at 700 nm), which are higher for the in vivo |
( |
1.2 for in vitro and |
case, can be explained by a multilayered structure of the living tissue (consisting of the conjunctiva, the Tenon’s capsule, the sclera itself, the ciliary muscle, and the ciliary pigmented epithelium)—some of which are extremely absorbing. The
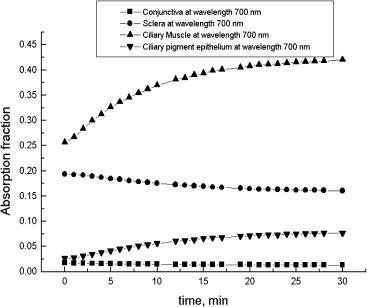
364 |
Controlling of the Optical Properties of Tissues |
40%-glucose is shown in Fig. 5.18. The initial values of the scattering and absorption coefficients for various tissue layers were taken from Refs. 266 and 267. The time-dependent diffuse reflectance, the total transmittance, and the light absorbed fractions at tissue immersion were calculated using the in vivo studies discussed above. From the graphs of Fig. 5.18, it follows that due to a significant translucence of the upper layers of the rabbit eye, the lower absorbing layers of the eye membrane, such as ciliary body components, are well irradiated, and thus absorb light well. It is found that as far as the light absorption fraction in the conjunctiva and the sclera is decreased, in the ciliary body, it is considerably increased.
This confirms the declared possibility of using OCAs for the transcleral selective phodestruction of the ciliary body.61,723,788
It is shown that administration of OCAs to a fibrous tissue allows one to effectively control its optical characteristics. The dynamics of scleral tissue optical clearing is characterized by a time response of about 5–10 min, which is defined by the diffusivity of an immersion agent in a tissue, tissue condition (intact or fixed), and tissue thickness. The tissue shrinkage and swelling may play an important role in the tissue clearing process. At a prolonged time of some OCAs’ administration (for example, glucose at pH 3.5), tissue shrinkage at the first step of clearing may be replaced by a swelling, which in its turn may cause saturation or even slight reduction of tissue optical transmittance.
Dynamic optical characteristics can be used for the determination of the diffusion coefficient of endogenous (metabolic) and exogenous (chemical agent) fluids in human tissues. Obtained values for diffusion coefficient of glucose, trazograph, and PEG (6000) in intact human sclera correspond well to values of the diffusion coefficient for small molecules diffusing in water.949
5.3.4 Dura mater immersion and agent diffusion rate
Optical clearing of human dura mater is important for cerebral optical diagnostics, phototherapy, and laser surgery. Dura mater is a typical fibrous tissue and demonstrates the same behavior of optical clearing as eye sclera, cornea, or skin dermis and muscle, but has its own diffusion coefficient, characteristic time, and degree of clearing, defined by its structure. The first results from an in vitro experimental study of human and rabbit dura mater optical clearing under the action of mannitol, glucose, and glycerol solutions at various concentrations are presented in Refs. 704, 831, 969, 987, and 1024.
Figure 5.19 illustrates the dynamic changes in rabbit dura mater turbidity after application of glycerol.831 A resolution target was placed under a sample. After the treatment of glycerol for 1 min, the target, which was not visible under the native dura mater [Fig. 5.19(a)], was seen through the specimen [Fig. 5.19(b)]. Results of the measurement of the optical properties [Fig. 5.19(c)] confirm the visually observed reduction in scattering. Figure 5.19(c) shows the increase in transmittance within the wavelength range of 400–750 nm as a function of the time the sample was soaked in glycerol. The hemoglobin absorption became much more prominent
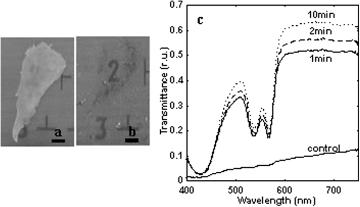
Tissue Optics: Light Scattering Methods and Instruments for Medical Diagnosis |
365 |
after application of glycerol [Fig. 5.19(c)]. This indicates that the quality of images received by techniques based on the detection of hemoglobin absorption spectra can be significantly improved at reduction of scattering of the tissue upper layers. In vivo studies of glucose and glycerol action on rabbit dura mater at the open cranium and with epidural agent application also confirm the concept of effective optical clearing of fibrous tissue.831 Total optical clearing was achieved very fast in 1950s after tissue treatment by glycerol.
Figure 5.19 Visual changes in in vitro turbid rabbit dura mater and the measured optical changes before and after epidural application of glycerol. (a) Native dura mater placed over the resolution target, bar = 1 mm. (b) One-minute application of glycerol, bar = 1 mm.
(c) Transmittance spectra for native dura mater measured at application of glycerol for 1, 2, and 10 min.831
Figure 5.20 presents the collimated transmittance spectra and temporal dependencies of the spectral components for human dura mater samples impregnated by glucose solution. It is well seen that glucose is also a very effective agent for dura mater clearing. Using such measurements for glucose and mannitol, and the algorithm described in Refs. 960 and 987, the diffusion coefficients for 40%-glucose
and mannitol solution (0.16 g/ml) were found: DG = (5.43± 0.88) × 10−6 cm2 s−1 and DM = (1.67 ± 0.21) × 10−6 cm2 s−1.949,987
5.4 Skin
5.4.1 Introduction
Skin has a very complicated structure, which is schematically presented in Fig. 5.21. It possesses a protective function that prevents penetration of pollutions and microorganisms inside the body. The outermost cellular layer of skin is the epidermis, which consists of stratum corneum (SC) (mostly dead cells) and four layers of living cells. Stratum corneum is a lipid-protein biphasic structure that has a thickness of only 10–20 μm on most surfaces of the body. Due to cell membrane
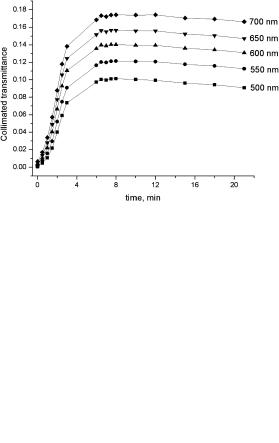
366 |
Controlling of the Optical Properties of Tissues |
(a)
(b)
Figure 5.20 (a) The collimated transmittance spectra and (b) corresponding temporal dependencies measured for a human dura mater sample in a course of administration of 40%-glucose solution in a bath.969,987
keratinization, tight packing of cells, and lipid bridges between them, SC is a dense medium with a poor penetration for foreign molecules.1070,1071 The excellent dif-
fusional resistance of the SC makes the transdermal delivery of immersion agents and water lost by skin difficult. To understand the transport and barrier functions of
the skin, it is important to have knowledge of the water and ion distribution within the different layers.1072,1073 Water content is known to influence various physical
characteristics, such as brittleness, elasticity, tensile strength, and viscoelasticity; barrier characteristics; electrical resistance; thermal conductivity; and appearance. The SC receives water from within the body, but water may also be taken up from the environment. From within the body, water reaches this tissue from the sweat glands and by diffusion from underlying tissues. In vivo diffusion of water across the SC is a passive process that can be modified at application of hyperosmotic agents. The water content of the innermost layer of the SC is in equilibrium with

Tissue Optics: Light Scattering Methods and Instruments for Medical Diagnosis |
367 |
the adjacent moist granular layer. The outside cell layer, however, is in equilibrium with the environment and it is certainly drier than the innermost cornified layer. Thus, there exists a concentration gradient causing transepidermal water lost (TEWL).
No significant difference was found for the diffusion across epidermis and SC. The diffusion coefficient D of the flow in water through a stationary macromolecular gel (the tissue) corresponds to viscose flow through a very fine porous medium.
As has been determined in strongly hydrated SC, D is about four orders of magnitude less than the water self-diffusion coefficient.1072 The diffusivity (D) of water in SC increases from 3 × 10⁻¹⁰ to 10−9 cm2/s as humidity H increases from 46
to 81%. It should be noted that the hydration of the dermis is not significantly different from that of the viable cell layers of the epidermis.1073 The average water
content of the SC as measured in Ref. 1073 is 54%, while other authors arrived at a water content as low as 15 to 40% in the same layer. The rate of diffusion of
molecules with a molecular weight of 119 in the SC of volunteers is in the range from 10−10 to 3.5 × 10⁻¹⁰ cm2/s.1071
Dermis is the next thicker layer of the skin, which is mostly fibrous tissue well supplied by blood and thus can be easily impregnated by exogenous or endogenous liquids (immersion agents). Subcutaneous tissue contains a big portion of a fat cellular layer, which is much less penetrative for diffusing molecules than dermis. Such a specific structure of skin defines the methodology of its effective optical clearing, which is related to the immersion of refractive indices of scatterers
(keratinocyte components in epidermis, collagen and elastin fibers in dermis) and ground matter.57,213,571,946,965,1065 Experimental studies of optical clearing of skin
using water, glycerol, glycerol-water solutions, glucose, propylene glycol, oleic acid, DMSO, sunscreen creams, cosmetic lotions, gels, and pharmaceutical products were carried out in Refs. 57, 213, 255, 343, 571, 704, 777, 946, 947, 949, 953, 961–965, 969, 973, 975, 1027, 1030, 1039, 1047–1049, 1052, and 1055–1065.
5.4.2 In vitro spectral measurements
Table 5.1 illustrates the efficiency of the different immersion agents’ action on the transmittance of the human skin stripped samples (30–40 μm in thickness) taken from volunteers using glass substrate-glue technology.1065 Because of the small thickness of the sample with a few layers of dried and living keratinocytes and
Table 5.1 The efficiency of the OCA action on the skin stripping sample of 30–40 μm in thickness, expressed as a ratio of mean transmitted intensities after (IA) and before (IB ) lotion application; n is the index of refraction of the used lotion.1065
OCA |
Glycerol-water-urea solutions |
|
|
DMSO |
Ultrasound |
||
|
|
|
|
|
|
50% |
gel |
|
|
|
|
|
|
|
|
n |
1.449 |
1.380 |
1.356 |
1.354 |
1.348 |
1.396 |
1.337 |
IA/IB |
12.8 |
3.7 |
4.9 |
5.9 |
4.1 |
7.9 |
5.3 |
|
|
|
|
|
|
|
|
368 |
Controlling of the Optical Properties of Tissues |
the agent supply through the living cell layer, the rate and efficiency of immersion were very high.
An in vitro study of rat dorsal skin impregnated by anhydrous glycerol, when the agent was applied to the dermal side of the skin sample, showed a power wavelength dependence of the reduced scattering coefficient in the wavelength range from 500 to 1200 nm, described by Eq. (1.179), μs λ−h, with reduced scattering coefficient at 500 nm μs ≈ 50 cm−1 and h = 1.12 for normal skin, and with subsequent decrease in μs (500 nm) and h with increased time in glycerol (mostly due to the dehydration effect): μs ≈ 30 cm−1 and h = 1.09 for 5 min, μs ≈ 20 cm−1 and h = 0.85 for 10 min, μs ≈ 12 cm−1 and h = 0.52 for 20 min, and μs ≈ 23 cm−1 and h = 0.9 for the rehydrated sample kept in a physiological phosphate-buffered saline solution for 20 min.571 A 60% decrease in hydration was estimated on the basis of changes in the water absorption peaks and a 21.5% corresponding decrease in thickness was found going from the native tissue to the tissue treated with glycerol for 20 min. The rehydration process caused the thickness and turbidity of the sample to go back toward the initial state, but during the course of rehydration, which lasted 20 min, the turbidity (μs) did not reach the initial state. Accounting for the relatively short period of time ( 20 min) for the optical clearing of the skin samples of about 1 mm in thickness in this experiment and high viscosity of glycerol, its action as a hyperosmotic agent should mostly have drawn interstitial water out of the tissue and, at a slower rate, should have replaced the water and salts of the ground substance. The 20 min of rehydration are also not enough for water to reenter all of the cells and collagen fibers in the tissue; thus, the scattering coefficient and spectral power parameter h for rehydrated tissue are somewhat less than their initial values.
More prolonged administration of glucose (up to 6 hr) and glycerol (up to
45 min) into the fresh rat skin samples at room temperature in the course of tissue collimated transmittance measurements was also done.1031,1038,1039 These studies
were performed to clarify the mechanisms of the skin optical clearing and to optimize the technique. To avoid tissue damage and to provide a lower viscosity of the chemical agent, a glycerol-water solution (88%) and 40%-glucose (both are available in a drug store) were used as immersion agents. Skin samples were of 0.57–0.90 mm in thickness and 1 × 1 cm2 in area, some of them contained whole skin including epidermis, dermis, and hypodermic fatty layer, and for others the fatty layer was removed. Hairs were removed by tweezers and the immersion agent was applied to both sides of the sample in a bath. Figures 5.22 and 5.23 illustrate the typical collimated transmittance spectra and optical clearing dynamics. It is well seen that the untreated rat skin is poorly transparent for visible light. Both glucose and glycerol administration make this tissue highly transparent; the 15fold increase of the collimated transmittance for glucose [Fig. 5.23(a)] and 10-fold increase for glycerol [Fig. 5.23(c)] at 700 nm for the samples with a fatty layer kept in solution for 45 min are seen. The efficiency is substantially greater with removed fatty layer [Fig. 5.23(b)]; about a 50-fold transmittance increase is seen for the glucose solution at the same wavelength during the same time interval, and
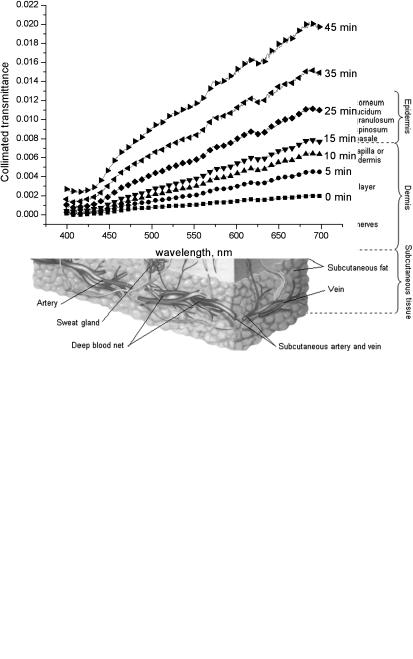
Tissue Optics: Light Scattering Methods and Instruments for Medical Diagnosis |
369 |
a further increase of transmittance and its saturation happens for more prolonged time intervals.
Figure 5.21 Human skin structure.
Figure 5.22 Collimated transmittance spectra of a rat skin sample measured concurrently with administration of 88%-glycerol at different time intervals (sample thickness of 0.9 mm).1031
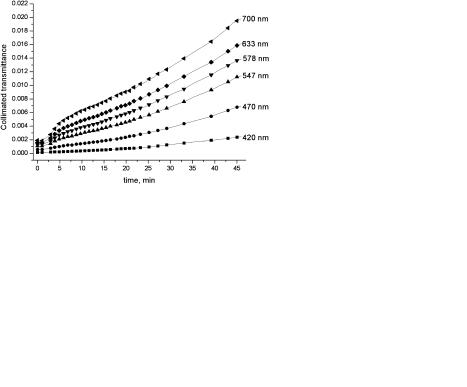
370 |
Controlling of the Optical Properties of Tissues |
(a) |
(b) |
(c)
Figure 5.23 The time-dependent collimated transmittance of rat skin samples (1 hour after autopsy, hairs were removed with tweezers) measured at different wavelengths in a course of administration of immersion solution in a bath. (a) Sample thickness 0.73 mm, with hypodermic fatty layer, immersion agent 40%-glucose; (b) sample thickness 0.57 mm, with removed hypodermic fatty layer, immersion agent 40%-glucose; (c) sample thickness 0.9 mm, with hypodermic fatty layer, immersion agent glycerol-water solution (88%, vol/vol).1038,1039
Table 5.2 presents characteristics (refractive index and osmolality) of a variety of chemical agents with different optical clearing potential (OCP), defined as the
ratio of the values of tissue reduced scattering coefficient before and after agent action, OCP ≡ μs(before)/μs(after).1055 OCP was measured in vitro at agent ap-
plication to the dermis side of human skin using a Franz diffusion chamber after a 20-min application time. It follows from Table 5.2 that there is no correlation between OCP and refractive index for used agents with indices in the range from 1.43 to 1.48, as well as no correlation with osmolality in a wide range from 1,643 to 26,900 mOsm/kg, but the highest values of OCP, from 2.4 to 2.9, are provided by the agents having both the highest refractive index and osmolality, such as glycerol, 1,4-butanediol, and 1,3-butanediol.
It is evident that the penetration rate of the OCA into the skin is much slower than that for sclera or dura mater, which take only 8–10 min to be saturated by trazograph or glucose solutions. In comparison with sclera and dura mater, no sat-

Tissue Optics: Light Scattering Methods and Instruments for Medical Diagnosis |
371 |
Table 5.2 OCA characteristics and in vitro measured optical clearing potential (OCP) at agent application to dermis side of human skin using a Franz diffusion chamber; OCP is defined as the ratio of values of tissue reduced scattering coefficient before and after agent action, OCP ≡ μs(before)/μs(after), was measured after 20 min application time.1055
OCA |
Refractive |
Osmolality |
OCP |
|
index |
(mOsm/kg) |
|
|
|
|
|
Glycerol |
1.47 |
14,550 |
2.9 ± 0.8 |
50% TMP (trimethylolpropanol) |
1.43 |
6,830 |
2.2 ± 0.3 |
100% TMP |
1.47 |
13,660 |
2.1 ± 0.7 |
1,3-butanediol |
1.44 |
22,050 |
2.4 ± 0.7 |
1,4-butanediol |
1.44 |
26,900 |
2.8 ± 0.5 |
Ethylene glycol |
1.43 |
22,640 |
1.9 ± 0.6 |
MPDiol glycol (1,3-diol, 2-methyl-propane) |
1.44 |
23,460 |
2.3 ± 0.2 |
P-0062 |
1.48 |
1,643 |
2.0 ± 0.5 |
P-0062 is a polyethylene glycol based prepolymer developed at University of California, Irvine.
uration of the clearing process was seen up to 6 hr if the fatty layer is not removed. This phenomenon can be connected with the low permeability of the epidermal and fat tissue cellular layers for any molecules, which slows down both fluxes— the water flux from the tissue and immersion agent flux from the outside into the tissue. Saturation of the optical transmittance can be expected when the equilibrium state in the immersion agent/water diffusion process will be achieved, i.e., when concentrations of water and immersion agent inside and outside tissue will be approximately equal. For skin with epidermis and fatty layer, such saturation was not reached even for 6 hr of glucose administration; but with removed fatty layer, saturation was achieved in 1 hr.
Using the algorithm described by Eqs. (5.1), (5.6), (5.14), and (5.17) and experimental data (see Fig. 5.23) discussed earlier, the diffusion coefficient of water in the skin at glycerol action can be estimated. Such estimation is valid for the agents with a strong osmotic strength because the water flux dominates in the system. The mean value of the diffusion coefficient averaged for the six rat skin samples at 20◦C for glycerol-water solution penetration, mostly from the dermal side of the skin, is equal to (5.12 ± 2.27) × 10−7 cm2 s−1, which is about two orders less than the dif-
= |
10−5 cm2 s−1 (see Ref. 1069), or one |
|||
fusion coefficient of water in water, DW |
||||
|
= |
3.0 |
× |
10−6 cm2 s−1 |
order less than water diffusion in an intact human lens, DW |
|
|||
(see Ref. 1020). For a subcutaneous fat free sample, a 40%-glucose action is characterized by a higher diffusion rate,949 D = (3.1 ± 0.1) × 10−6 cm2 s−1 that may
be due to more effective penetration of glucose into a tissue.
Using near-infrared spectroscopy (800–2200 nm), mass and water loss measurements, and transdermal skin resistance measurements, such enhancers of skin permeability as dimethyl sulfoxide (DMSO) and oleic acid, a monounsaturated
fatty acid, were compared at propylene glycol (PG) application onto the epidermal surface of samples of fresh porcine skin with a thickness of 1.52 ± 0.18 mm.1027 It
372 |
Controlling of the Optical Properties of Tissues |
was shown that when compared with DMSO as an enhancer, oleic acid has a similar synergetic optical clearing effect. Accounting for clinical safety reasons, oleic acid could be an optimal choice as an enhancer for optical clearing of skin because it is recognized as safe and free-of-side-effects agent, whereas DMSO has some potential toxicity. After application of oleic acid solution (0.1 M of oleic acid and PG-40), the total transmittance measured on the wavelength 1278 nm of the skin sample increased by 41 and 58%, respectively, for 30 and 60 min treatment, while diffuse reflectance decreased by 39 and 47%, respectively.
The difference in apparent absorbance (diffuse reflectance spectra were transformed into apparent absorbance, A = log(1/Rd ) between two wavelengths
of 1936 and 1100 nm was adopted to monitor the change in water content.932,971,972,1011,1026,1027 It is important that the oleic acid solution provided
the greatest water loss in comparison with the other tested solutions, 37 and 46% after 30 and 60 min treatment, respectively. As for DMSO-50, water loss was of 15 and 20%, PG-80 was 20 and 29%, and PG-80 + DMSO-50 was 34 and 44% after 30 and 60 min treatment, respectively. But the mass loss at oleic acid solution application was the minimal among the tested solutions; after 30 min PG-80 provided 10.9% of mass loss, PG-80 + DMSO-50 provided 6.4%, and oleic acid (0.1 M) + PG-40 provided 6.3%. More mass loss was obtained after 60 min of these agents’ application: PG-80, 14.2%; PG-80 + DMSO-50, 9.9%; and oleic acid (0.1 M) + PG-40, 8.3%. The comparison of water and mass loss data give a nice confirmation of the basic conception of the optical clearing that refractive index matching is achieved by two main diffusing processes: water flux from tissue (dehydration) and agent flux into tissue (replacement of interstitial water by the agent).
A method of accelerating penetration of the index-matching compounds by
enhancing skin permeability by creating a lattice of microzones (islets) of limited thermal damage in the SC was recently proposed.1056,1057 A combination of a
flashlamp system (EsteLux, Palomar Medical Technologies, Inc.) and a specially
designed appliqué with a pattern of absorbing centers (center size 75 μm, lattice pitch 450 μm) has been used to create a lattice of islets of damage (LID).1074
Several index-matching agents, including glucose and glycerol, have been tested. A high degree of optical clearance of full-thickness pig, rat, chicken, and human skin in vitro and in vivo has been demonstrated with 40%-glucose and 88%- glycerol solutions after creating a LID with a few optical pulses (fluence 14– 36 J/cm2, 20-ms pulse duration).
5.4.3 In vivo spectral reflectance measurements
In vivo topical application of glycerol, glucose, x-ray contrasts, propylene gly-
col, cosmetic lotions, and gels also made human skin more translucent, within a time period from a few minutes to a few hours.916,961,963,964,1044,1046 Water loss
or increase by means of moisturizing substances seriously influences the optical properties of skin.622,1045–1048,1071–1073 NIR reflectance spectroscopy is used as a
Tissue Optics: Light Scattering Methods and Instruments for Medical Diagnosis |
373 |
method to directly determine changes in free, bulk, and protein-bound water, and to assess scattering effects in skin for the evaluation of skin care products.1046 The
following spectral bands are associated with water: free water, 1879 nm; bulk water, 1890 nm; and protein-bound water, 1909 and 1927 nm. The effect of increases in ambient humidity is associated with increased levels of free water in the skin, while moisturizers containing hydroxyethyl cellulose, propylene glycol, dipropylene glycol, and glycerol contribute to a decrease in light scattering.1046 The water observed in such experiments is primarily in the SC, since only a small part of the reflected light comes from the epidermis or below.
Noninvasive measurement of the SC hydration can be performed using
attenuated total reflectance Fourier transform infrared (ATR FTIR) spectroscopy.622,1047,1071 Three absorption bands are relevant for determining water con-
tent in the SC: 3300 cm−1 (3030 nm), O-H and N-H vibrations; 1645 cm−1 (6079 nm), amide I band; and 1545 cm−1 (6472 nm), amide II band. The amide I band intensity is pronounced in the presence of water due to the strong absorption of water at 1645 cm−1 and the changes in carbonyl absorption under the influence of water, while the amide II band intensity is due to protein alone. The intensity ratio of the amide I to amide II bands, also called the moisture factor, is assumed to be a relative measure of C hydration.1047 Various SC moisturizers based on glycerol, propylene glycol, sodium lactate, natural moisturizing vegetal, liposomes, butylene glycol, polyglycerylmethacrylate, and urea were used for an in vivo SC hydration study.1047 Depending on the composition and concentration, maximal SC hydration could be reached in 0.5–2 hr after application of the substance on the skin surface. For some substances, a considerable moisturizing effect was detectable up to 8 hr following application. Dual-wavelength (1300 and 1450 nm) optical coherence reflectance measurement is a prospective technique for depth profiling of water absorption within the skin.1048
To enhance OCA permeation through SC, a number of specific procedures such as heating, electrophoresis, and sonophoresis are usually applied.1039,1044,1070 To
increase efficiency of the topical application of the OCAs, gelatin gels that contain clearing agents (verografin, glycerol, or glucose) were designed.1044 The diffusion rate of the agents within the gel layer can be rather high, and this along with the comparatively large volume of the gel provided the constant concentration of OCA, equal to agent content in the gel, at the skin surface. For intact skin of a volunteer, the best dynamics, i.e., the rate and the degree of clearing (17%), was observed in the case of verografin-gel [Fig. 5.24(a)] where after 40 min of observation, clearing still proceeds at a marked rate, while for glycerol-gel after 27 min, the curve flattens out; no clearing was observed in 40 min of glucose-gel application.
Because a barrier function of the skin is associated mainly with SC, the measurement was carried out on the skin after 30–50 μm epidermal glue stripping [Fig. 5.24(b)]. Application of glucose-gel to the skin without upper epidermis gave a rapid 10% drop of reflected light intensity. Glycerol-gel gave better results; over the time of observation, the decrease of reflected signal ranged up to 20%, which was twice what was attained for intact skin. Surprisingly, no clearing effect of verografin-gel was observed.

Tissue Optics: Light Scattering Methods and Instruments for Medical Diagnosis |
375 |
after 10–12 min because of the risk of deterioration of clearing by erythema development.
The administration of glucose or glycerol by intradermal injection into rat or
hamster skin causes a decrease of reflectance and the corresponding increase of tissue transmittance.571,969,978,980,1031,1038,1039,1058 This effect was observed at all wavelengths during a 15–18 min period after glucose injection.978,980 The highest
degree of tissue reflectance change is found at wavelengths from 580 to 750 nm, where scattering dominates. At the sixteenth minute, the reflectance of the skin was minimal (maximal transmittance); it decreased by about 3.5-fold at 700 nm, then the tissue went slowly back to its normal state. At the seventy-sixth minute, a reduction of reflectance of only twofold was observed. It was shown that a glycerol injection causes a more prolonged effect of tissue optical clearing, but reflectance decreased a little bit less than for glucose injection. This can be explained by the higher viscosity of glycerol and by its mostly indirect action through tissue dehydration. The reaction of the rat skin upon injection of distillate water, as a model of a nonosmotic agent, was also studied. The reduction of reflectance was observed only for a short period (the first minute) after injection. It happened due to a much higher transmittance of the injected water with respect to the surrounding tissues. At the second minute, water diffuses into the bulk tissue and the transparency of the tissue was decreased; the reflectance spectrum was elevated gradually to its initial value. Injection of water does not cause immersion clearing of the skin.
The virtual transparent window (VTW) with a diameter of 4 mm in the skin is created with the living time period of 30 min for 40%-glucose and more than
60 min for 75%-glycerol. Such a window allows one to clearly identify blood microvessels in the skin visually by the naked eye.978,980 The swelling white ring
(edema) appears around the VTW after agent injection. The images of skin after intradermal injection of glucose, glycerol, and water were recorded by a digital video camera. The diameters of swelling area (DS ) and VTW (DT ), and their ratio (DS /DT ) were measured (Fig. 5.25).978 For a glucose injection, the diameter of the VTW was registered at the first minute after injection. At the second minute, the diameter was slightly decreased. For the next 15 min, this diameter and the diameter of the swelling area were not changed. After the twentieth minute, significant reduction of the VTW was observed. For glycerol injection, the diameter of the VTW was approximately the same, but the swelling ring was bigger, and both transmittance and swelling were seen for longer times than at glucose injection [Fig. 5.25(b)]. The injection of distillate water causes only the appearance of swelling at the site of the injection. The diameter of the swelling area is decreased gradually and swelling disappears by the thirtieth minute after injection.
Figure 5.26 shows the reflectance spectra and the corresponding time-dependent reflectance for a few spectral components measured for a human healthy volunteer at intradermal 40%-glucose solution.965 The reflectance spectra show a scattering background determined by the diffusion reflection of the skin layers with the well-pronounced bands caused by blood optical absorption. Within one hour after glucose injection, the skin reflection coefficient decreases on average by a factor

376 |
Controlling of the Optical Properties of Tissues |
(a)
(b)
Figure 5.25 The changes of skin reaction on injection of (a) 40%-glucose and (b) 75%-glyc- erol: Q, the diameter of the virtual transparent window (VTW) (DT ); 2, the diameter of swelling area around the VTW (DS ); and +, the ratio DS /DT ; !, the diameter of swelling area at injection of distillate water.978,980
of 3.8 and then exhibits a slow increase, which indicates that glucose is eliminated from the observation area and the skin reflectance tends to restore itself to the initial level. Based on these results and the proposed skin clearing model, we may suggest that the main contribution to clearing in the first stage (first hour) is due to the refractive index matching between collagen fibrils of the dermis (n = 1.46) and the interstitial space (initially n = 1.36) to which glucose (n = 1.39) diffuses. Estimated from the experimental data [Fig. 5.26(b)], the diffusion coefficient of glucose in dermis is DG = (2.56 ± 0.13) × 10−6 cm2/s; this value is 3.6-fold less than for glucose diffusion in water at 37◦, DG ≈ 9.2 × 10⁻⁶ cm2/s, and reflects the character of dermis permeability for glucose.
For applications, it is important that skin preserves transparency (low reflectance) for a few hours after injection, which is defined by glucose diffusion along the skin surface, because the upper and lower layers of the skin—epidermis and fat—have much lower permeability than dermis. For the optical clearing effect to be still seen, glucose should diffuse at least at the distance l = 1.25–1.75 mm for the fiber probe used in experiments (Fig. 5.11), i.e., the diffusing (optical

Tissue Optics: Light Scattering Methods and Instruments for Medical Diagnosis |
377 |
(a)
(b)
Figure 5.26 (a) The reflectance spectra and (b) the time-dependent reflectance at three wavelengths (420, 500, and 700 nm) of human skin measured at hyperdermal injection of 0.1 ml of 40%-glucose into the internal side of the forearm of a male volunteer for different time intervals: (1) intact skin, (2) at 23 min, and (3) at 60 min after injection.965
clearing) time τ ≈ l2/DG ≈ 1.7–3.3 hr (corresponds well to experimental data) [Fig. 5.26(b)].
As is well seen from Fig. 5.26(a), at dermis clearing (reduction of scattering), the contrast of hemoglobin absorption bands is significantly higher than that for the control; but for prolonged immersion (curve 3), contrast is again not very high. This result is very important for contrasting of tissue abnormalities (tumors) associated with hemoglobin or other probe absorbers’ concentration (for instance, indocyanine green dye). Therefore, there is an optimal immersion time interval (for human skin at glucose injection, it is on the order of 60 min) that allows one to see skin absorbers and localize them more precisely at reduced scattering. Indeed, for prolonged immersion, contrast goes down due to fewer light interactions with absorption at low-step scattering.
378 |
Controlling of the Optical Properties of Tissues |
5.4.4 In vivo frequency-domain measurements
The dynamical response of optical properties of human skin treated by a chemical agent can be measured using a photon-density wave (frequency-domain) technique.961 The intensity and phase of photon-density waves generated by
the NIR optical source (786 nm) were measured at several source-detector separations.961,963 For the small (1–3 mm) source-detection separation measure-
ments that allow for thin tissue layer examination, a special multichannel fiberoptic probe was designed. It was used together with the Dicon multichannel fiberoptic switcher. Dynamical response of optical properties (modulation depth and phase shift of intensity modulation of the backscattered light) was measured for human skin via intervals of a chemical agent administration. The measurement for each separation was done during 10 s and averaged, corresponding to one point in Fig. 5.27. The relative amplitude (normalized to the initial amplitude) and phase changes (the current phase minus the initial phase) during 20 min of glycerol topical application are shown in Fig. 5.27. Only scattering changes must be considered due to the extremely low absorption of glycerol at the measuring wavelength. The observed amplitude and phase changes are small, reflecting minor permeation of epidermal cell layers to any chemical agent. Nevertheless, these measurements show enough sensitivity of the frequency-domain method to small changes of the scattering coefficient of the skin.
For large (2.5 cm) source-detector separation studies, the source and detector fiber tips were mounted in a rubber pad and fastened to the surface of the human forearm to avoid random moving artifacts. The cosmetic gel with refractive index n = 1.403 was placed on the surface of the arm and the phase and ac amplitude
(a) |
(b) |
Figure 5.27 Frequency-domain back-reflectance measurements for small source-detector separations.961,963 The time-dependent changes of the (a) amplitude and (b) phase shift of the signal for several source-detector separations (1.14, 2.08, and 3.5 mm) for in vivo study of a human arm under glycerol administration of 20 min.
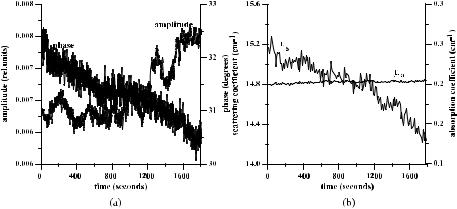
Tissue Optics: Light Scattering Methods and Instruments for Medical Diagnosis |
379 |
measurements were provided continuously. One sampling point corresponded to one second. The results of measurement during 30 min of gel administration are shown in Fig. 5.28(a). The observed temporal quasi-periodic fluctuations in the phase and amplitude of the optical signal are caused mainly by heartbeats.
Figure 5.28 Frequency-domain back-reflectance measurements for the large source-detec- tor separation (2.5 cm).961,963 (a) The raw experimental data of the phase and ac amplitude of the optical signal and (b) calculation of the absorption and the scattering coefficients. A cosmetic gel with refractive index n = 1.403 has been used.
Results of reconstruction of tissue optical parameters are shown in Fig. 5.28(b). The initial values of μs and μa for human skin were taken from Table 2.1, and relative changes of these parameters were calculated with a continual averaging procedure for every 5-s interval in order to exclude the influence of heartbeats. Corresponding temporal evolutions of the scattering and absorption coefficients have been received. This study shows that there are no noticeable changes in the absorption during the gel administration trial. A slight increase in the absorption can probably be explained by the increase of the water content in the skin due to the moisture effect of the applied gel. The selected source-detector separation (2.5 cm) and corresponding measuring volume are too large to make the matching effect a useful procedure for topical application of the gel. Only about 6% reduction of the scattering coefficient averaged over the large measuring volume was observed. This means that the scattering coefficient of the upper (superficial) layers of the skin changed more effectively. Refractive index matching of fiber tips and tissue surface is also important.
In vivo frequency-domain measurements for immersed tissues show that the refractive index matching technique provided by the appropriate chemical agent or cosmetic preparation application can be successfully used in tissue spectroscopy and imaging when reduction of scattering properties is needed.
380 Controlling of the Optical Properties of Tissues
5.4.5 OCT imaging
The typical optical coherence tomography (OCT) fiber-optic system employs a broadband light source (a superluminescence diode) delivering light at the central wavelength of 820 nm or 1300 nm with a bandwidth of 25–50 nm. Such an OCT
system provides 10–20 μm of axial and transverse resolution in free space with a signal-to-noise ratio up to 100 dB (see Section 4.6).127,136
The result of the OCT study is the measurement of optical backscattering or reflectance, R(z), from the tissue versus axial ranging distance, or depth, z. The reflectance depends on the optical properties of tissue, i.e., the absorption μa and scattering μs coefficients, or total attenuation coefficient μt = μa + μs. The relationship between R(z) and μt is, however, highly complicated because of the high and anisotropic scattering of tissue. But for optical depths of less than 4, reflected
power can be approximately |
proportional to |
− |
μ |
z in an exponential scale accord- |
|||
|
932 |
i.e., |
t |
|
|
||
ing to the single-scattering model, |
|
|
|
|
|
||
R(z) = I0α(z) exp(−2μtz), |
(5.27) |
||||||
where I0 is the optical power launched into the tissue sample and α(z) is the reflectivity of the sample at the depth z. The factor of 2 in the exponential accounts for the light passing through the sample twice after it is backscattered. Optical depth is a measure in terms of the number of mean free path lengths, i.e., μsz. α(z) is linked to the local refractive index and the backscattering property of the blood sample. If α(z) is kept constant, μt can be obtained theoretically from the reflectance measurements at two different depths, z1 and z2, as
μt = |
1 |
ln |
R(z1) |
, |
(5.28) |
2( z) |
R(z2) |
where z = |z1 − z2|. Because noise is inevitable in the measurement, a final result should thus be obtained by use of a least-squares fitting technique to improve the accuracy of the determined value of μt.
Optical clearing (enhancement of transmittance) T by an agent application can be estimated using the following expression:
|
= |
Rs |
× |
|
|
T |
|
Ra − Rs |
|
100%, |
(5.29) |
|
|
|
where Ra is the reflectance from the backward surface of the sample impregnated by an agent, and Rs is that from a control sample.
Multiple scattering is a detrimental factor that limits OCT imaging performances: imaging resolution, depth, and localization. To improve the imaging capabilities, the multiple scattering of tissue must be reduced. The immersion technique at application of biocompatible agents is expected to be a prospective technique for OCT because the depth of OCT images and their contrast can be essentially
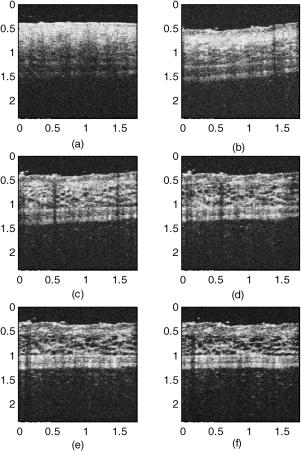
Tissue Optics: Light Scattering Methods and Instruments for Medical Diagnosis |
381 |
improved very easily at immersion.136,139,573,717,896,916,932,949,958,959,966,968,971,973, 1008,1012,1059
OCT imaging combined with OCA immersion is a useful technology for skin disease diagnosis and monitoring. To illustrate the dynamics of skin optical clearing after the application of glycerol, a set of OCT images (820 nm) of a rat skin sample was recorded at regular time intervals over a period of 40 min (Fig. 5.29).966 Both the index-matching effect, leading to the enhanced depth capability, and the localized dehydration effect, leading to the improvement of imaging contrast, are clearly evident. Analogous results were received for fresh porcine and chicken skin at imaging on 1300 nm by 50%- and 80%-glycerol solutions by Wang. The OCT image of human skin with psoriatic erythrodermia acquired sometime after application of glycerol [Fig. 5.30(b)] differs from the initial image [Fig. 5.30(a)] in
Figure 5.29 Dynamic OCT images (λ = 820 nm) at (a) 0, (b) 3, (c) 10, (d) 15, (e) 20, and
(f) 40 min after a topical application of 80%-glycerol solution onto rat skin. Images were prepared right after the rat was sacrificed; all the units presented are millimeters, and the vertical axis presents the imaging depth.966
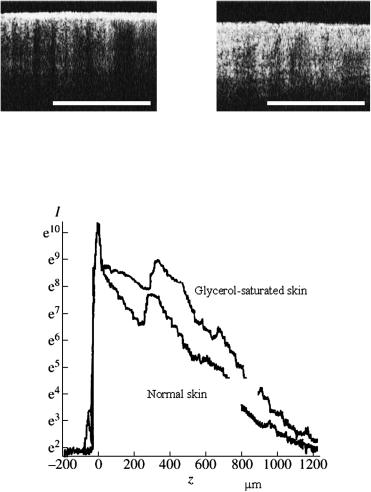
382 |
Controlling of the Optical Properties of Tissues |
(a) |
(b) |
Figure 5.30 OCT images of skin with psoriatic erythrodermia: (a) before topical application of glycerol; (b) 60 min after application of glycerol.717
Figure 5.31 The OCT signals (in intensity-depth coordinates) obtained for in vivo probing of human fingertip skin. The upper curve corresponds to skin saturated with glycerol. The scattering coefficient for the skin with glycerol is reduced: for the SC by a factor of two; for epidermis and upper dermis by 20%; and for deeper dermis layers only by 5%.916
greater penetration depth and better contrast. These image improvements facilitate identification of important morphological phenomenon of acanthosis.717
The possibility of in vivo diagnostics of malignant melanoma, observation of subepidermal blisters, and control of the scattering properties of skin through the saturation of skin with glycerol by its topical application was demonstrated on the basis of OCT imaging of human skin both in vitro and in vivo.916 According to the estimates done by the authors of Ref. 916, the scattering coefficient for the SC with glycerol is reduced by a factor of two (Fig. 5.31). For epidermis and upper dermis, the coefficient of scattering decreases by 20%. For deeper dermis layers, the coefficient of scattering lowers only by 5%. The effect on enhancement of both
Tissue Optics: Light Scattering Methods and Instruments for Medical Diagnosis |
383 |
the imaging depth and contrast was found in in vivo studies of human skin optical clearing at topical application of the 50% propylene glycol solution.967
The OCT images captured from the skin site of the volunteer at hyperdermal injection of 40%-glucose allowed one to estimate the total attenuation coefficient [see Eq. (5.28)].967 The attenuation initially goes down and then goes up within the time course. Such behavior well correlates with the spectral measurements shown in Fig. 5.26 and also reflects the index matching induced by the glucose injection. The light-beam attenuation in tissue, I /I0 exp(−μt), for intact skin (0 min) was
found from OCT measurements as I /I0 0.14, and for immersed skin at 13 min
=
I /I0 = 0.30, i.e., the intensity of transmitted light increased 2.1-fold. That value also correlates well with the spectral measurements.
It should be noted that high sensitivity of the OCT signal to immersion of living
tissue by glucose allows one to monitor its concentration in the skin at a physiological level.534,549,550
Although glycerol and glucose are effective OCAs when injected into the dermis,571,967,980 they normally do not penetrate so well into intact skin. In re-
cent OCT experiments with human skin in vivo at topical application during 90– 120 min of combined lipophilic polypropylene glycol-based polymers (PPG) and hydrophilic polyethylene glycol (PEG)-based polymers, both with refraction indices of 1.47 that closely match that of skin scattering components in SC, epidermis, and dermis, it was shown that a polymer mixture can penetrate intact skin and improve OCT images, allowing one to see dermal vasculature and hair follicles more clearly.973 This composition may have some advantages in skin optical clearing due to a hydrophilic component, which may be more effectively diffuse within living epidermis and dermis; less osmotic strength may also have some advantages, but the optical clearing depth could not be improved radically in comparison with topical application of other clearing agents, such as glycerol, glucose, x-ray contrast, and propylene glycol, because of the principle limitations of chemical agent diffusion through intact cell layers (see Table 5.2). Thus, to provide fast and effective optical clearing of skin, the appropriate well-known or newly developed methods of enhanced agent delivery should be applied. Some of them are discussed above.
5.4.6 OCA delivery, skin permeation, and reservoir function
The general principles of designing cosmetic preparations that allow one to provide deep permeation within skin for the improvement of its physiological properties are discussed elsewhere.1075 As it was shown earlier, the same cosmetic preparations with or even without any corrections may serve as optical immersion compositions. This is the best solution when the immersion composition improves both physiological and optical properties of the skin. However, the excellent diffusional resistance of the SC makes the transdermal delivery of an immersion agent difficult.1070
Lipids define a high permeability of creams and lotions in upper layers of epidermis and hair follicles.1075 Ethers of fat acids with single-atom spirits like
384 |
Controlling of the Optical Properties of Tissues |
isopropyl myristate, isopropyl palmitate, and isopropyl laurate are very important chemicals as components of deep-penetrating creams and lotions.
Technical lecithin [60% natural phospholipids (major phosphatidylcholine), 30–35% plant oil, glycerol, etc.] is a basis for many nourishing (nutritive) creams due to its possibility to penetrate deep into the skin.
Silicon wax and oils easily penetrate into hair follicles via friction (rubbing) and, due to low surface tension, do not induce inflammation, and do not influence the thermal balance of the skin.
Emulsions are oils in water and water in oils, with sizes of particles more than 0.1 μm. Emulsions like oils in water are widespread in cosmetics for deep penetration into the skin, as providers of biologically active substances, etc.
Nourishing (nutritive) creams easily penetrate to the deep layers of epidermis and prevent transepidermal water loss (TEWL). Skin hydration can be provided by two mechanisms—osmotic or physiological. As the hydrating substances, sodium lactate, pyrrolidonecarboxylic acid, derivatives of amino acids and sugars, proteins, and mucopolysaccharides are usually used. As a hygroscopic component, glycerol is often used (usually less than 10% in composition). At present, glycerol is usually replaced by a propylene glycol.
Currently in the market of cosmetic products, numerous creams and lotions providing enough deep impregnation of the skin are available. Many cosmetic emulsions, gels, and lotions for skin hydration use gyaluronic acid (the best for TEWL), sea collagen (also good for TEWL), liposomes, and nanospheres (fat particles) for transportation of biologically active substances to the deep layers of epidermis and hair follicles. As a rule, creams based on liposomes and nanospheres are used after application of peeling creams; for example, creams containing α-hydroxy acids (AHAs) or abrasive creams that make skin relief more smooth and penetrative for liposomes and nanospheres.
Liposomes have been suggested as a vehicle for dermal and transdermal drug delivery, but the knowledge about the interaction between lipid vesicles and human skin is still poor. In Ref. 1076, the visualization of liposome penetration into human skin in vitro using a confocal microscope was done. Liposomes were prepared from phospholipids in different compositions and labeled with a fluorescent lipid bilayer marker. Liposome compositions containing dioleylphosphatidylethanolamine (DOPE) were able to penetrate deeper into the SC than that from liposomes without DOPE; the liposomes containing DOPE may fuse or mix with skin lipids in vitro and loosen the SC lipid bilayers. Among the factors not affecting SC penetration were: negative charge, cholesterol inclusion, and acyl chain length of the phospholipids. Fusogenicity of the liposome composition appears to be a prerequisite for skin penetration. The liposome sizes determined by quasi-elastic light-scattering method were in the range 40–76 nm. The penetration depth into skin in 72 hr was in the 2–38 μm range. It should be noted that effective mixing of liposomes containing DOPE with SC lipid bilayers happens in a few minutes.1076
Occlusion enhances the percutaneous absorption of a variety of compounds.1070 The effect is relatively independent of the structure of the compound. For example,
Tissue Optics: Light Scattering Methods and Instruments for Medical Diagnosis |
385 |
hydration of the SC appears to enhance diffusion of water as well the percutaneous absorption of a homologous series of alcohols, phenols, and steroids. Occlusion leads to a threefold increase in the percutaneous absorption of several steroids applied from acetone vehicles. Occlusion reduces or blocks TEWL and the evaporation of volatile solvents or compounds from the skin surface. In turn, this results in a profound (300–400%) increase in the water content of the SC. Most transdermal preparations are partially or completely occlusive. Partial occlusion may also be obtained with formulations based on petrolatum, ointments, or creams, though lotions offer little occlusive activity. In addition, baths act to increase the water content of the SC and enhance percutaneous absorption. The effect of occlusion on the water content of the SC is relatively transitory, and typically returns to “normal” levels within 15 min after removal of an impermeable wrap. Since TEWL also returns to a normal level, it is likely that the reduction in barrier activity is also transitory.
Water uptake by the SC under occlusive conditions is primarily localized in the corneocytes. Hydration appears to have very little influence on the structure or properties of the intercellular lipids. Full hydration of the SC by occlusion appears to provoke the formation of water pools associated with rough structures. These structures can be considered as small water channels that reduce the diffusional path length and resistance for hydrophilic compounds. However, lipophilic as well as amphiphilic drugs may also profit from such shortened pathways.
A possible mechanism of occlusion action is that the swelling of the corneocytes directly alters the skin barrier function. Swelling of the corneocytes may provide an alternative penetration pathway, i.e., by facilitating entry into the corneocytes, increasing the diffusivity of compounds through the corneocytes, or altering
the structure of a minor lipid component.
In general, skin permeation enhancers act at the level of the SC.1070 The molecular basis of their activity can be attributed to: (1) an increase in the partitioning of compounds into the SC; (2) an increase in the diffusivity of the compound through the SC; and (3) a change in the penetration pathway.
The in vitro studies of passive transport of polar molecules, such as urea, mannitol, sucrose, and raffinose, across intact and two-hour ethanol pretreated human epidermal membrane (HEM) and theoretical analysis of the hindered diffusion showed that permeation pathways of HEM can be characterized by membrane porosity.1077 Effective pore radii estimates for intact HEM fell between 1.5 to 2.5 nm, while similar estimates fell compactly between 1.5 to 2.0 nm for ethanol-pretreated HEM. Thus, approximately a 100-fold increase in permeability for ethanol-pretreated HEM relative to intact HEM was explained by increased porosity of HEM at extraction of HEM lipids by ethanol pretreatment, while creating pores with effective radii that are quite small.
Up to three orders of permeation decrease was found for large molecules (8000 Da) in comparison with the small ones ( 200 Da).1078 The examination
of macromolecules’ (up to 18 kDa) permeation through ethanol-pretreated (2 hr) HEM yielded estimates of effective pore sizes for this biological membrane in
386 |
Controlling of the Optical Properties of Tissues |
the range 2.2–5.4 nm.1078 Approximately twice as large pore radii at studies with larger molecular size may reflect the existence of a distribution of pore sizes; probe permeants of larger molecular size would then yield a larger average pore size than those determined with smaller molecular permeants.
Such behavior was also observed in skin penetration studies where ethanol was topically applied.1079–1082 In these studies, ethanol reduced the barrier of
the SC due to its interaction with the intercellular lipids that resulted in enhanced SC permeation of topically applied substances, including aspirin. Effects
of ethanol/propylene glycol composition on macroscopic barrier properties of skin were also analyzed.1080
Recently, ethanol evaporation through skin was measured after oral intake of ethanol (0.30 to 0.52 g/kg of body weight) at skin sites differing in the thickness of the SC and the density of follicles and sweat glands.1083 The selective sealing of skin appendages had no significant influence on ethanol evaporation; this indicates that the evaporation of orally ingested ethanol occurs mostly through the SC lipid layers. Thus, an influence of ethanol on the penetration of topically applied products can be expected. However, in the study of Ref. 1083, orally administered ethanol had no effect on the penetration of a topically applied UV filter substance. Presumably, the available concentration of ethanol within the SC was too small (a theoretical maximum of 1.7 mg per 1 cm2 skin surface) to influence its perme-
ation significantly. Therefore, the effect of topically applied substances should not be influenced by a single ethanol dose of 31.2 g as used in the study.1083
Permeability of biological membranes may be induced not only by ethanol;
a number of various chemical agents may serve as enhancers of membrane permeation.1066,1070 For example, such a polyenic antibiotic as Amphotericin B
provides a twofold increase in water permeation through a cell membrane, more than 44-fold for glycerol, and more than 200-fold for urea.1066
Dimethylsulfoxide (DMSO), a polar aprotic solvent, is also a good enhancer. This is a natural substance derived from wood pulp that has a unique capability to penetrate living tissues; to associate with water, proteins, carbohydrates, nucleic acid, ionic substances, and other constituents of living systems; possesses hygroscopic and antiinflammatory properties; and is FDA approved as a preservative of transplanting organs and for interstitial cystitis treatment.1084
A concentration of approximately 60% is required for activity of DMSO to disrupt the human skin barrier function, and enhancement ratios of 20–200 have been reported.1070 DMSO provides irreversible disruption of the SC, perhaps due to solubilizing of the intercellular lipids and/or denaturing of proteins. Unfortunately, DMSO has some side effects such as skin irritation, chemical instability, the degree of damage to the SC, and the characteristic taste/odor of its oxidation products. Some other polar aprotic solvents also have been used experimentally as enhancers, but only one of them, decylmethylsulfoxide, has found its way into practice.1070
There are a great variety of surfactants that reduce the skin barrier function, classified as nonionic, anionic, and cationic based on the dependence of their
Tissue Optics: Light Scattering Methods and Instruments for Medical Diagnosis |
387 |
charge at physiological pH.1070 Certain unsaturated fatty acids increase percutaneous agent absorption by reducing the skin barrier function as well as by increasing the thermodynamic activity of compounds in some formulations.1070 Monoun-
saturated fatty acid oleic acid (C18) is frequently chosen as a good enhancer for a wide variety of polar and moderately lipophilic compounds.1027,1070 Oleic acid
increases TEWL in vivo by approximately 1.5–2 times, consistent with a general
decrease in the skin barrier function. There is a well-established synergy between the enhancer activity of oleic acid and propylene glycol vehicles.1027,1070
The stripping of the SC represents the simplest approach to physically
enhancing the percutaneous absorption of a compound across skin [see Fig. 5.24(b)].1044,1070 Although it is not always suitable for therapeutic applications
because of irritation responses, skin stripping is a very useful scientific tool for
evaluating the maximum amount of percutaneous agent absorption that can be expected from a topical application.1085,1086
The ultrasound or phonophoresis (sonophoresis) technique provides enhanced absorption of low-molecular-weight compounds as well as proteins such as insulin.1070 A continuous or pulsed exposure of ultrasound of frequency from 20 kHz to 10 MHz at an intensity of up to 3 W/cm2 can be applied during a period of up to 10 min. The intensity is limited by heat production in the tissue. The enhancement activity of high-frequency ultrasound (5–10 MHz) is connected with the induction of convective pathways through hair follicles and disruption of the intercellular lipid lamellae; the cavitation phenomenon when small air bubbles are formed within the SC plays an important role in its permeation.
A low-frequency ultrasound may be particularly suitable for enhancement.1070 In vivo application of ultrasound of 20 kHz to the skin of hairless rats for 1 hr resulted in a 100-fold increase in TEWL and sufficient delivery of insulin through the skin to reduce the blood glucose levels of rats.
Iontophoresis refers to the enhancement of agent percutaneous absorption
by the application of moderate (0.5 V/cm2) voltages across the skin [see Fig. 5.24(c)].1044,1070 Iontophoresis is not restricted to charged ions, and the flux of
uncharged molecules across the skin is also enhanced in a process termed electroosmosis. This results from the combination of a reduced SC barrier and an induced solvent convective flow. Iontophoresis appears to drive molecules through discrete sites located in the SC such as hair follicles and sweat glands. A quantitative comparison of the flux of ions through appendages and through the intercellular lipid domain is estimated to be between 50 and 95% during iontophoresis.1070 After a clinically relevant exposure of 0.16 mA/cm2 for 1 hr, the subsequent permeability of human skin in vitro was reduced tenfold. The effect exists during and after application of the current and is fully reversible after approximately 24 hr. Enhancement of percutaneous absorption by iontophoresis has been studied for a wide variety of agents.1070 At higher voltages (5–200 V/cm2) and short pulse exposure, electroporation of biological membranes may occur,1070 which also provides agent permeation into a tissue.
It was shown recently that laser-generated stress waves (photomechanical waves) can also permeabilize the SC.1088–1091 Permeabilization of the SC was first
388 |
Controlling of the Optical Properties of Tissues |
demonstrated with δ-aminolevulenic acid (ALA) as a probe. The permeability of the SC depends on the peak stress. The onset of the permeability of the SC is observed at 380 bar and increases with increasing peak stress. The efficiency of ALA transport through the SC is nonlinear. A small increase of the peak stress, from 440 to 500 bar (14% increase in peak pressure), caused the fluorescence intensity (protoporphyrin IX concentration induced by ALA application) to increase by 200%. The application of stress waves does not cause any pain and discomfort and does not appear to affect the structure and viability of the skin. The change of the permeability of the SC is transient and its barrier function recovers within a few minutes. The increased permeability allows macromolecules to diffuse through the SC to epidermis and dermis. The maximum size of particles that has been transported through the SC is 100 nm in diameter.1088 Thus, laser-generated stress waves can facilitate the transdermal delivery of large particles and molecules such as novel probes (carbon, gold, melanin nanoparticles, quantum dots, and encapsulated molecular probes), encapsulated drugs, or plasmid DNA. The combined action of laser-stress waves and anionic surfactant, such as sodium lauryl sulfate (2% of w/v), enhanced the delivery of nanoparticles through the SC.1088 The application of sodium lauryl sulfate increases the size of the channels in the biomembrane as well as delays the recovery of the SC barrier function. The synergism of light and surfactant action was manifested as a significant reduction of time interval for providing the similar SC permeation: only 5 min of the application of sodium lauryl sulfate was enough at laser single pulse action ( 7 J/cm2), providing a peak pressure of 600 bar and stress pulse duration of 250 ns instead of a few hours without laser pulse.
It was also shown that laser-generated stress waves increase the permeability of the cell plasma membrane. The increase of the skin structures’ permeability allows the introduction of macromolecules into the SC, the cytoplasm of living epidermal cells, and fibrous dermis. Thus, stress waves have the potential to deliver chemicals topically and noninvasively into the deep layers of the skin.
As a possible mechanism of the recently proposed method of enhancing skin
permeability by creating a lattice of microzones of limited thermal damage in the SC by applying of a few consequent optical pulses,1056,1057 the phase transition of
SC intercellular lipids from the gel phase to the liquid crystalline phase due to local heating can be considered.750,1092
Alternative techniques of clearing agent delivery based on injection of an agent
into the skin with a needle-free injection gun and laser skin surface ablation, and their combinations, are also under development.1058,1059 A diode laser source with
a 980 nm wavelength in conjunction with an artificial absorber on the skin surface was used to facilitate enhanced penetration of the topically applied skin clearing agent glycerol into in vivo hamster and rat skin.1059 Such a technique provides a sufficient skin surface heating, which leads to keratinocyte disruption and possibly skin surface ablation of less than 20 μm with a treatment site of 16 mm2 at laser beam scanning. Results indicate an improvement of the ability to deliver NIR light of 1290 nm up to 36% deeper into in vivo rodent skin using a laser fluence of
Tissue Optics: Light Scattering Methods and Instruments for Medical Diagnosis |
389 |
less than 96 J/cm2. Higher fluences caused unwanted thermal denaturation of skin tissue.
SC ablation can be provided directly by application of pulsed erbium lasers
with wavelengths of 2790–2940 nm, corresponding to the strong water absorption band.1093,1094 Laser ablation of 12.6% of the surface area of porcine SC produced
a 2.8- and 2.1-fold increase in permeability constant (Pa ) for 3H-hydrocortisone and 125I-γ-interferon, respectively.1093 These studies demonstrate that a pulsed (250-μs pulse width) laser with a wavelength of 2790 nm and 1 J/cm2 of fluence density can reliably and precisely remove the SC at 10–14 laser pulses, facilitating penetration of large molecules such as 125I-γ-interferon, which cannot penetrate intact skin.
Among such modalities as skin microdermabrasion, iontophoreses, electroporation, and Erb:YAG (λ = 2940 nm) ablation, tested by the authors of Ref. 1094, laser ablation showed the greatest enhancement of ALA permeation through pig skin samples. Laser fluence was found to play an important role in controlling the drug flux, producing enhancement ratios from fourfold to 246-fold relative to the control. The skin permeation of ALA across microdermabrasion-treated skin was approximately fivefold to 15-fold higher than that across intact skin. The application of iontophoresis or electroporation alone also increased the ALA permeation by approximately 15-fold and twofold, respectively. The incorporation of iontophoresis or electroporation with the resurfacing techniques (laser ablation or microdermabrasion) caused a profound synergistic effect on ALA permeation.
The SC is functioning not only as a barrier against clearing agent penetration into skin, but also as a reservoir for topically applied substances.1095,1096 Skin
appendages, in particular sebaceous glands, also serve as reservoirs for clearing
agents.988–990,1085,1097
For the development of technologies for topical application of clearing agents,
the knowledge of the reservoir function is of fundamental interest. The long-term reservoir functioning of the SC in human skin was investigated in vivo.1095,1096
Using laser confocal scanning microscopy and the tape stripping method, the long-term reservoir of the SC was determined both qualitatively and quantitatively, depending on the polarity of the applied formulation. Formulations with different physicochemical properties were studied. A follicular long-term reservoir was only observed for hydrophilic sodium fluorescein after application in
propylene glycol. A follicular penetration of dyes was also reported for the application in emulsions,1085 solvents such as ethanol and glycerol,988–990 and 5-μm
microspheres containing dye and suspended in silicon oil at w/w concentration of 4%.1097 The penetration depth and reservoir properties of human skin in vivo for
methylene blue (MB) and indocyanine green (ICG) dissolved in ethanol/glycerol solvents were recently reported.988–990 These studies were applied for the improve-
ment of sebaceous glands functioning at photodynamic acne treatment; the most intensive sebaceous gland staining was just after the 15–20 min massage and heating procedure. It was also shown that highly porous nylon microspheres suspended
in silicon oil provide a penetration depth of MB into hairless rat skin in vivo up to 150 μm in 2 hr and 400 μm in 26 hr.1097
390 |
Controlling of the Optical Properties of Tissues |
The results of the study described in Refs. 988–990 and 1095–1097 led to the assumption that the better the penetration into the SC and the follicles, the longer the reservoir will remain there. Two pathways of release of the dyes from the reservoir are possible: (1) the desquamation of the SC and, the release of sebum, respectively, or (2) the penetration into the viable tissue.
In conclusion it should be noted that for topically applied UV skin filters their efficiency may be significantly reduced, if not, appropriate cosmetic composition will be used as a ground material for such a filter. Two main effects can be important: (1) reduction of light scattering in SC due to optical immersion and (2) inhomogeneous distribution of the topically applied substances.1087 Both effects lead to reduction of UV filters’ efficiency: the first because of a fewer number of interactions of migrating photons in skin with sunscreen material at less scattering, and the second because of the formation of islands free of sunscreen that are not blocking UV radiations. The second problem is analyzed in detail in Ref. 1087.
5.5 Optical clearing of gastric tissue
5.5.1 Spectral measurements
Transmittance and diffuse reflectance measurements were performed over a range
from 800 to 2200 nm for frozen-thawed and fresh native porcine stomach cardiac and pyloric mucosa sections of 1.2–1.6 mm in thickness.932,971,972,1011,1026,1027
Mucosa consists of moist epithelium and the connective tissue immediately beneath it. Mucosal structure is somewhat identical to skin, with cell epidermal and fibrous dermal layers. The absence of the dead cell layer, such as SC of skin, makes normal mucosa more permeable for chemical agents. Immersion solutions (glycerol/DMSO/water) of different concentrations were topically applied onto the epithelium surface of the sample and then spectra were acquired at time intervals of 5, 10, 20, and 30 min. The difference in apparent absorbance (extracted from the diffuse reflectance) between two wavelengths, 1936 and 1100 nm, was used to estimate water content. Some results are presented in Fig. 5.32. It can be seen from Figs. 5.32(a) and 5.32(b) that over the whole wavelength range investigated, the transmittance was increased with time and diffuse reflectance was decreased over the range of 800–1370 nm. The greatest increase in transmittance was at 1278 nm, and the greatest decrease in reflectance was at 1066 nm.
A strong correlation has been found between optical clearing and water desorption.971,972,1011,1026,1027 At 30 min after the treatment, 80%-glycerol caused
15% water loss, whereas 50% glycerol and 50% DMSO caused 9% and 7% water loss, respectively. The patterns of optical clearing are similar to those of water desorption. The water loss was maximal ( 19%) and optical transmittance at 1278 nm was also maximal ( 30%) for the mixture of 50% glycerol and 30% DMSO (synergetic effect).
Reduction of scattering and water absorption allows one to get more pronounced signatures of absorbing bands of tissue components. In particular, this is
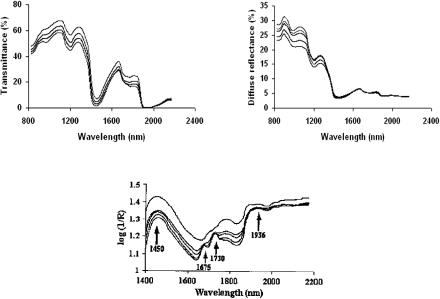
Tissue Optics: Light Scattering Methods and Instruments for Medical Diagnosis |
391 |
(a) |
(b) |
(c)
Figure 5.32 Optical changes for porcine stomach fresh pyloric mucosa before and after application of an immersion solution, measured by spectrophotometer with an integrating sphere at the time intervals of 0, 5, 10, 20, and 30 min [(a) from bottom to top, (b) and (c) from top to bottom], respectively. (a) Total transmittance, and (b) diffuse reflectance over the range of 800–2200 nm after topical application of 80%-glycerol onto the epithelium surface of a sample of thickness 1.6 ± 0.2 mm.932,971 (c) Apparent absorbance spectra calculated from diffuse reflectance measurements over the range of 1400–2200 nm after application of 50%-DMSO, a sample of thickness 1.15 ± 0.12 mm.972
demonstrated by the apparent absorbance spectra (1400–2200 nm) in Fig. 5.32(c) measured at 50% DMSO solution application. The major features of these spectra are the bands near 1450 and 1936 nm, corresponding to the first overtone of OH stretch in water and the combination mode of OH stretch and HOH bend in water, respectively. DMSO application significantly changes the absorbance spectrum of the tissue. The peaks of 1730 and 1675 nm appeared at 5 min after DMSO administration, i.e., with the water loss (scattering and water absorption reduction) and possibly corresponding to resolvable CH groups in lipids and proteins.
5.5.2 OCT imaging
In vitro studies of optical clearing of gastrointestinal tissues, such as stomach,
esophagus, and colonic mucosa, were also performed using the OCT imaging technique.967,968,971,1012 Figure 5.33 shows two OCT images of intact and normal
fresh human stomach tissue (fundus) treated by 80% propylene glycol solution.
A more cleared image with excellent differentiation of epithelium, isthmus, lamina propia, and muscular tissue is achieved at the agent action.967,968
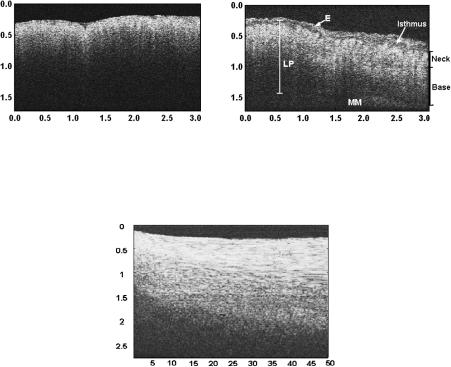
392 |
Controlling of the Optical Properties of Tissues |
(a) |
(b) |
Figure 5.33 OCT images of normal fresh human stomach tissue (fundus): (a) without and
(b) with topical application of 80%-propylene glycol solution. E, epithelium; LP, lamina propia; MM, muscularis mucusae.967
Figure 5.34 The time course of repeated OCT A-scans of porcine stomach tissue with the application of glycerol. The horizontal and vertical axes represent the time (min) and the imaging depth (mm), respectively; the registration of the OCT signal starts at time 0.5 min after the agent application.1012
Figure 5.34 illustrates the M-mode OCT images obtained from repeated A-scans of porcine stomach with the application of glycerol.1012 From the image, it is clearly seen that the penetration depth increases gradually with the increase of time duration. There is a slope of the surface of the tissue. The downward trend of the tissue surface is attributed to tissue dehydration induced by the chemical agent.
It should be pointed out that the experiments mentioned above were performed on in vitro biological tissues. The dynamic optical clearing effect induced by the chemical agent would differ from that of the in vivo case. Because of cell selfregulation and blood circulation, the living tissues would have less dehydration after the application of a hyperosmotic chemical agent.
5.6 Other prospective optical techniques
5.6.1 Polarization measurements
Dynamics of the polarization structure of a tissue image at immersion can be easily observed using an optical scheme with a “white” light source and a tissue
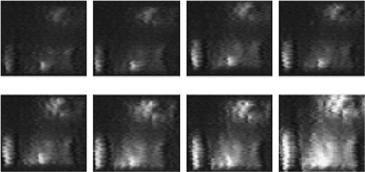
Tissue Optics: Light Scattering Methods and Instruments for Medical Diagnosis |
393 |
sample placed between two in-parallel or crossed polarizers. Figure 5.35 illustrates the evolution of polarization images during scleral optical clearing.442,1065
In such experiments, a tissue layer “works” as a phase plate (or number of phase plates441,1034) in which linear birefringence is spatially and temporally dependent.
As scattering decreases with time due to refractive index matching, the birefringence of the fibrillar structure of the sclera affects the transmittance of the optical system. The spatial inhomogeneities of images may be due to spatial variations of the sample thickness and structure, both of which may influence the efficiency of the OCA impregnation and corresponding phase shift between the orthogonal optical field components (see Section 1.4).410
Figure 5.35 Polarization images of a sclera sample (white light source, crossed polarizers). Images from left to the right correspond to 4, 5, 6, 7, 8, 9, 9.5, and 10 min of tissue impregnation by trazograph-60. The supporting wires of the sample are seen for the translucent tissue.442,1065
At reduced scattering, the degree of linearly polarized light propagating in sclera improves. This is clearly seen from the experimental graphs in Figs. 5.10 and 5.36.1033 As far as immersed tissue, the number of scattering events decreases and the residual polarization degree of transmitted linearly polarized light increases. As a result, the dynamics of tissue average transmittance and polarization
degree are similar (see Fig. 5.10). It follows from Figs. 5.10 and 5.36 that tissue optical clearing leads to increasing depolarization length.36,135,138,383,438,1098 Due to
less scattering of the longer wavelengths, the initial polarization degree is the highest for these wavelengths. The polarization imaging is a useful tool for detection of
subsurface lesions, but it is effective only at depths smaller than the depolarization length.36,382,383 Optical clearing may give a possibility to substantially increase the
depth of polarization imaging.
The image contrast C(t) = B(t)/Bmax, where B(t) is the current sample brightness and Bmax is the maximal one, characterizing transmittance of linear polarized light through a tissue sample, was used for a quantitative evaluation of the diffusion process of an agent in a tissue. A white-light video-digital polarization microscope is suitable for the measurements.409 Sections of the various connective and vascular tissues of a thickness of 0.1–1.5 mm were studied. The immersion solution was
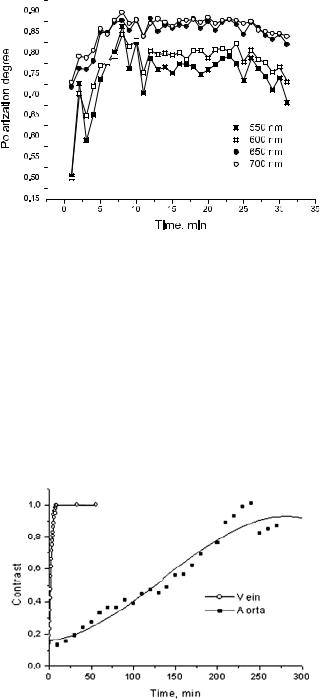
394 |
|
|
|
Controlling of the Optical Properties of Tissues |
||||||
|
|
|
|
|
|
|
|
|
|
|
|
|
|
|
|
|
|
|
|
|
|
|
|
|
|
|
|
|
|
|
|
|
|
|
|
|
|
|
|
|
|
|
|
|
|
|
|
|
|
|
|
|
|
|
|
|
|
|
|
|
|
|
|
|
|
|
|
|
|
|
|
|
|
|
|
|
|
|
|
|
|
|
|
|
|
|
|
|
|
|
|
|
|
|
|
|
|
|
|
|
|
|
|
|
|
|
|
|
|
|
|
|
|
|
|
|
|
|
|
|
|
|
|
|
|
|
|
|
|
|
|
|
|
|
|
|
|
|
|
|
|
|
|
|
|
|
|
|
|
|
|
|
|
|
|
|
|
|
|
|
|
|
|
|
|
|
|
|
|
|
|
|
|
|
|
|
|
|
|
|
|
|
|
|
|
|
Figure 5.36 The time-dependent polarization degree, (I − I )/(I − I ), of collimated transmittance measured in vitro at different wavelengths for rabbit eye sclera at administration of 40%-glucose.1033
heated to 36–40◦C and simply dropped on the tissue sample surface. Figure 5.37 shows different rates of tissue optical clearing for vein and aorta samples caused by the different interaction of these tissues with the immersion agent—the denser aorta is less penetrative for the agent than vein; therefore, its action on aorta can be seen only in a few hours, whereas for the vein sample about 10 min is enough to complete clearing. However, both tissues finally turn from an initially turbid (multiple scattering mode) at t = 0 to a less depolarized and more transparent state (less scattering mode), C(t) → 1.
Figure 5.37 Experimental temporal dependencies for image contrast of linear polarized light transmitted through vascular tissue sections (aorta and vein-vena cava inferior ) measured by a white-light video-digital polarization microscope at the application of trazograph-60.409
Tissue Optics: Light Scattering Methods and Instruments for Medical Diagnosis |
395 |
Reduced scattering at optical immersion makes it possible to detect the polarization anisotropy of tissues more easily and to separate the effects of light scattering and intrinsic birefringence on the tissue polarization properties. It is also possible to study birefringence of form with optical immersion; but when the immersion is strong, the average refractive index of the tissue structure is close to the index of the ground media, and the birefringence of form may be too small to see because both phenomena are based on the refractive index mismatch—scattering due to irregular refractive index variations, and birefringence due to regular ones [see Eqs. (1.53) and (1.54)].
At reduced scattering, tissue birefringence can be measured more precisely; in particular, birefringence of form and material can be separated. For example, for the translucent human scleral sample by its impregnation with a highly concentrated glucose solution (about 70%), the measured optical anisotropy410n = (ne − no) was ≈10−3. This is 1.5-fold to 4.5-fold less than for other birefringent tissues described in Section 1.4, and is mostly explained by a reduction of inclusion of birefringence of form at optical immersion. The additional measurements of the collimated transmittance allows one to estimate the refractive index of the ground substance of the translucent tissue n2 using the expressions from radiative transfer and Mie theories [see Eqs. (5.1) and (5.16)]. For a human scleral sample impregnated by 70% glucose solution, n2 was evaluated as 1.39. Using this value and the value of the refractive index of hydrated collagen, n1 = 1.47, and n = 10−3, the collagen volume fraction f1 was calculated from Eq. (1.53) as
f1 = 0.32, which correlates well with an estimation made in Section 3.1.
Figure 5.10 illustrates the reversibility of the polarization immersion effect.
A polarization-speckle microscope working in transmittance mode was used to carry out these measurements.343,1030 The sample was irradiated by a linear polar-
ized focused laser beam that was scanned along the trace of 1.5 mm on the sample surface to average the speckle modulation in the far zone, where the analyzer and photodetector were placed. Two orthogonal linear polarized components of the transmitted light were detected. It can be seen that the sample initially had poor transmittance with the equal intensity components I = I and that multiple scattering takes place. When the immersion agent acts in the fourteenth minute,I prevails substantially over I , and the tissue becomes less scattering. The subsequent action of the physiological solution, which washes out the immersion agent, returns the tissue to its normal state, and it becomes turbid again in the twenty-second minute with no measured difference between the intensities of the orthogonally polarized components. The secondary application of the immersion agent again makes the tissue less scattering and more polarization sensitive with a maximum reached at the twenty-eighth minute.
Figure 5.38 shows the reversible loss of turbidity and birefringence in rodent tail tendon observed at glycerol (13 M) application.946 The dark background in each of the images demonstrates the extinction of illuminating light at the crossed polarizers in the polarized light microscope used in the measurements. Characteristic banding patterns observed in the tendon sample indicate ordered fibril organization. The distribution of pattern brightness corresponds to the distribution of
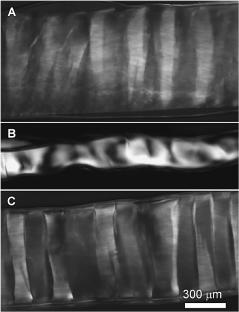
396 |
Controlling of the Optical Properties of Tissues |
Figure 5.38 Reversible loss of turbidity and birefringence in rodent tail tendon following glycerol (13 M) application observed by polarized light microscopy at crossed polarizers.
(A) Before glycerol application: banding patterns observed in the tendon indicate ordered fibril organization. (B) At glycerol application: loss of transmittance at the sample edges and bright spots in the middle indicate refractive index matching of collagen fibers; the complete refractive index matching at the edge region causes the tissue to lose scattering and birefringence, whereas in the middle sample region the refractive index is not completed and mostly scattering is reduced (loss of turbidity). (C) The tissue sample after rehydration in saline (figure was kindly presented by Alvin T. Yeh and Bernard Choi).
a phase shift between orthogonal optical field components [see Eq. (1.52)], and the smooth background brightness corresponds to light scattering. Loss of transmittance at the sample edges and the appearance of bright spots in the middle of the sample in the course of glycerol action indicate refractive index matching of collagen fibers (not seen in the image due to their small diameter). The complete refractive index matching at the edge region happens earlier than in the middle of the sample, and causes tissue to lose scattering and birefringence completely in this region. In the middle region of the sample, refractive index matching is not completed and scattering is mostly reduced (loss of turbidity); thus, bright and dark areas that correspond to a certain phase shift are well seen. Tissue shrinkage at the glycerol action due to tissue dehydration, and hypothesized by the authors of Ref. 946, the reversible dissociation of collagen fibers may have influence on the pattern formation. The rehydration of the tissue sample in saline makes its banding structure fully visible in the crossed polarizers due to resumption of the tissue birefringence and turbidity approximately to the initial states.
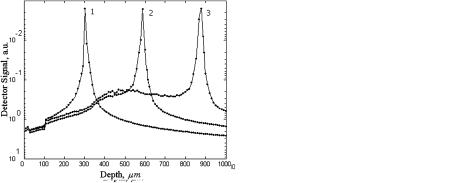
Tissue Optics: Light Scattering Methods and Instruments for Medical Diagnosis |
397 |
Practically all healthy connective and vascular tissues show the strong or weak optical anisotropy typical of either uniaxial or biaxial crystals.409,410,441,1034 Pathological tissues show isotropic optical properties.29,382,383
5.6.2 Confocal microscopy
Increasing of the upper tissue layers’ transparency can improve the penetration depth, image contrast, and spatial resolution in confocal microscopy as well.896,897
By Monte Carlo simulations of the point-spread function, it was shown that the signal spatial localization offered by a confocal probe in the skin tissues during their clearing is potentially useable for reticular dermis monitoring (Fig. 4.20).759 The results of the simulation predict that after 20 min of the chemical agent diffusion after intradermal glycerol or glucose injection, a signal from the tissues located twice as deep in skin can be detected.
(a) |
(b) |
Figure 5.39 The axial profile of a detector signal distribution (a) before and (b) 20 min after glycerol administration (intradermal injection) predicted by numerical Monte Carlo simulation for a confocal microscope focusing at (1) 300 μm, (2) 600 μm, and (3) 900 μm into the skin. Confocal probe parameters are: lens diameter 5 mm and focal length 10 mm; pinhole diameter is 10 μm; the height of the lens above the surface is 9.7 mm (see Fig. 4.19).897
A significant improvement of the confocal microscopy signal at glycerol administration is well seen from theoretical axial profiles of a detected signal calculated for three different in-depth focusings (Fig. 5.39).897
5.6.3 Fluorescence detection
Recently, the improvement of the detected fluorescence signal traveling through skin in in vitro and in vivo experiments at topical application of hyperosmotic OCAs, such as anhydrous glycerol (13 M, index n = 1.47) and pure DMSO (14 M, index n = 1.47), and a highly concentrated glucose (7 M, index n = 1.46), was demonstrated.777 Fluorescence measurements were performed for hamster dorsal
398 |
Controlling of the Optical Properties of Tissues |
skin with OCA applied to the subdermal side of the skin and rhodamine fluorescent film placed against the same skin side. Fluorescence was induced by a dye laser pulse at 542 nm delivered to the skin epidermal side by a fiber bundle and was detected by a collection fiber bundle from the epidermal surface at wavelengths longer than 565 nm. A skin flap window preparation in an area void of blood vessels was used for in vivo studies. Approximately equal enhancement of transmitted fluorescence was achieved for in vitro and in vivo measurements (Fig. 5.40). On average, up to 100% increase in fluorescence intensity is seen for 20-min glucose and glycerol applications, and up to 250% for DMSO. The significantly larger increase in the case of DMSO is associated with its twice greater osmolarity than for the glycerol and glucose concentrations used.
Figure 5.40 Comparison of the percent increase in fluorescent signal due to 100%-glycerol, 100%-DMSO, and 7M glucose in vivo.777
A significant enhancement of both the sensitivity ( fivefold) and the spatial resolution ( threefold) for low-level light-emitting probes (a broadband violetblue chemiluminescence with a center wavelength of 425 nm) was demonstrated in in vitro experiments with a 3-mm-thick fresh porcine skin sample at topical application of 50%-glycerol during 30 min.977 A higher efficiency of luminescent light transportation through the skin at immersion in that case is connected with a higher initial scattering and absorption of skin at the shorter wavelengths. Refractive index matching effectively damps light scattering, and thus absorption of light also occurs due to the lower number of photons circulating within a tissue.
In a recent theoretical study,976 it was shown that by refractive index matching at the skin interface and with a fiber-optical fluorescence probe, one can improve the contrast and spatial resolution of the shallow sampling volume.
Both model experiments described above well demonstrated changes of tissue layer transmittance at optical immersion for light from a fluorescent source placed behind a tissue layer. However, fluorophores are more often distributed within a tissue layer or even a multilayered tissue structure and may contain a number of different fluorophores. In that case, the behavior of a fluorescence signal at tissue immersion is not so evident because the cross section for fluorescence emission
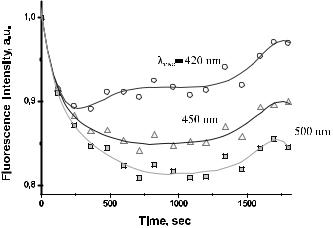
Tissue Optics: Light Scattering Methods and Instruments for Medical Diagnosis |
399 |
depends on the amount of the absorbed light by fluorescent centers. Such a cross section decreases as multiple scattering decreases. Thus, at tissue optical clearing, instead of an enhanced fluorescence signal, one can see its damping. Evidently, that depends on the depth, where the fluorophore is, and what layer of a tissue is optically cleared.
Figure 5.41 In vivo dynamics of human skin autofluorescence intensity (λexc = 337 nm) after intradermal injection of 0.1 ml of trazograph-76. Intensity values at different emission wavelengths are normalized by correspondent initial values.975
Figure 5.41 illustrates that fluorescence can be damped at tissue scattering reduction due to refractive index matching.975 These data were received in vivo for human skin at intradermal injection of the immersion liquid, trazograth-76. Such behavior of the autofluorescence signal means that the main fluorophore (collagen) is in the dermis, where the immersion agent was inserted. However, with time, due to more in-depth penetration of the exciting light and less attenuation of the induced fluorescence by the upper layers of skin, fluorescence intensity is going up. Tissue optical clearing can be a helpful technology in looking for endogenous or exogenous fluorophore distribution within a tissue, and their differentiation.
5.6.4 Two-photon scanning fluorescence microscopy
One of the new directions in tissue spectroscopy is associated with multiphoton fluorescence scanning microscopy (see Section 1.7.2).114,122,131,137,609–618,1099–1102
However, it has been shown that the effect of light scattering in multiphoton fluorescence scanning microscopy is to drastically reduce the penetration depth to less
than that of the equivalent single-photon fluorescence while largely leaving the resolution unchanged.618,1099 This happens mostly due to excitation beam defocusing
(distortion) in the scattering media. Although some improvement in the penetration depth of two-photon microscopy can be obtained by optimizing the pulse shape
400 |
Controlling of the Optical Properties of Tissues |
and repetition rate for the sample under investigation,1100 reduction of scattering is believed to be more effective with penetration-depth and image-contrast improve-
ment.1063 Two-photon fluorescence microscopy provides high-resolution images of human skin in vivo.1101,1102 Evidently, the technique is applicable for many
other tissues, but its penetration depth is normally limited to 20–30 μm.
The first demonstration of two-photon in-depth signal improvement using the optical immersion technique with hyperosmotic agents, such as glycerol, propylene glycol, and glucose, was done by the authors of Ref. 1063 in ex vivo experiments with human dermis. Thick (150 μm) slices of dermis excised during plastic surgery were imaged within the same day. Images were collected in stacks, each comprising four images of a 100 μm2 area taken at depths of 20, 40, 60, and 80 μm from the surface of the sample. Before data acquisition, the sample was immersed in 0.1 ml of phosphate buffered saline (PBS) in order to prevent drying and shrinkage. The sample was then immersed in 0.5 ml of an OCA and one image stack was acquired every 30 s for 6–7 min. The OCA was finally removed and the sample was immersed again in 0.1 ml of PBS in order to observe the reversibility of the clearing process. Glycerol and propylene glycol were both used in anhydrous form, and glucose as a concentrated aqueous solution (5M). The upper limit of tissue shrinkage was estimated as 2% in the course of 6–7 min of OCA application.
The average contrast in each image and relative contrast (RC) were defined
as1063
contrast |
Nlines |
I , |
RC(%) |
|
100 contrast[OCA] − contrast[PBS] , |
||||
|
|
I |
|
||||||
|
$ |
|
|
|
|
|
|
||
|
= |
= |
| ij − ij | |
|
= |
|
contrast PBS |
|
|
|
i,j |
1 |
|
|
|
[ ] |
|
||
|
|
|
|
|
|
||||
where Iij is the mean intensity of the nearest eight pixels and Nlines = N − 2, with N = 500; contrast [OCA] and contrast [PBS] are calculated for OCA and PBS immersion, respectively. Contrast, as defined here, is linearly dependent on the fluorescence intensity and varies according to structures in the image. Hence, its usefulness is primarily to enable comparison between images of the same sample at the same depth, maintaining the same field of view. Normalization to the total intensity would be required in order to compare different images. The relative contrast RC also serves for the purpose of comparison.
Figure 5.42(a) shows two typical images stacks: the first received for a sample immersed in PBS and the second received 7 min after application of glycerol. The images show connective tissue in human dermis, which is primarily composed of collagen and elastin fibers. The enhancement of contrast as well as the increase of penetration depth (from 40 to 80 μm) and total intensity [i.e., the intensity summed over all pixels, Fig. 5.42(b)] are clearly seen from the images. The corresponding absolute and relative contrast levels are plotted in Figs. 5.42(a) and 5.42(d). RC has a value of 215% at 40 μm and dramatically increases with increasing depth.
The effect on deeper layers is greater because of the cumulative effect of the reduction in scattering in the superficial layers of the tissue sample, which provides less attenuation of the incident and detected fluorescent light. The contrast
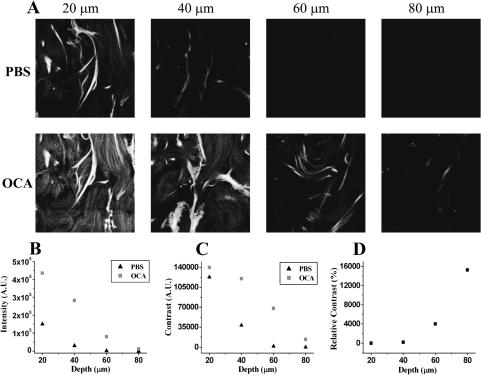
Tissue Optics: Light Scattering Methods and Instruments for Medical Diagnosis |
401 |
is also dependent on fluorescence intensity, which is proportional to the squared intensity of the excitation intensity and mostly dependent on the excitation beam focusing ability. The better focus (less focused beam distortion) is achieved in a less scattering media.
Figure 5.42 Two-photon microscopy of human skin ex vivo by use of glycerol as the optical clearing agent.1063 (a) Image stacks for a skin dermis sample immersed in PBS (upper) and after immersion for 7 min in glycerol (lower). The corresponding total intensity, contrast, and relative contrast are plotted in (b), (c), and (d), respectively.
It was shown experimentally that application of each OCA among glycerol, propylene glycol, and glucose resulted in contrast enhancement with varying degrees of efficiency and saturation. The dynamics and the final contrast level attained depend on the OCA and on the tissue depth. Saturation of contrast occurs most rapidly in superficial layers of the sample. This is consistent with a diffusion model for the penetration of the agent from the surface into the tissue [see Eqs. (5.2), (5.6), and (5.7)], i.e., if the contrast is proportional to agent concentration, then the saturation time at a given depth will be proportional to the depth. As it follows from data of Ref. 1063, glycerol is the most efficient with respect to saturation level (RC = 49.7% at 20 μm depth, 304% at 40 μm depth, 1900% at 60 μm depth, and 9260% at 80 μm depth), but also the slowest. Propylene glycol provides RC 64% at 20 μm depth, 1090% at 40 μm depth, 5640% at
402 |
Controlling of the Optical Properties of Tissues |
60 μm depth, and 447% at 80 μm depth. Whereas, glucose (5M) is the worst with RC = 10.9% at 20 μm depth, 134% at 40 μm depth, 471% at 60 μm depth, and 406% at 80 μm depth, but diffuses three times faster than glycerol and five times faster than propylene glycol. Diluted agents gave similar tendencies in contrast enhancement and increase of penetration depth, providing higher efficiency in both characteristics with OCA concentration increase.
These data illustrate that, as well as in linear spectroscopy, the refractive index matching is the leading mechanism in reduction of tissue scattering and two-photon signal improvement. In contrast to in vivo single-photon fluorescence spectroscopy (see Fig. 5.41), where fluorescence intensity may decrease at multiple scattering decrease, a two-photon tomography signal is always increased due to less distortion of the focused beam and less attenuation of a two-photon fluorescence signal by superficial optically cleared tissue layers. However, there was found some specificity in action of the three different OCAs. Results presented in Ref. 1063 show for propylene glycol and glucose a slowing in the rate of contrast increase following addition of PBS rather than a decrease as it is seen for glycerol. Such behavior may be associated with a lesser inclusion of the dehydration mechanism in optical clearing for propylene glycol and glucose, and a greater amount of these agents diffused into a tissue in comparison with glycerol.
5.6.5 Second-harmonic generation
Optical clearing seems to be a promising technique for improvement of detected
signals in multiphoton microscopy and nonlinear spectroscopy, and imaging of tissues.946,947 On the other hand, these techniques might be useful in the under-
standing of molecular mechanisms of tissue optical clearing at immersion and dehydration.
In skin, second harmonic generation (SHG) (see Section 4.6) is provided mostly within dermis due to its main component, which is collagen that has an appreciable nonlinear susceptibility. Evidently, due to optical clearing, less scattering in the epidermis for the incident long wavelength light (800 nm), and especially for the backward SHG short wavelength light (400 nm), may improve SHG images of dermis collagen structures.
At 100%-glycerol application to rodent skin dermis and tendon samples, as well as to engineered tissue model (raft), a high efficiency of tissue optical clearing was achieved in the wavelength range from 400 to 700 nm, but the SHG signal was significantly degraded in the course of glycerol application and it was returned back to the initial state after tissue rehydration by application of saline.946 The loss of the SHG signal in Ref. 946 is associated with the collagen fibers’ reversible dissociation and corresponding loss of fibril organization at glycerol action. Such an explanation is somewhat contradictory because less organization of collagen fibers will lead to less transmittance.442 Since the significant effect of optical clearing at glycerol application is tissue dehydration, the following explanation of data from Ref. 947 seems to be more adequate. Using reflective-type SHG polarimetry, it

404 |
Controlling of the Optical Properties of Tissues |
5.7 Cell and cell flows imaging
5.7.1 Blood flow imaging
Small blood microvessels can be clearly identified visually by the naked eye in in vivo study of hamster571,979 and rat980 skin, where a transparent window in the
skin was created by glycerol drops to the subdermal side of a native hamster dorsal skin flap window preparation,979 or by intradermal injection of glycerol571,980 or
40%-glucose980 (see Fig. 5.25). In an in vitro study of fresh human fat tissue at
topical application of a propylene glycol (PG) solution (50–80% with pure water), blood vessels were also seen.1008
Besides more precise visualization of the vessel network, immersion agents may have influence on blood microvessel functioning571,831,866,867,979,980 that gives
the possibility of controlling the functioning tissue within the area of agent action. Functioning of microvessels of rat mesentery under the topical action of glycerol and glucose was described.980 A topical application of 75%-glycerol during the initial period of 1–3 s led to a slowing down of blood flow in all microvessels (arterioles, venules, and capillaries). After 20–25 s, the stasis appeared and vessels were dilated by 30% on average, intravascular hemolysis took place to 1 min after agent application diameters of vessels were increased still more, to 40%. To the sixth minute, stasis was maintained in all vessels, but the diameters of vessels were slightly decreased. Such changes of microcirculation were exactly local within the area of glycerol application. The topical application of glucose also decreased blood flow velocity in microvessels. For example, at an action of 40% glucose on a venule with a diameter of 11 μm and with initial flow rate of 1075 μm/s, the flow rate decreased to 510 μm/s at 3 s after glucose application and to 202 μm/s at 5 s. Similarly with the action of glycerol, there were dilation and stasis of blood flow in all vessels (arterioles, venules, capillaries, and shunts) within 20–30 s, but no intravascular hemolysis was found, and only RBC aggregates in the lumen of microvessels were seen. The strength of vessel dilation was more than that for glycerol; the mean diameter increased by 30% to the thirtieth second after glucose application, but to the fourth minute, it rose on average by 2.5 times. From the third to the fifth minute, blood flow appeared again in a few microvessels and the velocity of reflow was markedly slower than in the control. The changes in blood flow were also local, but with a larger area than for glycerol, approximately 1 × 1 cm, and there were no any disturbances in the functioning of blood microvessels in the other parts of the mesentery. Evidently, a decrease in glucose concentration and corresponding loss of the agent hyperosmotic property led to softer glucose action on blood circulation; in particular, no blood stasis were observed for 20%-glucose, and after 3–4 min of glucose application, blood flow in all vessels was not significantly different from the initial one.
The vasculature under the dura mater also became visible after the treatment of glycerol in an in vivo experiment with rabbit.831,866,867 The reflectance decreased
as a function of time of glycerol action, which proved the visual observation. The
Tissue Optics: Light Scattering Methods and Instruments for Medical Diagnosis |
405 |
dura mater nearly recovered to the native condition after 1 min. Velocity images of in vivo cerebral blood flow (CBF) under the effect of glycerol are shown in Fig. 5.44. Glycerol was applied around the exposed area. When glycerol diffused in brain tissue and influenced CBF under the dura mater, the CBF in the exposed area would also change. Figure 5.45 illustrates the spatiotemporal characteristics of CBF changes under the treatment of glycerol. Under the action of glycerol, blood flow first decreased while the blood vessels underneath the dura mater became increasingly visible. The blood flow then increased to near baseline; at the same time, the turbidity of the dura mater returned. Figure 5.45 gives the time course of changes in four different vessels (Fig. 5.44), which is expressed as the ratio of the measured velocity in the conditions of treatment with glycerol to that of the control condition. Vessel 2 is an arteriole. Vessels 1, 3, and 4 are veinules. Blood flow in vessel 2 (arteriole) began to decrease after the twenty-second application of glycerol, while that in the other vessels (veinules) decreased immediately after application with glycerol. The blood flow in vessel 1 decreased slower than that in the other vessels, which suggested that blood flow in the arteriole had a different response from that in the veinules. Blood flow in all vessels decreased to 70–80% of baseline after treatment with glycerol.
An example of the subdermal side of native hamster dorsal skin flap window preparation is shown in Fig. 5.46(a). The main arteriole (A) is 97 ± 18 μm in diameter (lumen) and the main venule (V) is 188 ± 21 μm in diameter. The diameters of the branches, a and v, are 92 ± 18 μm and 181 ± 21 μm, respectively. Figure 5.46(b) shows the blood vessels in the same window preparation ten minutes after the application of 100%-glycerol. The smallest branches of the arterioles and venules can now be seen in the image. This is likely due to the increased clearing of the tissue overlying the vessels and could also occur with vasodilation. The venule branch, v, is dilated to 259 ± 19 μm. The main vessels and the arteriole branch (a), however, are not noticeably dilated. After twenty minutes, the main venule branch in the window preparation appears very dark and is occluded [Fig. 5.46(c)]. The diameters of the main vessels are 97 ± 18 mm (A), and 189 ± 20 mm (V), and the diameters of the branches are 141 ± 17 mm (a) and 259 ± 21 mm (v).
Optical clearing of vascularized tissue may have some important biomedical applications connected with the investigation of vascular system structure and function, including the relation of the diameters of arterioles and venules, capillary density, bifurcation angles, etc. These parameters can be important in physiology and therapy for the diagnosis and treatment of some diseases (vascular disease, cancer, etc.). On the other hand, the optical clearing effect coupled with temporary and local cessation of blood flow in microvessels in the area of treatment may help vascular photothermal therapy significantly.979
5.7.2 Optical clearing of blood
Refractive index mismatch between erythrocyte cytoplasm and blood plasma causes strong scattering of blood that, for example, prevents getting high-quality

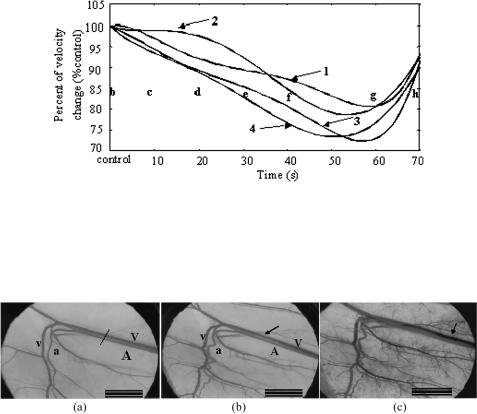
Tissue Optics: Light Scattering Methods and Instruments for Medical Diagnosis |
407 |
Figure 5.45 The time course of change in relative blood flow in vessels 1, 2, 3, and 4, which are indicated in Fig. 5.44(b), before and after the application of glycerol epidurally. After 20 s, the blood flow in vessel 2 (arteriole) began to decrease, while blood flow in the other vessels (veinules) decreased immediately after the application of glycerol. Decreases of blood flow in these vessels were 20–30% of the baseline. The letters b, c, d, e, f, g, and h denote the time points of corresponding images in Figs. 5.44 (b)–(h).831
Figure 5.46 Images of the subdermal side of in vivo hamster dorsal skin flap window preparation.979 (a) Native, the main arteriole (A) is 97 ± 18 μm in diameter (lumen) and the main venule (V) is 188 ± 21 μm in diameter; the diameters of the branches, a and v, are 92 ± 18 μm and 181 ± 21 μm, respectively. (b) Ten minutes after the application of glycerol (100%); (c) 20 min after the application of glycerol, the diameters of the main vessels are 97 ± 18 mm (A), and 189 ± 20 mm (V), and the diameters of the branches are 141 ± 17 mm (a) and 259 ± 21 mm (v). Scale bar: 0.25 cm.
images of intravascular structures through whole blood. The refractive index of erythrocyte cytoplasm is mostly defined by hemoglobin concentration.48 Hemoglobin
oxygenation751 and glycation may have some role in refractive index mismatch (see Section 2.9).752,753 The scattering properties of blood are also de-
pendent on erythrocyte volume and shape, which are defined by blood plasma osmolarity48,1035 and aggregation or disaggregation ability.737,982,1036,1037,1103–1105
Recently, the feasibility of index matching as a method to overcome the lim-
ited penetration through blood to obtain OCT tissue images has been demonstrated for circulating, steady-state, or sedimenting blood.737,981,982,1036,1037 Glucose, low-
and high-molecular dextrans, x-ray contrast, glycerol, and some other biocompatible agents were used to increase the refractive index of blood plasma closer to that of the erythrocyte cytoplasm to improve the penetration depth of OCT images. OCT and other noninvasive imaging techniques, such as back-reflectance
408 Controlling of the Optical Properties of Tissues
spectrophotometry, polarization-sensitive, fluorescence, multiphoton, and Raman
spectroscopies, which already have witnessed widespread and exciting application in biomedical diagnostics,126–144 may have additional advantages in the early di-
agnostics of vascular disease through optically clarified blood.
Normal human blood is a scattering system that consists of about 43% by vol-
ume of scattering particles [99% red blood cells (RBC), 1% leukocytes and thrombocytes) and the about 57% by volume of plasma.48,725 Under normal physiolog-
ical conditions, hematocrit (Hct), defined as the volume fraction of cells within whole blood, ranges from 36.8 to 49.2%.48 Propagation of light in such a medium can be studied within the model of light scattering and absorption by an individual particle, taking into account the interparticle correlation effects and polydispersity.
As it was noted, the blood plasma osmolarity is an important factor in changes in the scattering properties of blood.48,552,737 The effects of glucose, glycerol, tra-
zograph, and propylene glycol, which are hyperosmotic agents, led to significant change of blood plasma osmolarity. The change in osmolarity induces a variation of the RBC volume due to water exchange and therefore has an impact on the hemoglobin concentration within the RBC and consequently on their refractive index. It was demonstrated that a glucose solution with a concentration less than 20% led to an increase of blood scattering due to the osmotic dehydration of erythrocytes.552 Significant optical clearing was obtained at a glucose concen-
tration higher than 40%, but such a concentration can cause erythrocyte aggregation.737
The result of the OCT study is the measurement of optical backscattering or reflectance R(z) from the RBCs versus axial ranging distance, or depth z. The reflectance depends on the optical properties of blood, i.e., the absorption μa and scattering μs coefficients, or total attenuation coefficient μt = μa + μs. The relationship between R(z) and μt is, however, highly complicated because of the high and anisotropic scattering of blood. But for optical depths less than 4, the reflected power can be approximately described by Eq. (5.27). Optical depth is a measure of depth in terms of the number of mean free path lengths, i.e., μsz. α(z) is linked to the local refractive index and the backscattering property of the blood sample. If α(z) is kept constant, for which at least a laminar blood flow for circulating blood or measurements before the sedimentation process begins for uncirculating blood should be provided, μt can be obtained theoretically from the reflectance measurements at two different depths, z1 and z2 [see Eq. (5.28)]. Optical clearing (enhancement of transmittance) T by an agent application can be estimated using Eq. (5.29), where Ra is the reflectance from the backward surface of the vessel within a blood sample with an agent, and Rs is that with a control blood sample (whole blood with saline).
A 1300-nm OCT system was used for taking images of the reflector through circulated blood in vitro.981 As immersion substances, dextran (group refractive index, 1.52) and IV contrast (group refractive index, 1.46) were taken. The system allows the blood to be circulated in vitro through transparent tubing to reproduce coronary flow. Blood with Hct 35% was pumped through a closed system of tubing by a perfusion pump. The flow rate was 200 ml/min, which is approximately
Tissue Optics: Light Scattering Methods and Instruments for Medical Diagnosis |
409 |
the peak flow in the coronary artery. The diameter of the tubing was 6 mm, approximately the diameter of a normal adult coronary artery. A reflector was placed in the tubing; the section of the reflector imaged is approximately 2 mm below the inner surface of the tubing. Once blood was introduced into the system and circulated, OCT imaging of the reflector was performed. The total intensity of the signal off the reflector is used to represent penetration [see Eq. (5.29)]. The more light that is scattered by blood the smaller the signal off the reflector.
After baseline data had been obtained with blood, test substances were added to the blood. The test substances were dextran (0.25 g/ml in normal saline), IV contrast, or normal saline.981 Hematocrit and RBC concentrations were measured before and after the experiments. All substances added had a volume of 40 mls, which was added to a total volume of 260 ml. For the saline control, a 7 ± 3% increase in signal intensity was noted, which was not a statistically significant effect. A 69 ± 12% increase in T was noted for dextran, which was statistically different from the saline control (p < 0.005). For the IV contrast, a 45 ± 4% increase was noted, which was also significantly different from the control (p < 0.001).
By OCT imaging in the presence of saline, blood (Hct 35%), or lysed blood (Hct < 1%), it was directly demonstrated that RBC intracellular/extracellular mismatch, and not membrane or hemoglobin absorption, is the main source of nearinfrared attenuation by blood. In the presence of blood, the reflector was difficult to locate. However, when the RBCs were lysed, signal intensity returned to values not significantly different from saline. The fact that the cell membrane is not the major source of scattering is not surprising since it is too small relative to the wavelength to significantly scatter (see Figs. 1.54 and 1.55).
In the case of dextran, the effect was consistent with index matching. With the IV contrast, a small but significant decrease in RBC volume was noted by a decrease in hematocrit but not the RBC number relative to the saline control. Therefore, some improvement in penetration may be due to a reduction in cell volume. The lack of improved penetration with the addition of normal saline (40 ml) is consistent with data of Ref. 48 that suggested dilution of the hematocrit to below 10% was necessary before significant improvement in penetration was seen.
Studies of blood scattering reduction by the immersion technique using various osmotically active solutions that are biocompatible with blood, such as
saline, glucose, glycerol, propylene glycol, trazograph, and dextrans, were also described.737,982,1036,1037 The 820and 1310-nm OCT systems were applied for,
taking images of the reflector through a layer of uncirculating fresh whole blood. The OCT system used yields 12-μm axial resolution in free space. This determines the imaging axial resolution that is comparable with the dimensions of RBCs or small aggregates. It was shown that for uncirculating blood, the sedimentation may play an important role in blood clearing using the immersion technique and OCT allows for precise monitoring of blood sedimentation and aggregation.
Venous blood was drawn from healthy volunteers and stabilized by 9NC coagulation sodium citrate 3.2% or by K2E EDTA K2. The major blood samples were prepared immediately after blood was taken by gently mixing blood and
410 |
Controlling of the Optical Properties of Tissues |
agent (for agents in liquid state) or agent-saline solution (for agents in solid state) with low rate manual rotation for 1 min before each OCT measurement. A few samples were stored before measurements up to 24 hr after blood taking. Four
groups of the blood samples with various hematocrit values were investigated in
the study.737,982,1036,1037
A few different glass vessels from 0.2- to 2-mm thick were used as blood sample holders. For some holders to enhance reflection from the bottom interface, a metal reflector was used. The sample holder was mounted on a translation stage at the sample arm and was placed perpendicular to the probing beam. The amplitude of reflected light as a function of depth at one spatial point within the sample was obtained. The result is the measurement of optical backscattering or reflectance R(z) from the RBCs versus axial ranging distance, or depth z, described by Eq. (5.27). The total attenuation coefficient μt and enhancement of transmittance (optical clearing) T by an agent application were estimated using Eqs. (5.28) and (5.29), respectively. Averaging for a few tenths of z-scans was employed.
The scattering μs and reduced scattering coefficient μs of blood depend on mismatch of averaged refractive indices of blood plasma and erythrocyte cytoplasm. The ratio nRBC/nbp ≡ m determines the scattering coefficient, nRBC is the mean refractive index of erythrocyte cytoplasm, and nbp is the mean refractive index of the blood plasma. For the model of RBC ensemble as a monodisperse system of noninteracting scattering dielectric spheres of radius a irradiated at a NIR wavelength λ, when 5 < 2πa/λ < 50, anisotropy scattering factor g > 0.9, and 1 < m < 1.1, the reduced scattering coefficient μs is described by Eq. (2.24).
Blood plasma contains up to 91% water, 6.5–8% (about 70 g/l) various proteins, and about 2% low molecular compounds. Because of the low concentration and relatively low refractive index of low molecular chemical compounds, the mean blood plasma (background) index can be estimated as the weighted average of the refractive indices of water (92%) nw and proteins (8%) np as
nbp = fwnw + (1 − fw)np, |
(5.30) |
where fw is the volume fraction of water contained in plasma, nw = 1.329 at 800 nm, and the index of proteins can be taken as np = 1.470.749 Since approxi-
mately 92% of the total plasma is water, it follows from Eq. (5.30) that nbp = 1.340. The empirical formula, described by Eq. (2.30), can be used to estimate the blood plasma index in the wavelength range from 400 to 1000 nm. The refractive index of erythrocyte cytoplasm, defined by the cell-bounded hemoglobin solution, can be found from Eq. (2.31). As it follows from Eq. (2.24), about a tenfold reduction of the scattering coefficient μs is expected when the refractive index of the blood plasma is changed from nbp = 1.340 to 1.388 and the refractive index of RBC cytoplasm is kept constant at nRBC = 1.412 (for hemoglobin concentration in cytoplasm of 400 g/l).48
For slightly diluted blood (Hct 35%), optical clearing was found only for dextran of molecular weight M = 500,000 with concentration in a blood sample of
Tissue Optics: Light Scattering Methods and Instruments for Medical Diagnosis |
411 |
0.325 g/dl and glycerol with a volume fraction of 13%. Values of T , characterizing optical clearing, were from 20.2 to 78.4% for dextran and from 13.7 to 95% for glycerol, depending on time of blood sample storage (Table 5.3). The minimal and maximal values have been found for blood samples that were stored after taking the blood for a short (1–3 hr) and for a long (24 hr) time interval, respectively. For the time interval of 4–6 hr of blood storage, T = 46.5% for dextran and 74.5% for glycerol. Evidently, at high concentrations of RBC in a sample, interaction of used agents with blood significantly depends on the physicochemical parameters of blood, which may be changed at prolonged storage (hemolysis). Thus, all other measurements were done as fast as possible after taking the blood.
For 56.5%-diluted blood by saline, the blood samples with trazograph-60, propylene glycol, and glycerol had a lower total attenuation coefficient than the control. Optical clearing T was from 45.3 to 117.1% as measured immediately after mixture, when sedimentation is not critical for the optical properties of the blood layer (Table 5.3). The minimal attenuation (approximately half of that for the control) and the maximal enhancement of transmittance ( T = 117.1%) were found for application of glycerol. Propylene glycol is also a good enhancer of blood transmittance ( T = 77.2%).
Similar effects of increase in transmittance and decrease in scattering were demonstrated by use of dextrans of various molecular weights. Table 5.3 shows that all three dextrans used, A, B, and C, reduced the amount of the attenuation (scattering) coefficient in blood with respect to saline. Optical clearing T was in the range from 52.1 to 150.5%. The dextran with the highest molecular weight appeared to have a much stronger effect on the increase in transmittance immediately after mixing. A blood sample mixed with an agent of higher refractive index, for example, dextran C, had a higher reflectivity from the metal surface than did agents such as saline (control) and dextran A with lower refractive indices. The results support the hypothesis that the refractive index matching effect is important for clearing of 50%-diluted blood.
It can be seen from Table 5.3 that dextrans C and B at concentration of 2.43 g/dl in 35%-diluted blood are effective agents for decreasing the light attenuation of blood compared to the saline control, with the total attenuation coefficient decreased from 37.1 cm−1 for the saline control to 31.2 cm−1 and 29.7 cm−1, respectively. The optical clearing capability T was approximately 90% and 100% for dextran C and B, respectively. It is interesting that dextran C, providing a higher refraction, had less effect than that of dextran B at the same concentration. Moreover, the increase in concentration (refraction power) cannot always achieve higher optical clearance: 0.5 g/dl dextran C had a stronger effect than 5 g/dl in samples with 20% blood and 80% saline.
The changes in scattering property brought about by the addition of a dextran solution may first be explained by the refractive index matching hypothesis. It can be seen that scattering can be reduced when the refractive index of plasma is increased. The refractive index of the dextran saline solution was increased with concentration in all molecular weight groups. The measured indices of blood samples with dextrans were in good agreement with the theoretical values calculated

412 Controlling of the Optical Properties of Tissues
Table 5.3 The total attenuation coefficient and enhanced transmittance T (%) of blood samples diluted by saline and added agents; pH for all solutions was approximately 7.5; dextran A (M = 10,500); dextran B (M = 65,500), and dextran C (M = 473,000).
Agent |
Concentration |
Hct (%) |
μt (cm−1) |
T (%) |
Comments |
|
(vol.% or g/dl) |
|
|
|
|
|
|
|
|
|
|
Saline |
13% (control) |
35 |
61(3) |
– |
From 1 to 24 hr |
Glycerol |
13% |
35 |
51(5) |
13.7–95.0 |
after taking blood; |
Dextran |
0.325 g/dl |
35 |
55(5) |
20.2–78.4 |
dextran sulfate, |
|
|
|
|
|
M ≈ 500,0001036 |
Saline |
35% (control) |
26 |
37.1(1.3) |
– |
Male volunteer, |
Dextran A |
2.43 g/dl |
26 |
38.2(2.4) |
11.9(8.3) |
24 yr old982 |
Dextran B |
2.43 g/dl |
26 |
29.7(3.6) |
100.1(20.2) |
|
Dextran C |
2.43 g/dl |
26 |
31.2(1.8) |
86.7(29.1) |
|
Saline |
56.5% |
17.4 |
42 |
– |
Female volunteer, |
|
(control) |
|
|
|
35 yr old737,1036 |
Trazograph-60 |
6.5% + 50% |
17.4 |
26 |
45.3 |
|
|
saline |
|
|
|
|
Propylene |
6.5% + 50% |
17.4 |
26 |
77.2 |
|
glycol |
saline |
17.4 |
|
|
|
Glycerol |
6.5% + 50% |
17.4 |
20 |
117.1 |
|
|
saline |
|
|
|
|
Glucose |
1.62 g/dl |
17.4 |
57 |
45.3 |
|
Dextran A |
1.62 g/dl |
17.4 |
43 |
47 |
|
Dextran B |
1.62 g/dl |
17.4 |
54 |
44.6 |
|
Dextran C |
1.62 g/dl |
17.4 |
58 |
20.5 |
|
Saline |
56.5% |
17.4 |
36.5 |
– |
Male volunteer, |
|
(control) |
|
|
|
35 yr old737 |
Dextran A |
1.62 g/dl |
17.4 |
29.5 |
52.1 |
|
Dextran B |
1.62 g/dl |
17.4 |
30.0 |
110.6 |
|
Dextran C |
1.62 g/dl |
17.4 |
32.5 |
150.5 |
|
Saline |
56.5% |
17.4 |
25.6(1.6) |
– |
Male volunteer, |
|
(control) |
|
|
|
23 yr old982 |
Dextran A |
1.62 g/dl |
17.4 |
22.5(2.4) |
20.5(4.2) |
|
Dextran B |
1.62 g/dl |
17.4 |
19.0(3.8) |
44.5(3.4) |
|
Dextran C |
1.62 g/dl |
17.4 |
14.3(4.3) |
47.0(9.7) |
|
Saline |
80% (control) |
8 |
13.5 |
– |
Male volunteer, |
Dextran A |
1 g/dl |
8 |
17.5(0.9) |
11.4(6.2) |
36 yr old, |
Dextran A |
5 g/dl |
8 |
14.3(1.2) |
11.3(3.3) |
hemoglobin: |
Dextran A |
10 g/dl |
8 |
12.2(1.8) |
49.4(12.1) |
initial—175 g/l, |
Dextran B |
1 g/dl |
8 |
14.2(1.5) |
21.1(5.4) |
diluted—37 g/l, |
Dextran B |
5 g/dl |
8 |
13.0(2.8) |
49.0(26.2) |
Ref. 982. |
Dextran B |
10 g/dl |
8 |
11.5(1.3) |
76.8(21.2) |
At the beginning of |
|
|
|
|
|
blood sedimentation |
|
|
|
|
|
|
Tissue Optics: Light Scattering Methods and Instruments for Medical Diagnosis |
413 |
|||||
|
|
Table 5.3 (Continued). |
|
|
||
|
|
|
|
|
|
|
Agent |
Concentration |
Hct (%) |
μt (cm−1) |
T (%) |
Comments |
|
|
(vol.% or g/dl) |
|
|
|
|
|
|
|
|
|
|
|
|
Dextran C |
0.5 g/dl |
8 |
10.0(1.6) |
106.3(39) |
|
|
Dextran C |
5 g/dl |
8 |
13.3(0.7) |
67.0(5.8) |
|
|
Dextran A |
1 g/dl |
8 |
– |
90 |
Compared to that of the |
|
Dextran A |
5 g/dl |
8 |
– |
61 |
saline control on light |
|
Dextran A |
10 g/dl |
8 |
– |
32 |
transmission after |
|
Dextran B |
1 g/dl |
8 |
– |
144 |
10 min sedimentation, |
|
Dextran B |
5 g/dl |
8 |
– |
126 |
( Tdext/ Tsaline)% |
|
Dextran B |
10 g/dl |
8 |
– |
18 |
|
|
Dextran C |
0.5 g/dl |
8 |
– |
285 |
|
|
Dextran C |
2 g/dl |
8 |
– |
133 |
|
|
Dextran C |
5 g/dl |
8 |
|
15 |
|
|
|
|
|
|
|
|
|
according to the equation n = cbnb + (1 − cb)nsaline, where cb is the volume fraction (20%) of whole blood in the diluted sample and nsaline is the index of saline with or without dextrans. As expected, the refractive index of blood with dextran increases as the concentration of the added dextran increases due to an increase of the index of the ground matter of the sample.
It should be noted that the total attenuation coefficient for glucose and dextrans was not changed significantly with respect to the control; nevertheless, transmittance enhancements of 45% for glucose and of 52–150% for dextrans were found. The concurrent increase of attenuation and transmittance by dextran B and C relative to A shows not only that refractive index matching is important for blood layer optical clearing, but also that RBC aggregation, which defines the scattering indicatrix, may be substantial. Dextran macromolecules are neutral polymers. The high molecular weight dextrans are used artificially to induce RBC aggregation by bridging surfaces of adjacent cells after adsorption on their surfaces. The low molecular weight dextrans prevent normal blood aggregation. From blood smear microscopy, it can be seen that rouleaux occurred in the blood diluted with dex-
tran C, but no aggregates were produced in the blood mixed with low molecular weight dextran A.1018,1019,1036,1037 The lower sedimentation rate of blood with dex-
trans B and C and the higher sedimentation rate of blood with dextran A relative to the rates for whole blood or for blood diluted with saline also reflect the aggregation abilities of various dextrans.737 The high molecular weight dextran C has greatly changed the scatter (RBCs and aggregates) morphology and size. Normal RBCs are biconcave disks of 8-μm diameter and 2-μm thickness when they are in an isotonic solution. It is known that the RBCs’ sizes, shapes, and orientations contribute to the properties of blood backscattering.1103–1105 Aggregation results in a decrease in diffusing surfaces, which in turn leads to a decrease of the backscattered signal.1104 It can be concluded that the greater transmittance enhancement of
414 |
Controlling of the Optical Properties of Tissues |
dextran C is governed strongly by the scattering changes (refractive index matching) accompanied by RBC aggregation.
Some discrepancy between μt and T can be also explained by the fact that different algorithms are used to estimate them: μt is defined as a single-scattering parameter and T is defined as an experimental value that accounts for multiple scattering, which is why it is more sensitive for the reduction of scattering. It has been shown that immersion leads at first to a reduction in the number of scattering events and only then to the appearance of ballistic photons (see Figs. 5.4–5.6).798 For example, for the scattering system described in Ref. 798, which normally has for unmatched indices of scatterers ns = 1.47 and ground material n0 = 1.35 a total transmittance at 800 nm of 10%, after index matching (n0 = 1.41) the total transmittance rises to 45%, but the number of scattering events (as many as 10–15) remains high [see Fig. 5.5(c)].
It should be noted that for fresh erythrocyte concentrates flowing at a physiological velocity at an oxygen saturation of 98%, the change of Hct from 0.4 to 0.2 causes a reduction of the transport scattering coefficient μs from 16.8 to 8.8 cm−1 at 633 nm, measured by an integrating sphere technique.48 The corresponding changes in scattering coefficient μs and anisotropy factor g are: μs from 850 to 800 cm−1 and g from 0.980 to 0.989. A largely reduced value (by more than ten times) of the total attenuation coefficient measured by OCT (see Table 5.3) relative to the value of the scattering coefficient measured by an integrating sphere technique for blood samples with approximately equal hematocrit also shows the limitations of a single-scattering algorithm to extract a proper value of the total attenuation coefficient. Another reason for such strong discrepancy between μt andT data may be the spatial variations of the reflectivity of the blood sample α(z) associated with the variations of the local refractive index and the backscattering property of the blood sample.
Sedimentation increases the transparency of a blood layer because there is less bulk scattering as the RBCs fall. As expected, the undiluted blood sample has the
lowest reflectance from the metal plate because it has a higher concentration of scatters (RBCs) and a lower sedimentation rate.737,1036,1037 For blood slightly di-
luted by a saline and at addition of the low molecular weight dextran A, reflectance from the metal plate in the depth of the blood sample increases because both the dilution by saline and addition of dextran A cause more intense sedimentation. Dextran B, which has a mean molecular weight, permits higher reflectance than the control (i.e., blood diluted by saline) only during the first 4 min; this result reflects the competition between two processes: refractive index matching, which is important at the beginning, especially for dextran, and sedimentation, which is more important for the control sample after some time has elapsed. The high molecular weight dextran C permits an increase in metal plate reflectance compared with that of the control for only a short period at the beginning of sedimentation, when only the refractive index matching effect dominates. Such behavior shows that, after some time, interval RBC sedimentation may be more important for increasing reflectance than the refractive index matching effect, which is provided by dextrans with higher molecular weight. This result is clearly seen from the in-depth
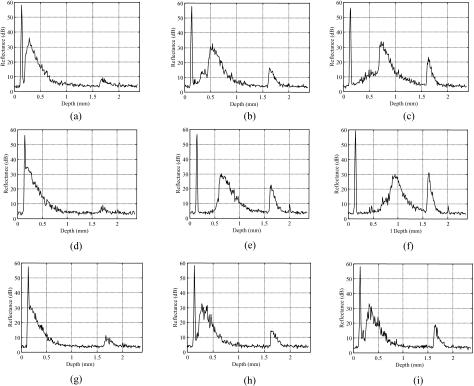
Tissue Optics: Light Scattering Methods and Instruments for Medical Diagnosis |
415 |
reflectance profiles presented in Fig. 5.47, which show the three main evolution peaks in time: the first peak is independent of time and is induced by reflectance at the glass-blood interface; the second peak, which is broad and has some structure, is caused by reflectance at the RBC-plasma interface (within this peak, aggregates can be seen); and the third peak is caused by the metal reflector. Qualitatively, the height difference between the first and the third peaks shows changes in the blood layer’s transmittance, and the second broad peak is related to the attenuation coefficient of this layer.
Figure 5.47 OCT in-depth reflectance profiles measured for slightly diluted whole blood (13% volume fraction of saline, hematocrit 35%, concentration of dextran 3.25 g/dl in the blood sample). (a), (d), and (g), at the beginning of the sedimentation process; (b), (e), and (h), at 5 min; and (c), (f), and (i), at 10 min for (a)–(c) saline only, (d)–(f) dextran A added, and (g)–(i) dextran C added. The first peak is induced by reflectance at the glass-blood interface; the second peak, which is broad and has some structures, is caused by reflectance at the RBC-plasma interface; and the third peak is caused by the metal reflector.737
To clarify the role of RBC aggregation on optical clearing and accounting for the fact that the aggregation process is time dependent, the blood sample was allowed to sediment after the addition of dextrans and before measurements were done. Table 5.3 shows a summary of the effect of dextrans compared to the saline
416 |
Controlling of the Optical Properties of Tissues |
control on light transmission for the sample with 20% blood and 80% saline after 10 min sedimentation. It can be seen that the influence of dextran on the light transmission was different compared to that at the beginning of mixing dextrans in blood (corresponding upper rows). The lower concentration (0.5 g/dl) dextran C still had the strongest effect on reducing the scattering of light in the blood, with a 2.8-fold stronger effect than that of the saline control. However, enhancement by the highest concentration of dextran C (5 g/dl) and dextran B (10 g/dl) was dramatically lower than that of the saline control. At the beginning, they both had a very high blood optical clearing capability with 67.5 and 76.8% of T , respectively. In addition, the effect was decreased with the increase of dextran in the blood within all three groups, contrary to the expectation of the refractive index matching hypothesis.
The decreased aggregation capability of dextran with concentration explained well that light transmission decreased less with the increase of dextran for both types (midmolecular and large molecular). Over a range of concentrations, dextran C and B induced RBC aggregation. However, dextrans have been known to exert a biphasic effect on RBC aggregation; they induce aggregation at low concentration, and disaggregation at high concentration.1106 For example, with dextran B, the maximal aggregation size is obtained at approximately 3%, above which the size decreases. In OCT measurements of Ref. 982, 2 g/dl dextran C and 5 g/dl dextran B in 20% blood with 80% saline appeared to be the critical concentration to affect RBC aggregation. Their aggregation parameters became smaller than those of 0.5 g/dl dextran C and 1 g/dl dextran B. When the concentration increased to 5 g/dl for dextran C and 10 g/dl for dextran B, they played a role of disaggregation. That is the reason why the cells are much less packed than with the saline control, accounting for the reduced light transmission. Although refractive index matching suggested a higher light transmission, it can be seen that the aggregationdisaggregation effects are now dominant.
The behavior of RBC in flow is dependent on the processes of aggregationdisaggregation, orientation, and deformation. For normal blood, rouleaux are easily decomposed to their individual cell constituents as blood flow (shear) increases. In some pathological cases, however, the capillary circulation is seriously affected because nonseparable rouleaux are formed. Increased RBC aggregability has been observed in various pathological states, such as diabetes and myocardial infarction, or following trauma.1107 The aggregation and disaggregation properties of human blood can be used for the characterization of the hemorheological status of patients suffering from different diseases.1105 In this connection, optical clearing methodology for controlling of optical properties of blood using molecules with a specific action on the RBCs and plasma may be useful in the monitoring of blood parameters in flow.
It is obvious that refractive index matching is not the only factor to affect transmittance in these experiments. The amount of the aggregation certainly has an effect, but other factors, such as the hematocrit, the manner in which RBCs are packed, the shape of the aggregates, the variance in size of these aggregates, and the fluctuation of all these parameters in time and space, may all contribute.

Tissue Optics: Light Scattering Methods and Instruments for Medical Diagnosis |
417 |
It should be noted that the blood plasma’s osmolarity is also an important factor in changes in the scattering properties of blood and, therefore, in the control of blood clearing and the improvement of the contrast of OCT images obtained within or behind a layer of blood. In the discussed experiments, the osmolarity of the plasma was different for each of the added agents. Variation in plasma osmolarity leads to changes in the shape of the erythrocytes: RBC shrinking (acanthocytes) when the plasma is hyperosmotic and swelling (spherocytes) when it is hypoosmotic. For the diluted blood samples (Hct of 7.5%), the scattering coefficient μs shows a slight decrease ( 10%) with increasing osmolarity in the range from 225 to 450 milliosmol/l; also, the anisotropy factor g decreases from 0.995 to 0.991, and the reduced (transport) scattering coefficient μs correspondingly increases linearly with osmolarity up to 70%.48 Such a strong effect on the scattering properties of the blood solution is caused not only by changes in cell shape, but also by the variation with osmolarity of the refractive index of the cell-bounded hemoglobin solution. The refractive index of the cell-bounded hemoglobin solution can be estimated from Eq. (2.31). Assuming a mean erythrocyte volume of 90 μm3 and an inner cell hemoglobin concentration of 350 g/l for isotonic conditions, the following values of refractive indices and sphere equivalent diameters were calculated. Table 5.4 shows this data and that the osmolarity of the blood solution can substantially change the scattering properties of the blood layer. Refractive index matching is easier to achieve in conditions of low osmolarity, but for OCT imaging of RBCs or their aggregates, the hypertonic conditions are preferable.
Table 5.4 RBC parameters found from osmolarity of the blood solution.48
Osmolarity, |
Hct, % |
RBC |
RBC hemoglobin |
Refractive |
Equivalent |
|
milliosmol/l |
|
volume, |
concentration, g/l |
index |
sphere |
|
|
|
|
μm3 |
|
at 589 nm |
diameter, μm |
250 |
(hypotonic) |
8.1 |
96.7 |
325 |
1.397 |
5.70 |
300 |
(isotonic) |
7.5 |
90.0 |
350 |
1.402 |
5.56 |
400 |
(hypertonic) |
6.6 |
78.6 |
400 |
1.412 |
5.32 |
|
|
|
|
|
|
|
From the above analysis of experimental data follows that to theoretically describe light transport in the immersed blood, we have to consider blood as a turbid medium with multiple scattering, defined by the scattering and absorption properties of individual particles (erythrocytes) and by the concentration effects and polidispersity of the cell suspension. The erythrocyte size and complex refractive indices (n + in ) of erythrocytes and blood plasma define the absorption μa and scattering μs coefficients, and scattering anisotropy factor g. The size, shape, and optical parameters of blood cells as well as the optical properties of a blood suspension are presented in Section 2.9 and Tables 2.2, 2.3, and 5.4. The erythrocyte mean volume at isotonic medium is 94 ± 14 μm3, and the volume distribution is in the range from 30 to 200 μm3 (see Refs. 48, 725, 730, 1108, and 1109). The
418 |
Controlling of the Optical Properties of Tissues |
hemoglobin concentration in hemolized blood is between 134 and 173 g/l. Each erythrocyte contains approximately 29 pg of hemoglobin. The hemoglobin concentration within an erythrocyte ranges from 300 to 360 g/l. The real part of the
refractive index of the red blood cell is very close to 1.4 in the wavelength range from 400 nm to 1200 nm.183,730,755,1108
The phase function and scattering cross section of an individual erythrocyte depend on its orientation.159 However, the light-scattering characteristics of a large number of randomly distributed nonspherical particles is very close to the light-
scattering characteristics of a system of randomly distributed spherical particles with an equal volume.48,1110 Therefore, calculations can be done for a model of ho-
mogeneous spheres with the volume equal to the volume of real erythrocytes. Such a model provides simpler calculations than that for a rigorous theory accounting for particle nonsphericity145 and allows one to account for particle polydispersity in the simplest way; in particular, on the basis of the data presented in Ref. 730 (see Fig. 5.48). The presence of big particles in the distribution can be associated with small aggregates of RBCs.
Figure 5.48 Size distribution function of spherical particles modeling erythrocytes in blood.730 The volume fraction of erythrocytes in the blood (hematocrit) is 45%, which corresponds to venous blood of an adult male.
Evidently, the hemoglobin concentration CHb in an erythrocyte correlates with its volume VRBC. In accordance with data of Ref. 1108, such dependence is defined by
CHb = 0.72313 − 0.00451VRBC, |
(5.31) |

Tissue Optics: Light Scattering Methods and Instruments for Medical Diagnosis |
419 |
were CHb is the hemoglobin concentration in g/ml and VRBC is the RBC volume in μm3.
The spectral dependence for the real part of the RBC refractive index is presented in Fig. 2.12,159,730 and the spectral dependence for the imaginary part can
be calculated using data presented in Fig. 2.11. Both refractive index components are proportional to hemoglobin concentration in RBCs; the real part is defined by Eq. (2.31) with βHb = 0.001942 dl/g at 589 nm48 and βHb = 0.00284 dl/g at 640 nm,159 and the imaginary part is defined by the following expression:
n = αHbCHb, |
(5.32) |
where αHb is the spectrally dependent coefficient equal to 1.477 × 10⁻⁶ dl/g at 640 nm.159
Since the concentration of salts, sugars, and other organic components in RBC cytoplasm is negligible, hemoglobin can be dissolved in water only [see Eq. (2.31)]; thus, the spectral dependence of the refractive index of the medium in which hemoglobin is dissolved is defined by water. For a more precise descrip-
tion of the refractive index of this medium n0(λ) when organic components are accounted for, instead of nw(λ), n0(λ) = nw(λ) + 0.007 may be used.1042
The spectral dependence of the real part of the refractive index of blood plasma can be described by the empirical Eq. (2.30) and, because blood plasma contains up to 91% of water, only 6.5–8% (about 70 g/l) proteins (hemoglobin, albumin, and globulin), and about 2% of low-molecular compounds, its imaginary part is negligible and can be ignored in calculations.
For further calculation of the scattering and absorption coefficients and the scattering anisotropy factor, the Mie theory valid for a homogeneous spherical particle is used. The corresponding equations for scattering and absorption cross sections and anisotropy factor are given by Eqs (1.193)–(1.195). For a densely packed polydisperse particle system, which whole blood is, the absorption and scattering
coefficients and the scattering anisotropy factor are defined by [see Eqs. (1.173) and (1.176)]156
|
NRBC |
|
|
|
||
|
$ |
|
|
|
|
|
μa = |
|
Ni σai , |
(5.33) |
|||
|
i=1 |
|
|
|
|
|
|
|
NRBC |
|
|||
μs = F (Hct) |
$ |
|
(5.34) |
|||
|
Ni σsi , |
|||||
|
|
|
i=1 |
|
||
|
= % i 1 μsi |
|
||||
|
NRBC |
μsi gi |
|
|
||
g |
i=1 |
|
, |
(5.35) |
||
|
% |
= |
|
|
|
|
|
NRBC |
|
||||
420 |
Controlling of the Optical Properties of Tissues |
where F (Hct) is the packing function of RBCs [see Eqs. (1.170)–(1.172)],183,567,568 which accounts for the interparticle correlation effects; Hct is the hematocrit; NRBC is the number of RBC diameters (volume fractions); and Ni = fRBCi /VRBCi is a number of RBCs in a unit volume of blood; fRBCi is the volume fraction of RBCs with volume VRBCi = (4/3)πai3 (see Fig. 5.48), where ai is the radius of an individual equivalent volume spherical particle.
At glucose application as an immersion agent, the spectral dependence of the index of refraction of blood plasma corrected by the added glucose-water solution should be accounted for [see Eqs. (2.36) and (1.202)] as
nbp+gl(λ) = nbp(λ) + 0.1515Cgl, |
(5.36) |
where nbp(λ) is the refractive index of blood plasma defined by Eq. (2.30), and Cgl is the concentration of glucose in g/ml. Because glucose has no strong absorption bands within the spectral range from 400 to 1000 nm, its absorption may be neglected. It can also be hypothesized that glucose molecules do not bound with proteins in blood plasma and hemoglobin in RBCs during the limited time (a few minutes maximum) of their interaction.
As we already discussed, the RBC is very sensitive to changes in blood plasma osmolarity (see Table 5.4). At osmolarity increase due to cell dehydration, the RBC volume decreases, hemoglobin concentration within the cell increases, and the index of refraction increases. Glucose injection in blood causes the linear increase of plasma osmolarity with glucose concentration, up to 6000 mOsm/l at glucose concentration in blood plasma of 1.0 g/ml. Indeed, for patients, such large glucose concentrations may be applied only locally in the vicinity of a vessel wall site under spectroscopic study or optical imaging. Using data of Ref. 48, the following empirical relation was suggested to describe RBC volume change with osmolarity:552
VRBC(osm) = VRBC(300) 0.463 + 1.19 exp − |
376.2 |
, |
(5.37) |
|
osm |
|
|
where VRBC(osm) is the RBC volume in μm3 at a given osmolarity expressed in mOsm/l and VRBC(300) is the RBC volume at isotonic osmolarity osm = 300 mOsm/l. At glucose injection the local Hct decreases. If Hct before injection of glucose was 45% at osm = 300 mOsm/l, then at Cgl = 0.05 g/ml, osm = 580 mOsm/l and Hct = 32%; at Cgl = 0.1 g/ml, osm = 850 mOsm/l and Hct = 26%; and at Cgl = 0.2 g/ml, osm = 1400 mOsm/l and Hct = 22%. At further
increase of glucose concentration (0.3–1.0 g/ml), osm is constant and Hct = 21%, in spite of the linear increase of blood plasma osmolarity (2000–6000 mOsm/l).
Results of modeling of the scattering properties’ control for whole blood at its immersion (local intravessel injection) by a glucose solution at different concentrations accounting for the RBC packing function in the form F (Hct) = (1 − Hct) [see Eq. (1.170)], polidispersity [150 volume fractions of volume (size) distribution, Fig. 5.48], osmolarity, and hematocrit effects are presented in Fig. 5.49. The

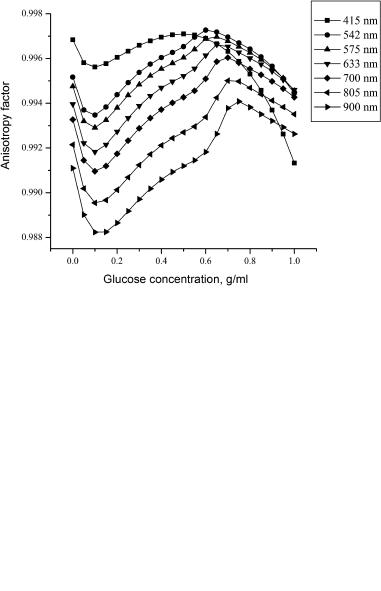
422 |
Controlling of the Optical Properties of Tissues |
(a)
(b)
Figure 5.49 Theoretical modeling of blood optical clearing at glucose intravessel injection. The calculated curves for the scattering coefficient (a) and scattering anisotropy factor (b) at glucose concentration in blood.1042 The initial blood hematocrit of 45% and RBC hemoglobin concentration of 322 g/l; 150 volume fractions of RBCs with different volume (size) in accordance with the RBC volume distribution function, which is presented in Fig. 5.48, were used in the modeling.
where osm is the plasma osmolarity under physiological condition (280–300 mOsm/l); CbpHb is the concentration of plasma hemoglobin, g/l; and MHb is the

Tissue Optics: Light Scattering Methods and Instruments for Medical Diagnosis |
423 |
molar mass of hemoglobin (MHb = 66500 g/M). The expected change of RBC volume calculated using empirical Eq. (5.37) is not more than 0.1%; at hemolysis, less than 20%. For simplicity, the polydispersity of RBCs can be taken into account on the basis of the six-fraction blood model given in Table 5.5,1111 which correlates with a more complete distribution given in Fig. 5.48.
Table 5.5 Size distribution of the equivalent spherical particles modeling RBC.1111
Volume fraction, % |
4 |
14 |
30 |
32 |
14 |
6 |
|
|
|
|
|
|
|
Radius, μm |
1.2 ± 0.2 |
1.7 ± 0.3 |
2.2 ± 0.2 |
2.7 ± 0.3 |
3.4 ± 0.4 |
4.3 ± 0.5 |
Calculations of the absorption coefficient, scattering coefficient, and anisotropy factor of whole blood at normal conditions and at local hemolysis have been performed using Eqs. (5.33)–(5.35) with the packing function F (Hct) = (1 − Hct)(1.4 − Hct). In contrast with the small changes of the absorption coefficient, more significant changes of the scattering properties of blood have been observed at an increase of free hemoglobin concentration in plasma. A rather spectrally smooth decrease of scattering coefficient for all wavelengths with free hemoglobin release at hemolysis was found.748 At a hemolysis rate of 20%, decrease of the scattering coefficient for both wavelengths 633 and 820 nm was calculated as 40%, while the anisotropy factor increases from 0.9940 to 0.9952 at 633 nm and from 0.9919 to 0.9929 at 820 nm.
The described method can be realized not only at blood hemolysis, but also at local free hemoglobin injection. Hemoglobin administration may also serve as a clearing agent for tissue clearing when clearing is needed in the spectral range far from the strong absorption bands of hemoglobin. On the other hand, the sensitivity of the scattering properties of blood to RBC hemolysis may be used for designing an effective optical technology for in vivo monitoring of blood hemolysis in vessels.
5.7.3 Cell studies
The optical immersion method is a valuable technique for studying refractive and scattering properties of living cells.150,175,749,953–955,1035,1112 For cellular refraction measurements, this technique has been in use since the 1950s.749,953,954 It has
been successfully used in combination with phase refractometry to study water and solids distribution in animal cells (mechanisms of cell cornification); mechanisms of animal cell motility connected with water redistributions; cell permeability, damage, and death; and the vitality and growth cycles of bacteria, fungi, yeasts, and spores. Some of the hematological applications of the immersion technique in cell suspensions studies are discussed earlier in Section 5.7.2.
In cell examination, the requirements of immersion agents should be somewhat different than in tissue optical clearing, where for many applications only
424 |
Controlling of the Optical Properties of Tissues |
cell damage is critical and the hyperosmotic property of agents provides one of the leading mechanisms for tissue clearing. In general, an immersion sub-
stance (IS) to be used for the refractometry of living cells should fulfill the following requirements:749,954
(1)The IS should be nontoxic and not affect the structure or function of living cells, i.e., chemically inert and not affecting any chemical components of a cell.
(2)It should be isotonic, i.e., not cause any changes of cell volume. Cell shrinkage or swelling induced by water displacement from a cell into the surrounding medium or vice versa are accompanied by the corresponding changes of cell refractive index; thus, the measured refractive index will not be a true value. The isotonic property is a biological character of a cell in solution that is connected with such physical characteristics of a solution as its isoosmotic property, but may not be similar. To provide isoosmotic and isotonic conditions, the IS should exert a low osmotic pressure; that is, it should consist of dissolved particles with high molecular weight and dimensions. For example, a water solution of bovine serum albumin (BSA) with an osmotic pressure of 10% is equivalent to a water solution of sodium chloride (NaCl) with a pressure of 0.08%.
(3)The IS should not penetrate the cell when the refractive index of a whole cell under study. Otherwise, at cell immersion in a medium with the higher refractive index, this substance diffuses inside the cell and equalizes the refractive indices inside and outside the cell, making the measured cell refractive index value far from a true value. Thus, for many cases, the IS should have a macromolecular structure to prevent cell permeability. However, for some specific cases, when intracellular organelles are under investigation, immersion agents with a controllable permeation can be used.
(4)The IS should be freely soluble in water so that the refractive index of the solution can be equal or exceed that of the part of the cell to be measured.
As for animal cells, the refractive index range is from 1.350 to 1.426 (see Table 2.6); and for bacterial cells, from 1.360 to 1.420.954 The IS refractive index values must be variable in these ranges with a step of 0.002–0.005. The best decision is to find two well-mixing solutions, one with the minimal index and another with the maximal index of the range under study. It is very important that for each of mixed solutions, the IS keeps its isotonic properties. Evidently, this condition can be satisfied if both solutions have a low osmotic pressure and their mixing is not accompanied by a specific chemical reaction causing increase of osmotic pressure.
(5)The IS should be optically transparent and isotropic, i.e., conditions of less absorption and scattering in the measuring wavelength range as well as less linear birefringence and chirality should be provided.
(6)The IS should be stable in the range from room temperature to physiological temperatures, and their optical properties should not change during prolonged storage.
Tissue Optics: Light Scattering Methods and Instruments for Medical Diagnosis |
425 |
Such requirements are fulfilled most completely for water solutions of albumin and water-glycerol gelatinous gels.749,954 The fifth fraction of bovine or human
serum albumin contains a total mass of serum albumin and about 3% of α-globulin, and less than 0.5% of β-globulin,954 and its index of refraction has a linear dependence on concentration with an increment of βp = 0.00185 [Eq. (2.31)]. For high concentrations, some discrepancy from linearity is seen that is possibly connected with their relatively high viscosity. For microbiological studies, protein solutions are usually prepared with the refractive index range from 1.360 to 1.420 with the interval of 0.002 on the basis a 0.5–0.6% solution of NaCl in a distilled water.954
The water-glycerol gelatinous gels are applicable when cell motility does not allow one to provide precise measurements using protein solutions.954 Such gels fix and immobilize cells, preserving their vitality; they are optically transparent with low birefringence and high stability of optical properties, if correctly exploited, and have low osmotic pressure. Isotonic gel kits for studies are prepared by the dilution of concentrated salt-free and purified gelatinous gels with a turbidity of 0.5 × 10⁻³ cm−1 in a 0.2% sterile solution of glycerol in a 0.5% solution of NaCl with pH 7.0–7.2; other compositions with 1%-glycerol, 1%-glycerol, and 0.5%-glucose, or 10%-saccharose can also be used. Using protein solutions and gelatinous gels as immersion substances and phase-contrast microscopy with effective suppression of the background light, refractive indices of numerous bacteria of such families as Coccaceae, Bacteriaceae, Bacillaceae, Spirillaceae, and
Proactinomycetaceae have been measured.954 On the basis of refraction measurements, the concentration of dry materials and water in bacterial cells, their density, and bacterial growth cycle, as well as rehydration of lyophilized bacterial cells and hydration of spores, were studied. The differentiation between vital and dead cells in lyophilized cell preparations and percentage of vital spores were also determined.
The optical clearing effect can be most easily demonstrated by analyzing phase microscope images of bacterial cells that contain only a cytoplasm and a membrane.954 If a biological object is homogenous, matching its refractive index value with that of the host medium will make it optically invisible. In the case of a bacteria containing only a cytoplasm and a membrane, matching the refractive index of the cytoplasm with that of the extracellular fluid will make the image of the cytoplasm disappear and sharply enhance the brightness of the optical image of the membrane. In a case where the refractive index of the extracellular fluid is externally controlled by the administration of an appropriate chemical agent, the disappearing cytoplasm and the sharp enhancement of the membrane brightness can be used as an efficient method of measuring of the refractive index of the cytoplasm and monitoring of cell vitality. Figure 5.50 illustrates the optical clearing effect.
The finite-difference time-domain (FDTD) approach was recently suggested as
a promising tool for a more detailed study of the optical clearing effect in cells and its possible applications.1053,1054 In Refs. 1053 and 1054, the 3D and 2D FDTD
simulation results of light transmission through a biological cell that contain only
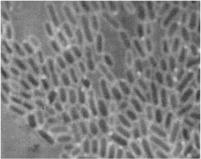
426 |
Controlling of the Optical Properties of Tissues |
Figure 5.50 Effect of the extracellular fluid on cytoplasm refractive index matching on a phase-contrast microscope image of dysentery bacteria cells. There is a sharp enhancement of the membrane brightness. (Ref. 954, p. 70)
cytoplasm and membrane are presented. The calculated 2D distributions and two cross sections of phase of the Ez component of the forward-scattered light through a biological cell in the near field are shown in Fig. 5.51. It is clearly seen that refractive index matching (graphs on the right) significantly enhances the phase contrast of the cell membrane as it follows from the experimental data of Fig. 5.50. The intensity of phase microscope images is directly proportional to the phase accumulated by the light beam after its propagation through the cell. Calculations were done for typical parameters of a microbial cell: the diameter of the cell, 1.44 μm, and the thickness of the membrane, 0.06 μm; the refractive index of the cytoplasm, 1.36, and of the membrane, 1.47. In calculations, the FDTD cell size was taken as 0.02 μm and the extracellular fluid refractive index values were 1.33 for no refractive index matching and 1.36 for refractive index matching conditions.
Experimentally determined ratios of the scattering intensities from cells (rat fibroblast cell clone MR1, 105 cells/ml) immersed in media of low and high indices of refraction are presented in Ref. 150. As a medium with a low index of refraction n = 1.332, phosphate buffer saline (PBS) was used in both cases. The media of higher index had n = 1.345 [bovine serum albumin (BSA) in PBS] and n = 1.343 (ovalbumin in PBS). The scattered light intensity at small angles (<20 deg) was significantly greater when the cells were immersed in PBS with a low refractive index than when they are immersed in a protein solution with a higher index. Thus, it may be concluded that there is significant scattering at small angles from cell structures that are in contact with the IS. However, at larger angles (>40 deg), the effect of increasing the index of refraction of IS on light scattering is much smaller. Following estimations of authors of Ref. 150, the percentage of light scattering from internal cellular structures can be determined. Accounting for the fact that the ratio of scattering intensity from cells suspended in IS with low and high indices for angles above 40 deg is 1.3, the fraction of scattering intensity from particles internal to the cell can be estimated. The scattering intensity in IS with low refraction is given by Inc + Ic, where Inc and Ic are the intensities of scattering from structures not in contact with and in contact with the IS, respectively. In the IS with high refraction, the scattering from the particles in contact with the IS
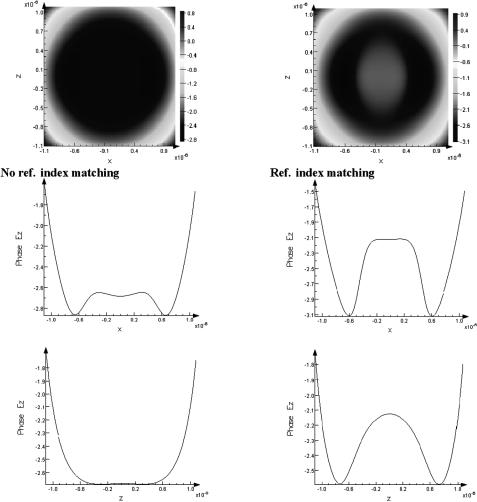
428 |
Controlling of the Optical Properties of Tissues |
5.8 Applications of the tissue immersion technique
5.8.1 Glucose sensing
Noninvasive and continuous monitoring of glucose concentration in blood and tissues is one of the most challenging and exciting applications of optics in medicine. The major difficulty preventing development and clinical application of a noninvasive blood glucose sensor is associated with the very low signal produced
by glucose molecules. This results in low sensitivity and specificity of glucose monitoring.105,138
The concept of noninvasive blood glucose sensing using the scattering properties of blood as an alternative to spectral absorption and polarization methods105,534
for monitoring physiological glucose concentrations in the blood of diabetic pa-
tients is under intensive discussion.339–341,534,549–551,631,752–754,957,985,1018,
1019,1113–1115 Many of the effects considered in Section 5.7.2, such as RBC size, refractive index, packing, and aggregation, changed under glucose variation are important for glucose monitoring in diabetic patients. Indeed, at physiological concentrations of glucose ranging from 40 to 400 mg/dl, the role of some of the effects may be changed, and some other effects, such as the rate of glu-
cose penetration inside the RBCs and the followed hemoglobin glycation, may be important752–754,985,1116 (see Section 2.11 and Fig. 2.14).
Noninvasive determination of glucose was attempted using light scattering of skin tissue components measured by a spatially resolved diffuse reflectance341,1114
or NIR frequency-domain reflectance techniques.339 Both approaches are based on change in glucose concentration, which affects the refractive index mismatch between the interstitial fluid and tissue fibers, and hence μs. A glucose clamp experiment (the concentrations of injected glucose and insulin are manipulated to result in a steady concentration of glucose ever a period of time534) showed that δμs at 650 nm qualitatively tracked changes in blood glucose concentration for the volunteer with diabetes studied (Fig. 5.52).341 The distances between the source and detector fibers were in the range rsd = 1–10 mm, which corresponds to the approximate 0.5–5 mm in tissue upon which μs is determined. Drift in μs that was independent of glucose prevented statistical analysis and was attributed by the authors to other physiological processes contributing to δμs.341 Changes in μs did not exclusively result from changes in the refractive index of the interstitial fluid caused by increased glucose concentration. The spatially resolved reflectance measurements (at 800 nm and rsd = 0.8–10 mm) and oral glucose tolerance test were done to study five healthy volunteers and 13 volunteers with type 2 diabetes using a probe continuously attached to the abdomen.1114 For volunteers without diabetes, 80% of the measurements showed tracking between δμs and blood glucose concentration, and the other 20% showed no correlation. For volunteers without diabetes, 73% of the measurements resulted in calibration models for μs versus blood glucose concentration. A poor correlation between measured δμs and glucose concentration in these experiments may be connected with a sensitivity to the probe
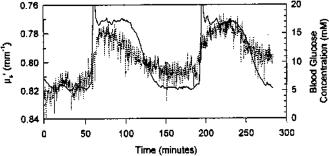
Tissue Optics: Light Scattering Methods and Instruments for Medical Diagnosis |
429 |
used having a large probing depth on the vascular effect of glucose that induces temporal variations of the blood flow in the skin and subcutaneous tissue.534
Figure 5.52 Reduced scattering coefficient at 650 nm (dots) and blood glucose concentration (solid curve) measured on a volunteer with insulin-dependent diabetes mellitus during a double clamping experiment.341 A multichannel CCD-based spatially resolved fiber-optic back-reflectance spectrometer and neural network software were used to measure and extract the optical properties. Reflectance measurements were collected at 15-s intervals for5 h, and skin and room temperature were monitored throughout the course of the experiment; the volunteer remained as still as possible, and food and drink were not permitted.
The response of a nondiabetic male subject to a glucose load of 1.75 g/kg body weight, as a standard glucose tolerance test, was determined while continuously monitoring the product of nμs measured on muscle tissue of the subject’s thigh using a portable frequency-domain spectrometer (Fig. 5.53).339 The refractive index n of the interstitial fluid modified by glucose is defined by Eq. (2.36). As the subject’s blood glucose rose, nμs decreased. Figure 5.53(b) shows the correlation plot obtained from the data of Fig. 5.53(a). The correlation plot fits well to a simple physical model based on the Rayleigh-Gans approximation and accounts for the refractive index matching concept. Key factors for the success of this approach are the precision of the measurements of the reduced scattering coefficient and the separation of the scattering changes from absorption changes, as obtained with the NIR frequency-domain spectrometer.339 Evidently, other physiological effects related to glucose concentration could account for the observed variations of μs and, as it was mentioned earlier, the effect of glucose on the blood flow in the tissue may be one of the sources of the errors at μs measurements.
So-called occlusion spectroscopy is an approach that is based on light scattering from RBCs.534,1018,1019 This method suggests a controlled occlusion of finger
blood vessels to slow blood flow in order to provide the shear forces of blood flow to be minimal and thus to allow RBCs to aggregate. Change in light scattering upon occlusion is measured. Occlusion will not affect the rest of the tissue components, while the scattering properties of aggregated RBCs differ from those of the nonaggregated ones and from the rest of the tissue. As it was already discussed, a change in glucose concentration affects the refractive index of blood plasma and hence affects blood light scattering at occlusion due to refractive index
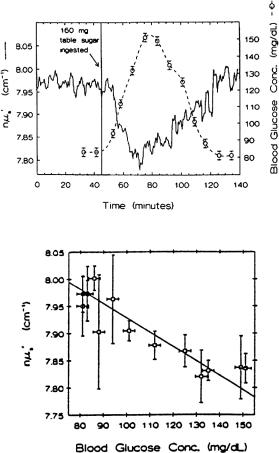
430 |
Controlling of the Optical Properties of Tissues |
(a)
(b)
Figure 5.53 Glucose tolerance test performed on a human subject with a portable fre- quency-domain (120 MHz) NIR (850 nm) spectrometer.339 (a) At time t = 45 min, the subject ingested a glucose load of 160 g of table sugar (1.75 g/kg body weight); the solid curve is the measurements of nμs on the thigh of the subject, n is defined by Eq. (2.36); the open circles indicate blood glucose concentration as determined by a home blood glucose monitor; the data acquired every 30 s were averaged in sets of five to produce the plot. (b) The correlation corresponding to (a) between the measured blood glucose and product nμs averaged over a time of 2.5 min centered on the time the finger was lanced for the measurement. The error in nμs is the standard deviations of the five measurements averaged to get a single point. The error in the blood glucose concentration is estimated to be ±2.5 mg/dl. The solid line is the theoretical result according to the Rayleigh-Gans model.
match/mismatch between aggregates and plasma. Occlusion spectroscopy differs from that of spatially resolved reflectance and frequency-domain measurements in that it proposes measurements of glucose in blood rather than in the interstitial fluid. The occlusion spectroscopy method was tested in a human study using a hyperinsulinemic-hypoglycemic clamp.1019 This technique offers the potential of directly measuring the change in the refractive index of blood plasma; but in clini-
Tissue Optics: Light Scattering Methods and Instruments for Medical Diagnosis |
431 |
cal studies, many other factors affecting the scattering of RBCs and their aggregates should be accounted for: (1) the complexity of the RBC aggregation phenomenon
and its dependence on glucose concentration and other pathological conditions and diseases;534,1103,1105 (2) the effect of glucose on the shape and structure of RBCs.
OCT can be proposed for noninvasive assessment of glucose concentration in tissues.534,549–551,1113,1115,1117 The high resolution of the OCT technique may al-
low high sensitivity, accuracy, and specificity of glucose concentration monitoring due to the precise measurements of glucose-induced changes in the tissue optical properties from the layer of interest (dermis). Unlike the diffuse reflectance method, OCT allows one to provide depth-resolved qualitative and quantitative information about tissue optical properties of the three major layers of human skin: the dead keratinized layer of squames (stratum corneum of epidermis); the prickle cells layer (epidermis); and the connective tissue of dermis. Dermis is the only layer of the skin that contains a developed blood microvessel network. Since glucose concentration in the interstitial fluid is closely related to the blood glucose concentration, one can expect glucose-induced changes in the OCT signal detected from the dermis area of the skin. Two methods of OCT-based measurement and monitoring of tissue glucose concentration were proposed: (1) monitoring of the
tissue scattering coefficient μs as a function of the blood glucose concentration using standard OCT;549–551 (2) measurement of glucose-induced changes in the re-
fractive index n using a novel polarization-maintaining fiber-based dual-channel phase-sensitive optical low-coherence reflectometer (PS-OLCR).1113
Experiments were performed with a portable OCT system with the central
wavelength of 1300 nm, power of 0.5 mW, and coherence length and lateral resolution of approximately 14 μm and 12 μm, respectively.549–551,1117 The authors
reported results obtained from phantom (aqueous suspension of polystyrene microspheres and milk), animal (27 New Zealand rabbits and 13 hairless Yucatan micropigs), and human (20 healthy volunteers in 24 experiments) studies. OCT images were obtained from skin (ear of the rabbits, dorsal area of the micropigs, and arm of the volunteers). The slopes of the OCT signals were calculated at a depth of 150–900 μm. Glucose administration was performed using: (1) intravenous bolus injections for rapid increase of blood glucose concentration and (2) an intravenous clamping technique for slow, controlled changes of the blood glucose concentration in animal studies; and (3) the standard oral glucose tolerance test (OGTT) in human studies. Blood samples were analyzed using OneTouch (Lifescan Inc., Milpitas, CA), HemoCue (Ryan Diagnostic, Inc., Naperville, IL), and Vitros 950 (Ortho-Clinical Diagnostics, Inc., Raritan, NJ) blood glucose analyzers.
First, an OCT image of the layers of skin is taken and the OCT signal as a function of depth is evaluated. The slope of the portion of the plot in the dermis layer is used to calculate μs. In an anesthetized animal skin experiment, OCT images demonstrate that glucose affects the refractive index mismatch in skin and decreases μs.1117 The slope of the OCT signal versus depth line is determined and is correlated with the concentration of blood glucose (Fig. 5.54).
Typical results obtained in the clinical studies are shown in Fig. 5.55. OCT images and blood samples were taken from the left and right forearm, respectively.

432 |
Controlling of the Optical Properties of Tissues |
Figure 5.54 Representative OCT signals obtained from Yucatan micropig skin during a glucose clamping experiment at low and high blood glucose concentration (top) and a part of the OCT signal in the dermis area with the linear fit of the OCT signals in this layer (bottom).551
Good correlation between the increase of the blood glucose concentration and decrease of the smoothed OCT signal slope has been observed at the depth of 200– 600 μm during OGTT. Measurements performed in layers of epidermis and upper dermis either did not show changes in the OCT signal slope at variations of blood glucose concentration or the changes were very weak. Most likely, it is due to a gradient of glucose concentration from dermal blood microvessels to the SC. Thus, the sensitivity and accuracy of the OCT measurements of blood glucose concentration would be maximal in the regions of a developed blood microvessel network (that is, the dermis area).
A comparison of results obtained from the skin of rabbit ear during bolus glucose injection experiments and the skin of a micropig during glucose clamping showed that the OCT signal slope changed approximately 8%/mM during the bolus glucose injection experiment and 2%/mM during glucose clamping. That suggests the possibility of a tissue physiological response to the sharp increase of analyte concentration in the interstitial fluid during bolus glucose injection experiments.
The results obtained in phantoms, animals, and clinical studies demonstrated the potential of the OCT technique to detect small glucose-induced changes in scattering coefficient of the turbid media with high accuracy and sensitivity. However, additional studies should be performed on: (1) the reduction of noise associated with speckles and tissue inhomogeneity, (2) development of algorithms and methods for compensation of motion artifacts, and (3) approbation of the system in clinical studies involving diabetic patients. Although OCT-based glucose sensors most
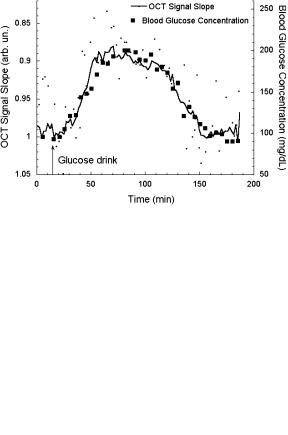
Tissue Optics: Light Scattering Methods and Instruments for Medical Diagnosis |
433 |
(a)
(b)
Figure 5.55 Slope of OCT signal and blood glucose concentration versus time. OCT images and blood samples were taken from the human skin of the (a) left and (b) right forearm during an OGTT.550
likely may need calibration with invasive glucose sensors, they may dramatically reduce the number of invasive measurements and provide continuous monitoring of the blood glucose concentration.
A question of the specificity of the OCT technique to monitor blood glucose concentration in tissues has been addressed.551 Experimental and theoretical analyses of the influence of several physical and physiological parameters (such as altering the refractive index mismatch between the interstitial fluid and scattering centers, and structural modifications in tissue due to changes in glucose concentration) on the OCT signal slope were performed. Results obtained demonstrate that:
(1) several body osmolytes may change the refractive index mismatch between the interstitial fluid and scattering centers in tissue (however, the effect of the glucose is approximately one to two orders of magnitude higher); (2) an increase of the interstitial fluid glucose concentration in the physiological range (3–30 mM) may decrease the scattering coefficient by 0.22%/mM due to cell volume change;
434 |
Controlling of the Optical Properties of Tissues |
(3) the stability of the OCT signal slope is dependent on tissue heterogeneity and motion artifacts; and (4) moderate skin temperature fluctuations (±1◦C) do not decrease the accuracy and specificity of the OCT-based glucose sensor [however, substantial skin heating or cooling (several degrees) significantly change the OCT signal slope]. These results suggest that the OCT technique may provide blood glucose concentration monitoring with sufficient specificity under normal physiological conditions.
A new differential phase-contrast OCT-based method (PS-OLCR) of monitoring glucose-induced changes in tissue optical properties has been also proposed.1113 While conventional OCT uses the detection and the analysis of intensity of backscattered optical radiation, phase-sensitive OCT utilizes the phase information obtained by probing a sample simultaneously with two common-path lowcoherence beams. Variations in the sample refractive index are exhibited in the phase difference ϕ between these two beams. The PS-OLCR technique is capable of measuring angstrom/nanometer-scale path length changes between the beams [associated with the phase difference (λ/4π) ϕ] in clear and scattering media. The theoretical and experimental pilot studies on the application of PSOLCR for noninvasive, sensitive, and accurate monitoring of analyte concentration were reported by the authors of Ref. 1113. They studied concentration-dependent changes of phase, dϕ/dC, and refractive index dn/dC in aqueous solutions of glucose, CaCl2, MgCl2, NaCl, KCl, KHCO3, urea, bovine serum albumin (BSA), and globulin in clear and turbid tissuelike media. The obtained results demonstrate:
(1) good agreement between refractive indices measured with the PS-OLCR technique and the conventional white-light refractometer, as previously reported in the literature for the visible spectral range; (2) the effect of glucose on dn/dC is approximately one to four orders of magnitude greater than that of other analytes at the physiological concentrations; (3) good agreement between results obtained in translucent and scattering media, suggesting PS-OLCR could be applied for in vivo measurements; and (4) high sub-mM sensitivity of PS-OLCR for measurement of glucose concentration.
Like other scattering techniques, the detected phenomenon in OCT is the effect of glucose on the refractive index of the interstitial fluid. However, it does not allow for blood circulation and temperature changes. Unlike the spatially resolved back-
reflectance and frequency-domain methods that use larger measuring volumes and span multiple layers in tissues,339–341,534,1114 OCT offers a certain advantage be-
cause it limits the sampling depth to the upper dermis without unwanted signals from other layers. Precise sampling is very important at glucose monitoring in tissue because glucose uptake is different in different tissue layers, being the lowest in connective tissue and smooth muscle, and highest in adipose tissue and skeletal muscle.1118 Besides, when blood glucose changes rapidly, there is a time lag of 10–25 min, resulting in a transient difference between the blood and subcutaneous glucose concentrations, which should be accounted for.1118
It is important that blood glucose concentrations alter thermally modulated optical signals from skin.534,996 This is due to some physiologic and physical ef-
Tissue Optics: Light Scattering Methods and Instruments for Medical Diagnosis |
435 |
fects induced in temperature-modulated skin—the temperature modulation affecting mostly cutaneous vascular circulation (physiological effect), and the change of glucose concentration affecting mostly cutaneous light scattering (physical effect).
A device based on the thermo-optical response of human skin was used to collect signals from the forearm of volunteers.681,996 Glucose concentrations were cor-
related with temperature-modulated localized reflectance signals at wavelengths between 590 and 935 nm. There are no known NIR glucose absorption bands in this range; thus, μa is mostly defined by blood absorption, reflecting hemodynamic changes in cutaneous tissue. Evidently, μs is a measure of the refractive index mismatch between the interstitial fluid (ISF) and tissue connective fibers.
Localized reflectance data were collected continuously over a 90-min period of
probe–skin contact as temperature was repetitively stepped between 22 and 38◦C for 15 temperature modulation cycles.534,996 Each cycle comprised the following
steps: skin was equilibrated for 2 min at a probe temperature of 22◦C, and the temperature was raised to 38◦C over the course of 1 min, maintained for 2 min, and then lowered to 22◦C over a 1-min period. At each temperature limit (during the 2-min window), four optical data packets were collected and values of μa and μs were determined. Temperature modulation between 38 and 22◦C caused a periodic
set of cutaneous refractive index and vascular changes, leading to periodic changes in skin reflectance.534,996 A four-term linear least-squares fitting of glucose to the
reflectance data was used,
[glucose] = a0 + i ai [Ri (r, λ, T )]. |
(5.39) |
The reflectance parameter R (r, λ, T ), as defined by Eq. (5.39), |
is equal to |
loge R(r, λ, T ), where R(r, λ, T ) is the measured localized reflectance at temperature T . Thirty-two sequences of R (at T22◦C) = loge R(r, λ, T22◦C) and R (at T38◦C) = loge R(r, λ, T38◦C) were used in the linear least-squares correlation.
For each meal tolerance test (MTT) over the 2-hr period, the temperature sequences encompassed 20 data points.534,996 The correlation between glucose values and
optical signals in this spectral range was attributed to the effect of glucose on the refractive index and on the cutaneous hemodynamic response; the correlation coefficient was in the range from 0.69 to 0.94 for two volunteers tested for six days each.
The thermo-optical response method offers certain compartmentalization ad-
vantages over localized reflectance measurements that use large source-detector separations339–341,1114 because it limits the sampling depth to the dermis by virtue
of the probe design (short source-detector separations) and the use of temperature control.
5.8.2 Precision tissue photodisruption
Femtosecond laser pulses can generate high-precision subsurface photodisruption in transparent tissues such as cornea.788 The strong optical intensities required for photodisruption can be achieved at the focus of a high peak power laser beam. The
436 |
Controlling of the Optical Properties of Tissues |
location of optical breakdown can be controlled to occur only at the focus of the beam, where the intensity exceeds the threshold level of breakdown. If the laser is focused beneath the surface of a tissue, subsurface breakdown occurs only at the focus. No damage takes place in the tissue layers that the beam was focused through. In contrast to transparent tissues, turbid tissues scatter light, spreading the pulse in both space and time, and making it difficult to maintain the tight focus and short pulse duration needed for well-confined photodisruption.788 The same problems
are characteristic for nonlinear spectroscopy, including multiphoton fluorescence microscopy and SHG imaging.609–618,945–947,997,1119
The ability to focus light through turbid tissue is limited, especially at wavelengths less than 1300 nm. Tissue optical clearing technology using an appropriate immersion agent can be applied for a temporal reduction of scattering needed for providing an effective nonlinear study or underlying tissue photodisruption. In particular, a femtosecond laser technology was used to demonstrate early proof of a concept for high-precision subsurface photodisruption in the translucent human sclera.788 Approximately 5-mJ femtosecond pulses from two laser sources, 1060 nm (500 fs) and 775 nm (150 fs) with a repetition rate of 1 kHz, were used to make subsurface incisions in sclera in vitro. The beam was focused to a 1.5 (775 nm) or 5 μm (1060 nm) spot size and scanned below the tissue surface at various depths to produce incision patterns.
Tissue samples were impregnated by hypaque-76 (x-ray contrast) to make them transparent, usually within 15 min. The measured axial transmission spectra of normal scleral tissue and treated with hypaque-76 (the light forward-scattered in a small cone angle around the incident beam was detected), as well as saline and hypaque-76 spectra, are presented in Fig. 5.56. As it seen, transmission of normal sclera is never greater than 10%, with a broad maximum at 1600–1800 nm. For sclera treated by hypaque-76, the transmittance greatly increases across the entire spectrum, especially for wavelengths in the NIR region from 800 to 1350 nm. A transparent window is also created between two strong water-absorption bands, from 1500 to 1800 nm. Transmission at 775 and 1060 nm is above 60%.
The difference in transmission is not expected to affect the results of photodisruption itself because photodisruption depends on the intensity of the pulse and not the linear absorption. Thus, spectral windows with less scattering and absorption allow for a focused beam to penetrate into a tissue with less attenuation and distortion, and do not influence photodisruption efficiency.
As expected, at 775 nm, the size of the intensity distribution emerging from the normal sclera did not change on the position of the focusing lens, since scattering is very strong. The emergent beam is many times larger than the unscattered spot and is strongly speckle modulated (see Fig. 5.8).343 At a longer wavelength, 1060 nm, due to less scattering, the distribution is smaller, but still heavily scattered. Therefore, focusing to the back surface of the tissue is not possible using these wavelengths; thus, for the normal scleral, tissue breakdown was only possible at the front surface first.788 After treating the tissue with hypaque-76, the spot size decreases to almost that of the unscattered beam for both wavelengths; thus,
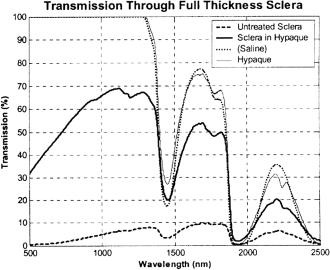
Tissue Optics: Light Scattering Methods and Instruments for Medical Diagnosis |
437 |
Figure 5.56 Transmission spectra of normal and human scleral samples treated by hy- paque-76 along with saline and hypaque-76.788 All samples were approximately 0.5-mm thick.
the strong focusing of the beam should permit controlled back-surface photodisruption. Several types of intrascleral incisions were experimentally demonstrated using optical clearing technology, such as: partial thickness channel creation that could be used to perform a transscleral procedure analogous to deep sclerotomy, where a block of inner surface sclera is removed with minimal disruption to overlying layers, or in altering the mechanical properties of the sclera for the treatment of presbyopia; full thickness channel creation that may be useful for draining aqueous for the treatment of glaucoma; creation of a grid of tissue pores that may be useful in changing the bulk properties of the tissue, including the tissue’s hydraulic conductivity; and scleral pocket creation that may be useful for inserting implants to treat presbyopia.788
5.9 Other techniques of tissue optical properties control
5.9.1 Tissue compression and stretching
As it was already mentioned in Section 5.1, squeezing (compressing) or stretching of a soft tissue produces a significant increase in its optical transmission.951 The major reasons for that are the following: (1) increased optical tissue homogeneity due to removal of blood and interstitial fluid from the compressed site [see
Eq. (2.24)], (2) closer packing of tissue components causes less scattering due to cooperative (interference) effects (see Chapters 1 and 3),442,950 and (3) less tis-
sue thickness. Mechanisms underlying the effects of optical clearing and changing of light reflection by soft tissues at compression and stretching were pro-
438 |
Controlling of the Optical Properties of Tissues |
posed in a number of theoretical and experimental studies.61,62,442,575,580,667,692,
722,723,950,992,1005,1013
It should be emphasized, however, that squeezing-induced effects in tissues that contain little blood, such as sclera, are characterized by a marked inertia (for a few minutes) because of the relatively slow diffusion of water from the compressed region.723 It was suggested that compression of sclera may displace water from the interspace of collagen fibrils, increasing the protein and mucopolysaccharide concentrations. Since these proteins and sugars have refractive indexes closer to that of the collagen fibrils, a more index-matched environment can be created. On the other hand, compression reduces specimen thickness d, which might increase the effective scatterer concentration inside the tissue.667 Therefore, compression may also give rise to an increase in tissue scattering coefficient μs. However, the total effect on the change of optical properties, which is proportional to the product of μsd, is characterized by less scattering.
Sometimes the increase in scatterer concentration is likely to be more dominant than the reduction in index mismatch.667 In addition, reduction of tissue thickness causes an increase in local chromophore concentration (for bloodless tissue, or tissue specimens that have aggregated and/or coagulated blood), i.e., the absorption coefficient increases. The authors of Ref. 667 observed that compression caused leaking around the specimen. Some of the extracellular fluids along the edge of the tissue sample were forced out upon compression. Unless sufficient pressure was applied to rupture the cell walls, the intracellular fluids would be retained by the cells at the bulk of the sample. When compressed, the tissue thickness was reduced and so the volumetric water concentration was increased. This may explain the increase of the absorption coefficient at the wavelengths of water bands with compression. The authors of Ref. 667 have studied the optical properties in vitro of human skin, bovine aorta, bovine sclera, and porcine sclera in the spectral range from 400 to 1800 nm, using the integrating sphere technique and inverse addingdoubling method for the convolution of absorption and reduced scattering coefficients. The diffuse reflectance and transmittance of these tissue samples of about 2 × 2 cm were measured at no pressure and at pressures of 0.1, 1, and 2 kg/cm2 uniformly distributed over the sample surface. They generally observed a decrease in reflectance, while the transmittance, absorption, and scattering coefficients increased owing to compression. Some of these data for human skin are presented in Table 2.1. As was explained earlier, the amount of scattering depends on the refractive index mismatch, as well as on scatterer concentration and spacing. Along the load direction, the spacing between tissue components is reduced and, due to water escaping from the compression site, refractive index matching should occur; both effects decrease the averaged light scattering (transmittance increases and reflectance decreases). On the other hand, compression reduces specimen thickness, which might increase the effective scatter and chromophore concentration inside the tissue. In experiments with a uniformly distributed compression, the scatter concentration increase was likely more dominant than the reduction in index mismatch and scatterer packing affect. It should be noted that the relative balance
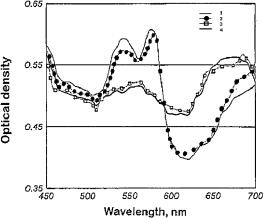
Tissue Optics: Light Scattering Methods and Instruments for Medical Diagnosis |
439 |
of the contributions of the listed mechanisms is expected to be changed if a pointwise compression is applied.266,267,723 To understand the optical properties of com-
pressed tissue, time-resolved studies in the range of minutes are important.723 Spectral properties of skin can be effectively controlled by applying an exter-
nal localized pressure in in vivo experiments when UV-induced erythema (skin redness) is developed.575,580,991 Figure 5.57 shows the apparent optical density
(OD) evaluated from the in vivo measured back-reflectance spectra of erythematous human skin for different values of external localized mechanical pressure. On the third day after UV irradiation, erythema develops and is exhibited as increased absorbance (OD) in the 520–580 nm spectral range due to increased blood volume blood volume in the skin. Blood hemoglobin blocks the backscattered intensity from the deep skin layers. For the longer wavelengths from 600 to 700 nm, increased blood volume causes an increase in light scattering from tissue, which is seen as an increase of the apparent OD. At pressures of (8.4–14) × 105 Pa, blood is leaving the compressed area of the skin; thus, OD spectral dependence becomes smoother due to less absorption in the range 520–580 nm and less scattering in the range 600–700 nm.
Figure 5.57 The apparent optical density (OD) spectral distridutions of erythematous human skin (three days after UV irradiation) for different values of external mechanical pressure: (1) without pressure; (2) 5.6 × 10⁴ Pa; (3) 8.4 × 10⁴ Pa; (4) 1.4 × 10⁵ Pa.575,991
The intensity of skin autofluorescence is also well controlled at external localized pressure applied to the skin site. As it follows from Fig. 5.58, the external localized pressure in the range from 0 to 1.4 × 10⁵ Pa changes the fluorescence output considerably with the wavelength of 460 nm at induced erythema. Due to more effective fluorescence light attenuation by blood hemoglobin at more intensive erythema (14 days after UV irradiation), skin compression more effectively controls (increase) fluorescence output.
As it was also shown, the application of a pressure cuff to the upper arm of healthy volunteers at levels of 0-, 20-, 30-, 40-, and 60-mm Hg did not signifi-
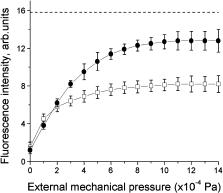
440 |
Controlling of the Optical Properties of Tissues |
Figure 5.58 Autofluorescence (AF) intensity of erythematous human skin (λf = 460 nm) with dependence on external mechanical pressure: (1) 7 days after UV rradiation (less developed erythema); (") 14 days after UV irradiation (more developed erythema). The AF intensity of human skin without erythema and compression (dotted line) is marked as a reference value.575,580
cantly alter the levels of oxyhemoglobin or melanin of preliminary UV-irradiated volar forearm skin (induced erythema and melanin pigmentation).1005 In contrast, deoxyhemoglobin significantly contributes to the skin color appearance. Blood pooling, expressed as increased deoxyhemoglobin, can contribute to what is visually perceived as pigmentation. Oxyhemoglobin values increased to a maximum on the first day after UV irradiation, correlating well with the clinical evaluation of erythema, and then decreased exponentially to baseline. Melanin contents showed a significant increase on the seventh day and remained relatively constant for the next three weeks, correlating well with the clinical evaluation of pigmentation (tanning). Deoxyhemoglobin increased slightly on the first day and remained elevated for the next two weeks. Thus, it correlated moderately well with the clinical erythema scoring on day 1 only, while it contributed significantly to what is clinically perceived as skin tanning on days 7 and 14. Application of pressure below the diastolic level increased the deoxyhemoglobin concentration as measured by diffuse reflectance spectroscopy. This increase corresponded to a decrease of a “pigmentation” parameter in a similar fashion to that which has been documented for increases in melanin concentration. Topical application of H2O2 reduced deoxyhemoglobin levels as measured by reflectance spectroscopy. This reduction coincided kinetically with a visible skin blanching.
The light propagation in human skin at mechanical tension was studied in vivo using a steady-state diffuse reflectometry with a variable source-detector separation rsd.692 To examine the effect of skin tension on the optical properties, the skin was maintained in a stretched position by pulling it mechanically in a defined direction and then fixing it to an aluminum ring with double-sided adhesive tape. For medium and far distances of the detector from the light source (rsd = 2 and 7 mm), it was found that anisotropy of light propagation followed the stretching direction. The direction of stretching complies with that of the maximal reflectance signal
Tissue Optics: Light Scattering Methods and Instruments for Medical Diagnosis |
441 |
for a given distance greater than about 2 mm. Thus, the scattering coefficient is minimal when measured along the direction of stretching because the intensity is maximal for the distant detector. MC modeling that accounts for the anisotropy of the scattering coefficient, caused by different photon interaction with the medium when it was traveling along the tissue fibers and across them and described by Eq. (2.20) with the fraction of scatterers (cylinders) oriented in the preferential direction, f = 0.35, was also done.692 As it follows from Eq. (2.20), the scattering cross section varies with the direction cosine of the incident photon with respect to the axis of the cylinder. It is maximal for perpendicular incidence and is minimal for parallel incidence. The MC modeling has demonstrated that for short sourcedetector separations, the detected signal is much higher (scattering coefficients are also higher) for the perpendicular direction regarding the preferential direction of the collagen fibers. For farther detectors, the signal is higher in the parallel direction (scattering coefficient is lower). Such correlated or anticorrelated dependences between the intensity back-reflectance and the scattering coefficient, respectively, for short and long source-detector separations also follow from the data in Fig. 5.27.
From this analysis it follows that at skin stretching, the scattering coefficient and corresponding light back-reflectance and transmittance can be effectively controlled. On the other hand, intact skin has its own anisotropy, which is believed to be caused by the preferential orientation of collagen fibers in the dermis, as described by Langer’s skin tension lines.692 Thus, the human skin’s reduced scattering coefficient varies by a factor of two between different directions of light propagation at the same position (see Table 2.1). At external forced tension, more significant damping of scattering along the direction of mechanical stress is expected.
The measurements of the deformations and applied loads, along with the estimating of the biomechanical properties of tissue, are critical to many areas of the health sciences, including monitoring of the tension in wound closures, skin flaps, and tissue expanders.1013 Such measurements, which can be provided by detection of the polarized light reflectivity, will allow surgeons to treat wounds more successfully by minimizing scar tissue and maximizing the speed of treatment by letting them know how much the skin can be stretched at each treatment step. In vivo human experiments showed that the specular reflection from skin changes with stretch.1013 For small values of stretch, the specular reflectivity measured for a HeNe laser (λ = 633 nm) beam with a 45-deg angle of incidence increases linearly with strain. The linear relationship between applied stretch and polarized reflectivity can be understood if the skin surface is approximated by a sinusoidal profile in the resting stage. Stretching reduces the amplitude and increases the spatial scale of the skin profile, thereby making it smoother and flatter, resulting in a corresponding increase of reflectivity. For ten tested subjects with various skin complexions, the slope of the dependence of the reflectivity (normalized to a maximal value) on strain (expressed in percents) is in the range from 0.0074 to 0.0391 (1/%) with the linear correlation coefficient R2 from 0.88 to 0.99. For larger stretches [for strains above 8.8% (5-mm stretch)] for the human subject tested, the dependence is saturated and even goes down. The stretches in two perpendicular directions (parallel
442 |
Controlling of the Optical Properties of Tissues |
and perpendicular to the long axis of the forearm) yield good correlation between stretch and reflected light intensity and show that skin has anisotropic properties that can be detected by light reflection. For example, the slope measured in a parallel direction to the long axis of the forearm was 0.0095 ± 0.0002 (1/%), and in a perpendicular direction, 0.0065 ± 0.0008 (1/%).1013
5.9.2 Temperature effects and tissue coagulation
A reproducible effect of temperature between 25 and 40◦C on the reduced scat-
tering coefficient of human dermis and subdermis was found in an ex vivo study in the NIR region.236,237 For dermis, the relative change in the reduced scattering
coefficient showed an increase [(4.7 ± 0.5) × 10−3◦C−1], and for subdermis, a decrease [(−1.4 ± 0.28) × 10−3◦C−1]. The absolute values of the coefficients are presented in Table 2.1. It was hypothesized that the observed positive and negative temperature coefficients of scattering for dermis and subdermis are connected with differences in their structural components. The main scattering components of subdermis were assumed to be lipids in membranes and vacuoles. It is known
that lipids undergo phase changes at certain temperatures, which alter their orientation, mobility, and packing order.750,1070,1071 Glycolipids found in human cell
membranes undergo phase transitions in the temperature range from 25 to 45◦C, namely, a transition from a gel phase through a stable crystalline phase to a liquidcrystalline phase with increasing temperature. The decrease in the scattering coefficient seen experimentally with increasing temperature is therefore consistent with an increase in fluidity known to occur in lipids with increasing temperature. Modifications of the collagen fiber structure of dermis caused by increasing tem-
perature, possibly through changes in hydration, is the most plausible explanation of the increased scattering properties.236,237 As claimed by the authors of Refs. 236
and 237, a tissue that is largely protein has a positive temperature coefficient and a tissue that is largely lipid has a negative temperature coefficient leads to interesting possibilities in tissues where the protein/lipid ratio is intermediate, such as brain tissue.
The temperature change of absorption, μa, and the reduced scattering, μs, coefficients of human forearm skin have also been determined in the course of in vivo studies for two skin surface temperatures, 22 and 38◦C681 (see data in Table 2.1). A rather high increase of 16–21% for μa and much smaller increase of 2.7–4.6% for μs coefficient values were found with temperature change from 22 to 38◦C for the wavelengths 950–590 nm.
Low-intensity laser radiation, when used for spectroscopy (diagnostics) or therapy, may heat tissue and therefore distort results of tissue optical properties measurements or may induce an uncontrolled change in a photobiological response of a tissue caused by a local heating. Human skin temperature increase at CW laser irradiation can be estimated on the basis of experimental and theoretical studies presented in Refs. 261, 262, and 995. It was found experimentally that
Tissue Optics: Light Scattering Methods and Instruments for Medical Diagnosis |
443 |
for near-infrared laser radiation (789 nm) guided to the skin surface of the forearm of an awake human volunteer by a 1-mm optical fiber, the temperature increased linearly with power level as 0.101 ± 0.001◦C/mW at the depth of 0.5 mm,
as 0.038 ± 0.001◦C/mW at the depth of 1 mm, and as 0.029 ± 0.0005◦C/mW at the depth of 1.5 mm in the range of illuminating power up to 10 mW.995
The combination of the MC technique to calculate the fluence rate distribution of light and the adaptive finite element method to solve the heat transfer equation
was applied to investigate the process of hyperthermia induced by transskin irradiation with a He-Ne laser (633 nm).261,262 It was shown that the overheated tissue
volume, heating depth, and temperature can be effectively controlled by changing the free convention boundary conditions on the tissue surface and varying the power, radius, and shape of the incident laser beam. The four-layer model of human skin (epidermis, upper dermis, blood plexus, and lower dermis) with optical and thermal properties of the tissue layers taken from the literature was used for modeling. The modeling was done for Gaussian and rectangular incident light beams at noncoagulating intensities. By variation of the value of the heat transfer coefficient A, corresponding to free convection at initial skin surface temperature equal to 34◦C (A = 0.009 W/cm2 K), to weak isolation (A = 0.004 W/cm2 K), and to strong isolation (A = 0.0005 W/cm2 K), the effect of thermal insulation on tissue temperature distributions was studied. For a 25-mW Gaussian incident beam of a 1 mm in diameter, the subsurface temperature maxima at the depths of 0.20 mm, 0.18 mm, and 0.10 mm and equal to 36.7◦C, 41.3◦C, and 42.8◦C were found as isolation increased. At the depth of 1 mm, the calculated temperature was 37.7◦C, 38.1◦C, and 38.5◦C as the degree of isolation increased. It should be noted that the above-mentioned experimental data995 are well fit to the modeled ones for free convention boundary conditions on the skin surface. From experiments, it follows that for light power of 25 mW, temperature increase at the depth of 1 mm is expected to be 0.038◦C/mW × 25 mW = 0.95◦C. In its turn, calculations showed the temperature increasing from the initial value without radiation of 36.4◦C to 37.7◦C at laser action, i.e., by 1.3◦C. The somewhat higher temperature increase than expected in theory from the experimental estimation may be explained by the shorter wavelength of light used, which is more effectively absorbed by tissue chromophores.
The loss of water by tissue due to temperature effects (freezing in a refrigerator or noncoagulating heating) seriously influences its optical properties. For instance, in an in vitro study of human aorta, the absorption coefficient increased by 20–50%, especially in the visible range, when an average 46.4% of total tis-
sue weight was lost as a result of a dehydrated tissue sample prolonged freezing in a refrigerator.569,570 The weight loss was accompanied by an average shrinkage
in thickness of 19.5%. Primarily because of shrinkage (denser packing of tissue components), the absorption coefficient was increased in the spectral range 400– 1300 nm. There was only a slight increase of 2–15% in the reduced scattering coefficient in the visible range, again due to closer packing of tissue components.
The slope of the wavelength dependence of the reduced scattering coefficient μs, which is proportional to λ−h [see Eq. (1.178)], is a good test for the
444 |
Controlling of the Optical Properties of Tissues |
alteration of tissue morphology at heating or freezing. Data summarized in Table 1.5 demonstrate experimental values of parameter h for normal, dehydrated, and
coagulated human aorta received at an in vitro study in the spectral range 400– 1300 nm.569,570 Tissue dehydration (by its slow freezing) increases the slope (h)
from 1.15 (control) to 1.22, which reflects denser scatterers’ packing at tissue shrinkage. Sample heating during 5 min in a saline bath at temperatures in the vicinity of the tissue coagulation threshold may increase h [e.g., for 60◦C, from 1.21 (control) to 1.28 (possibly due to a local protein coagulation)] or decrease h [e.g., for 70◦C, from 1.30 (control) to 1.10 (possibly due to more extensive protein coagulation)]. This result reflects the fact that collagen denaturation starts dominating tissue behavior between 55 and 70◦C.569 Due to aorta tissue’s heterogeneity, its components may have reached different end points at the end of the 5-min heating period. At 100◦C heating of the samples in a saline bath, h was reduced from 1.38 for the normal tissue samples to 1.06 for the heated ones, and for the samples preliminarily wrapped in aluminum foil, h was reduced from 1.26 to 1.03.
As tissue heats in a bath, the absorption coefficients may increase up to 28% (60◦C) or decrease up to 22% (70◦C) on selected wavelengths. At the same time, the values of the reduced scattering coefficient were increased for all used heating temperatures in a wide range from 1.1 to 76%, depending on the wavelength in the range from 350 to 1320 nm and heating temperature. At a temperature of 60◦C, the increase was rather smooth (16–19%) in this wavelength range. At 70◦C, the increase of μs was not as smooth, being changed from 1.1 to 24.8%. Heating up to 100◦C gave an increase in in reduced scattering coefficient of 22–76%, but tissue wrapping decreased these values to 15–54%. Such complex behavior of scattering and absorption properties of precoagulated and coagulated tissues reflects tissue heterogeneity and the specificity of the protein denaturation process leading to the appearance of coarse and small thermally coagulated granular cellular proteins and some tissue chromophore damage, as well as interactions of heated saline with tissue resulting in saline and chromophore diffusion.569
Following Ref. 569, it may be verified that tissue progresses from normal to denaturated states between 60◦C and 70◦C, and that at 60◦C some changes in the optical properties caused by thermal damage are still reversible, even though the thermal threshold for protein coagulation is exceeded. In general, the complex behavior of tissue optical properties at heating can be explained by particular changes in tissue morphology. To model the optical properties of heated tissues, the modified morphology should be expressed in such terms as scatterer size distribution, particle and interstitial fluid refractive index mismatch, particle packing, and chromophore concentrations.
Long-pulsed laser heating may induce reversible and irreversible changes in the optical properties of tissue.570,997 The total transmittance decreased and the
diffuse reflectance increased in both fresh and precoagulated human skin and canine aorta samples when it was irradiated by a 0.2-ms pulsed Nd:YAG laser emitting at 1064 nm with the a repetition rate of 10 Hz (20 pulses of 0.9 J/pulse) and

Tissue Optics: Light Scattering Methods and Instruments for Medical Diagnosis |
445 |
a 1.5-mm light spot.570 The existence of nonlinear behavior in the optics of biological media was indicated.570 Possible mechanisms responsible for this nonlinear optical response are listed in Table 5.6. The in vitro skin-equivalent raft tissue irradiated with one pulse from a perovskite laser (λ = 1341 nm) with a fluence of 20 J/cm2 and pulse duration of 20 ms showed thermal injury areas characterized by less scattering as seen on the OCT images and loss of the SHG signal.997 Such behavior was interpreted by the authors of Ref. 997 as collagen fiber disintegration at thermal tissue protein denaturation, which can be rejuvenated at tissue healing.
Laser ablation or coagulation is usually accompanied by a change in the normal optical properties of the tissue.570,1050 For example, ablation of aortal tissue
using an eximer laser (308 nm) results in a 2.3-fold to 3.7-fold increase in its optical density compared with the untreated material.1050 Published results on optical properties of coagulated tissues are presented in Table 2.1. In spite of some variations in the dependence on tissue type, wavelength studied, and sample preparation technique, the general tendency at tissue coagulation is the increase of both the absorption and scattering coefficients, from a few dozens to twoor three-hundred percent.
Low temperatures (+12◦C) sometimes result in the so-called cold cataract, i.e., a sharp rise in the scattering coefficient due to protein aggregation.850,1016 This
process is reversed with an increase in temperature.
Cryogenic temperatures used in cryosurgery may also change scattering properties of tissues due to local variations in the refractive index, such as the boundary between liquid and frozen water in tissue.1004 The corresponding subsurface morphological changes were evident during freezing (−80◦C) of in vivo hamster skin.
Table 5.6 Possible mechanisms responsible for inducing reversible changes in tissue optical response on laser long-pulsed irradiation.570
Mechanism |
|
|
|
Description |
Optical response |
|||
|
|
|
|
|
||||
Thermal lensing, |
|
|
Gradient in the index of |
Decrease in Tt and increase |
||||
n(T ) = n(273 K) + |
|
refraction caused by |
in Rd |
|||||
T (r, z, t)(dn/dT ) |
|
nonuniform heating |
|
|||||
Temperature dependence of |
Change in the size and/or |
Increase in Tt and decrease |
||||||
the reduced scattering |
shape of scatterers due to |
in Rd (as μs decreases) |
||||||
coefficient: |
|
− |
] |
temperature rise |
|
|||
s |
|
= |
[ |
1 |
|
|
||
μ |
(T ) |
|
μs(T ) |
|
g(T ) |
|
|
|
Water transport |
|
|
|
Temporary local |
Increase in Tt and decrease |
|||
|
|
|
|
|
|
|
dehydration during laser |
in Rd |
|
|
|
|
|
|
|
heating |
|
Thermal expansion |
|
Decrease in tissue density |
Decrease in Tt and increase |
|||||
|
|
|
|
|
|
|
and increase in tissue |
in Rd |
|
|
|
|
|
|
|
thickness caused by thermal |
|
|
|
|
|
|
|
|
expansion of tissue |
|
|
|
|
|
|
|
|
|
|
446 |
Controlling of the Optical Properties of Tissues |
5.9.3 Tissue whitening
Sometimes, to provide higher-contrast images of intracellular components of the
epithelial tissues, instead of optical clearing, the usage of induced tissue turbidity (whitening) is more preferable.998–1006,1014 For example, a fundamental part of
the colposcopic exam is the use of acetic acid, which when applied to the cervix induces transient whitening changes in the epithelial tissues.1003 The spatial and temporal changes of “acetowhitening” are the major visual diagnostic indicators in the determination of the location of the most severe dysplastic regions. The acetowhitening effect causes a differential brightening of dysplastic tissue relative to normal tissue, and besides cervical disorders, is used for skin and other epithelial disease screening.
The brightening of nuclei enhances the contrast and significantly improves the detectability of nuclear morphology in basal cell cancers.1006 Under normal conditions, the nucleous contains a diffuse network of thin chromatin filaments that are typically 30–100 nm in diameter and occupy a small volume. Because of the small dimensions and difference between the refractive index of the chromatin, which is not high and can be estimated as 1.39, and surrounding tissue components (cell cytoplasm and interstitial fluid) of about 1.35, its backscattering is low. The acetic acid causes assembling of the chromatin into thick fibers that are 1–5 μm in diameter; the compacted chromatin fills a large fraction of the intranuclear volume,1006 and some increase in its refractive index is also expected;1003 thus, the backscattering signal from the nuclei is increased and they appear bright. After washing ex vivo samples of human epidermis with 5% acetic acid for three minutes, the epidermal cell nuclei appear bright as seen in the confocal reflectance images.1006
The temporal kinetics of the acetowhitening process as measured by the reflected light maximizes the first 1–2 min and decays over several minutes (5–10 min) thereafter, allowing one to clearly distinguish high-grade cervical intraepithelial neoplasia (CIN 2/3) from normal cervical epithelium when the ratio of green to red light intensities of the backscattered light was analyzed.1003 Normalizing the green light by the red light preserves kinetics in the reflected signal, indicating that the reflected light has a spectral change. Roughly, acetowhitening in the CIN 2/3 cervical tissue in vivo causes a 20–80% rise of the original reflectance. In contrast, mature squamous epithelium appears to increase in reflectance only by approximately 5%; moreover, reflectance is constant in time after acetic acid application.
5.10 Conclusion
This chapter shows that optical immersion technology allows one to effectively control the optical properties of tissues and blood. Such control leads to the essential reduction of scattering and therefore causes much higher transmittance (optical clearing) and the appearance of a large amount of least-scattered (snake) and
Tissue Optics: Light Scattering Methods and Instruments for Medical Diagnosis |
447 |
ballistic photons, allowing for successful application of coherent-domain and polarization imaging techniques. The dynamics of tissue optical clearing, defined by the dynamics of refractive index matching, is characterized by a time response of about 5–30 min, which in its turn depends on the diffusivity of the immersion agent in a tissue layer, water diffusion rate, and tissue layer thickness. The swelling or shrinkage of the tissue and cells may play an important role in the tissue clearing process at application of osmotically active agents.
In vivo reflectance spectrophotometry and frequency-domain measurements for immersed tissues show that the refractive index matching technique provided by the appropriate chemical agent can be successfully used in tissue spectroscopy and imaging when radical reduction of scattering properties is needed. Hyperdermal injection of glucose causes the essential clearing of human skin. For such tissues as sclera or cornea, the application of some drops of glucose is sufficient to make up very high and rather prolonged tissue clearing. In in vivo experiments, the impregnation of a tissue by an agent is more effective than in in vitro studies due to the higher diffusivity of an agent at physiological temperature and by involvement of blood and lymph microvessels into the process of agent distribution. However, some physiological reactions of living tissue on osmotically active solutions may influence the measured spectra.
Dynamic optical characteristics can be used for the determination of the diffusion coefficient and concentration of endogenous (metabolic) and exogenous (chemical agent) fluids in human sclera, skin, and other tissues.
The immersion technique has great potential for noninvasive medical diagnostics using OCT due to the rather small thickness of tissue layers usually examined by OCT, which allows for fast impregnation of a target tissue at a topical application of an immersion liquid. It has been demonstrated that the body’s interior tissues such as the blood vessel wall, esophagus, stomach, cervix, and colon can usually be imaged at a depth of about 1–2 mm. For more effective diagnosis using OCT, a higher penetration depth can be provided by the applying of immersion substances.
The method of tissue clearing is convenient, inexpensive, and simple for diagnostic purposes; in particular, it can be applied for in vivo monitoring of microcirculation. It may be useful for the study of the structure and function of blood microvessels—diameters of arterioles and venules, capillary density, bifurcation angles, etc.
Optical clearing might be a fruitful technique for various methods of tissue spectroscopy, microscopy, and imaging (Raman, fluorescence, confocal, laser scanning, near field, multiphoton, SHG, etc.) where scattering is a serious limitation. Encouraging results were recently received for the enhancement of a fluorescence signal at tissue optical immersion. It is important to note that reduction of light scattering may help in the differentiation of various fluorophores in the depth of a tissue, for instance of skin.
The concept that index matching could improve the optical penetration depth of whole blood is proved experimentally in in vitro studies. It should be accounted
448 |
Controlling of the Optical Properties of Tissues |
for that blood optical clearing is defined not only by the refractive index matching effect, but also by changes in the size of red blood cells and their aggregation ability when chemicals are added.
Many of the tested agents and the methods of their delivery have both advantages and disadvantages. The main disadvantages are the osmotic stress, which occurs at high concentration of the hyperosmotic agent applied, and low permeability of tissue cell structures for the clearing agents. Therefore, the finding of new agents and delivery techniques are important.
The immersion optical clearing concept and technology is applicable not only to soft tissues and blood, but also to hard tissues. At present, tendon409,410,946 (see Fig. 5.38), cranial bones,738 and tooth enamel1041 have been tested.

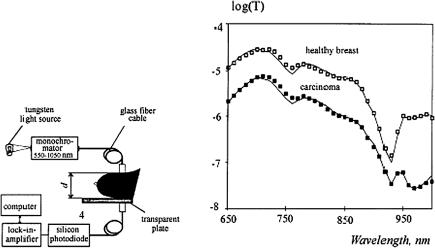
452 |
Continuous Wave and Time-Resolved Spectrometry |
(a) (b)
Figure 6.1 (a) Schematic setup of a spectrophotometer system used for in vivo measurements of breast tissue spectra.288 (b) Spectra and respective fits of a breast cancer patient (56 yrs., breast thickness of 60 mm) within the area of carcinoma and for a healthy breast and the similar localization as carcinoma.
detector, and the measurement geometry; and x2 compensates for measurement error of the thickness d and inaccuracies in the reduced scattering coefficient μs.
The semiempirical Eq. (6.2) was successfully used for fitting the in vivo measurement spectra of the female breast and estimation of the concentrations of the following absorbers: water (H2O), fat (f), deoxyhemoglobin (Hb), and oxyhemoglobin (HbO2) as288
μa = cH2OσH2O + cfσf + cHbσHb + cHbO2 σHbO2 , |
(6.3) |
where σi is the cross section of the absorption of the ith component.
By varying the concentrations of the four tissue components, the measurement spectra could be fitted well by Eq. (6.2); the correlation coefficients were better than 0.99 in all cases.288 Figure 6.1. shows the spectrometer for in vivo measurement of the collimated transmittance spectra of a female breast and some examples of measured and fitted spectra for normal and pathological (cancer tumor) tissues. Typically, most carcinoma spectra exhibit a lower transmittance than the reference spectrum (for the same breast thickness). The fits show that this is generally due to an increased blood perfusion (higher Hb/HbO2 values of the carcinoma curve). In the wavelength region between about 900 and 1000 nm, spectra are quite different; this is clearly due to the altered water and fat content of carcinomas compared with that of the healthy breast. The majority of mastopathies and carcinomas show a higher water concentration and a higher blood volume at the lesion site. A comparison of healthy and cancerous sites yields a slightly lower concentration of oxyhemoglobin for the tumor. Unfortunately, the specificity is not good
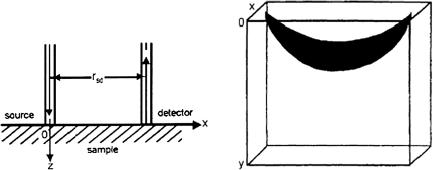
Tissue Optics: Light Scattering Methods and Instruments for Medical Diagnosis |
453 |
enough because it is not possible to discriminate between benign mastopathies and malignant carcinomas by means of water content, blood volume, and oxygenation.288
Transmittance NIR spectrometry for measuring oxygenation has had the most success to date in the newborn infant head, largely because of the small size of the head, the thin overlying surface tissues and skull, and the lower scattering coefficient of the infant brain.55 The development of the cooled CCD and timeresolved and spatially resolved techniques and instruments has proceeded rapidly, and they are increasing the area of NIR spectroscopy investigations and applications. At present, there are more than 500 commercial clinical NIR spectroscopy instruments for monitoring and imaging the degree of oxygenation in tissues, the concentration of oxidized cytochrome, and tissue hemodynamics.
For many tissues, in vivo measurements are possible only in the geometry of the backscattering. The corresponding relations can be written on the basis of a diffusion approximation. For a semi-infinite medium and source and detector probes separated by a distance rsd, normal to the sample surface (see Fig. 6.2), and optically matched (so that specular reflectance at the surface can be neglected), the reflecting flux is given by Eq. (2.17).685 A more general expres-
sion valid for refractive index mismatch conditions on the boundary is given by Eq. (1.27).205,206
(a) |
(b) |
Figure 6.2 Geometry of a fiber backscattering experiment for investigation of (a) a semi-infinite medium, and (b) a “banana” shape region of photon path distribution.1120,1121
For backscattering optical spectroscopy and tomography, in addition to the measured coefficient of reflection defined by Eqs. (1.27) and (2.17), we have to know from what depth the optical signal is coming. That depth is defined by the
photon-path-distribution function for the photons migrating from a source to a detector.1120,1121 This spatial distribution function for a homogeneous scattering
medium has a “banana” shape [see Fig. 6.2(b)]. In the weak absorption limit, the modal line of the banana region (the curve of the most probable direction of a

454 Continuous Wave and Time-Resolved Spectrometry
photon migration) is given by1120,1121
z ≈ |
|
8 |
|
x2 + (rsd − x)2 2 + 32s2(rsd − x)2 |
1/2 |
− x2 − (rsd − x)2 |
|
1/2 |
|
|
, (6.4) |
||||||||
|
|
1 |
&,( |
) |
- |
|
' |
|
|
|
|
|
|
|
|
||||
where 0 ≤ x ≤ rsd. At x = rsd/2, the modal line of the banana region reaches a maximum depth,
zmax ≈ |
rsd |
|
|||
2 |
√ |
|
. |
(6.5) |
|
|
2 |
|
|
||
Instead of Eq. (6.2), used for in vivo study in transillumination experiments,
using Eqs. (2.17) and (6.4), we can write a modified Beer-Lambert law to describe the optical attenuation in the following form:1120,1121
I |
= exp(−εabcabrsdDPF − Gs), |
(6.6) |
I0 |
where I0 is the intensity of the incident light, I is the intensity of the detected light, εab is the absorption coefficient measured in μmol−1 cm−1, cab is the concentration of absorber in μmol, rsd is the distance between the light source and detector, DPF is the differential path length factor accounting for the increase in the photons’ migration paths due to scattering, and Gs is the attenuation factor accounting for scattering and geometry of the tissue.
When rsd, DPF, and G are kept constant (for example, during the estimation of the total hemoglobin or degree of oxygenation), then the changes in the absorbing medium concentration can be calculated using measurements of the changes in the optical density (OD), (OD) = [log(I0/I )] as
cab = |
(OD) |
(6.7) |
εabrsdDPF . |
In optical imaging, the changes in optical density are measured as1120,1121
(OD) = log |
I0 |
− log |
I0 |
= log(Irest) − log(Itest), |
(6.8) |
Itest |
Irest |
where Irest and Itest represent the light intensity detected when the object is at rest (brain tissue, skeletal muscle, etc.) and being tested (induced brain activity, cold or visual test, training, etc.), respectively. For example, based on the OD changes at wavelengths of 760 and 850 nm, one can get either the absorption images for these two wavelengths or functional images (oxygenation or blood volume) within the detection region of study as
(OD)oxy = (OD)850 |
− (OD)760, |
(6.9) |
(OD)total = (OD)850 |
+ kbvo (OD)760, |
(6.10) |
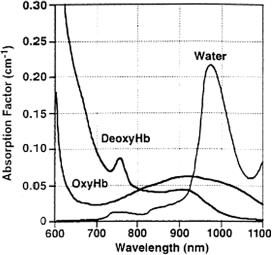
Tissue Optics: Light Scattering Methods and Instruments for Medical Diagnosis |
455 |
where (OD)850 and (OD)760 are the optical densities measured at the wavelengths 850 and 760 nm, respectively, and kbvo is the modification factor for reducing the cross talk between changes of blood volume and oxygenation. This factor is determined by calibration on a blood model.
NIR absorption spectra of oxyand deoxyhemoglobin and water are presented in Fig. 6.3.4 The water band at about 980 nm can be used as an internal standard
for the evaluation of the absolute concentrations of the blood components in tissue in vivo.1122
Figure 6.3 Near-infrared attenuation [log10] for 1-cm depth deoxyhemoglobin (DeoxyHb), oxyhemoglobin (OxyHb), and water; hemoglobin concentration, 210 μM in water.4
6.1.2 Example of a CW imaging system
The whole-spectrum NIR spectroscopy system described in Ref. 1123 uses illumination of the subject’s head with light from a halogen lamp emitting a continuous spectrum [see Fig. 6.4(a)]. The back-reflected light is detected and spectrally analyzed by a commercial grating spectrograph equipped with a liquid nitrogen cooled CCD detector. The system provides a spectral resolution of 5 nm in the range 700– 1000 nm; spectra were collected every 100 ms. Figure 6.4(b) illustrates the image received using this optical instrument and the testing algorithm described [see Eqs. (6.9) and (6.10)]. It shows a focal increase in total Hb in response to stimulation with a stationary multicolored dodecahedron. The area of the peak response is clearly focused and it is about 0.5 × 0.5 cm in size.
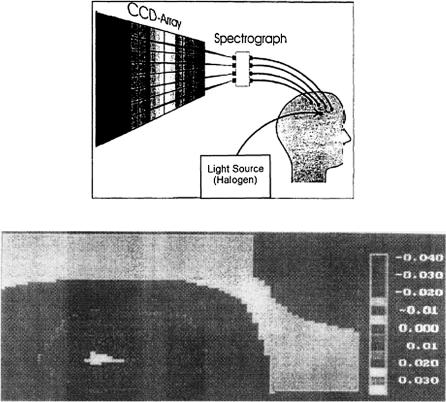
456 |
Continuous Wave and Time-Resolved Spectrometry |
(a)
(b)
Figure 6.4 A CCD-NIR spectroscopy system.1123 (a) Scheme. (b) Functional image, changes in blood volume (total hemoglobin) [see Eqs. (6.9) and (6.10)] during visual simulation (a stationary dodecahedron) as detected over the occipital cortex.
6.1.3 Example of a tissue spectroscopy system
A typical experimental system for in vivo backscattering spectroscopy and the corresponding spectra for normal and pathological tissues are shown in Fig. 6.5.47,94,95
Figure 6.5(b) is an example of spectra taken from the colon of one patient. The absorption bands are of oxyhemoglobin (the Soret band and Q bands are clearly evident). The 400–440-nm segment encloses the hemoglobin Soret band, but also encompasses some absorption from compounds such as flavin mononucleotide, beta-carotene, bilirubin, and cytochrome. The 540–580-nm segment covers the hemoglobin Q band, with minor absorption from cytochrome and other components. On the basis of measurement of the spectral differences of normal and pathological tissue, the corresponding spectral signature “identifiers” can be created. Such spectral “identifiers” for in vivo medical diagnostics usually use the ratios of the reflection coefficients integrated within selected spectral bands or the measurement of the spectrum slope for the spectral bands selected.
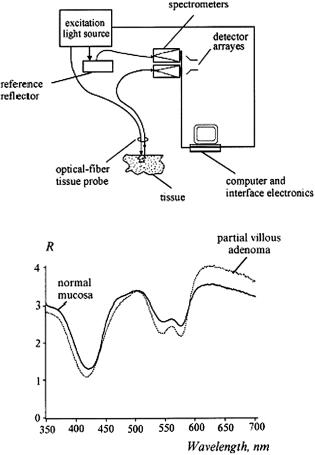
Tissue Optics: Light Scattering Methods and Instruments for Medical Diagnosis |
457 |
(a)
(b)
Figure 6.5 (a) Schematic diagram of an experimental system for in vivo measurements of spectral reflectance of internal organs.47 (b) Typical tissue spectra, shown as examples, for two measurements made in the colon of one patient (the spectra have been normalized to the same total integrated signal between 350 and 700 nm); normal mucosa and partial villous adenoma.
A more analytic and quantitative study, provided in Ref. 1124, might yield more insight into the sensitivity of CW reflection spectroscopy. Three different detecting probes were used in the measurements within the spectral range from 400 to 1700 nm. Authors have paid attention to a proper calibration of the probes using a reflection standard (SRS-99-010, LabSphere, North Sutton, UK). For the precise recognition of the absorptions peaks of the tissue, the first derivative of the NIR spectra was computed using the method of Savitzky and Golay. It was shown that CW NIR spectroscopy can detect the presence of lipid in atherosclerotic plaque of the aorta with good sensitivity.
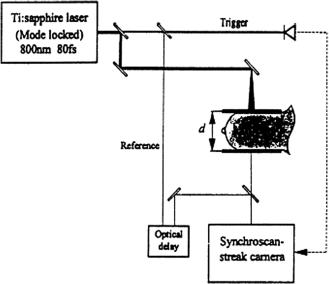
458 |
Continuous Wave and Time-Resolved Spectrometry |
6.2Time-domain and frequency-domain spectroscopy and tomography of tissues
6.2.1 Time-domain techniques and instruments
One of the designed time-resolved laser systems for in vivo measurements of optical properties of the human breast is presented in Fig. 6.6.288 This system consists of a mode-locked Ti:sapphire laser at a wavelength of 800 nm with a pulse duration of 80 fs and a repetition frequency of 82 MHz. The probe laser beam transilluminates the female breast and the forward-scattered light reaches the detection side of the synchroscan streak camera (S1 photocathode, Hamamatsu C3681). For the enhancement of tissue transmittance, making it more homogeneous and providing stable boundary conditions, the breast was slightly compressed between two transparent plates. Such compression was much less than in a conventional x-ray mammography in order to avoid any influence of changed blood perfusion on the absorption properties. The scattered light is imaged onto the slit of the streak camera with a 1:1 magnification. The dimensions of the slit are 50 μm × 6 mm and the numerical aperture of the camera optics is 0.22. To provide a temporal reference, the reference laser beam was optically delayed and imaged on the streak camera slit; a trigger beam synchronized the streak camera. The working principles of a streak camera and other instrumentation used in time-resolved techniques are described in detail in Refs. 301, 302, 303.
The temporal profile of the light intensity incident on the camera was recorded with a time resolution of about 10 ps and displayed as a spatial profile. A pre-
Figure 6.6 Schematic setup for time-resolved transillumination of female breast tissue in vivo.288

Tissue Optics: Light Scattering Methods and Instruments for Medical Diagnosis |
459 |
cise shading correction and dark count subtraction were performed for each measurement of the dispersion curve. For in vivo measurements, the probe laser beam with a total power of 100 to 150 mW was expanded to a diameter of 10 mm to keep the power density below the maximum permissible exposure of 200 mW/cm2.
Normalized dispersion curves for three volunteers T1, T2, and T3 and the corresponding results of the theoretical fit according to the diffusion model [see Eq. (1.36)] are shown in Fig. 6.7. The dispersion curves range over a typical period of 6 ns with a mean time of flight of more than 2 ns. Owing to the strong scattering and low absorption, most photons travel ten times the geometrical distance through the compressed breast. The signals T1 and T2 (d = 45 mm) overcome the background noise for a time of flight of about 510 ps, which is more than twice the minimum time of flight of a ballistic photon (refractive index of tissue 1.4). For a thicker tissue layer T3 (d = 59 mm), this time shifts to 830 ps, which is about three times longer than for ballistic photons.
(a) |
(b) |
Figure 6.7 Normalized in vivo dispersion curves of the breasts of three volunteers (T1, T2, and T3; thickness d) and corresponding theoretical fit curves: (a) three breasts in one position; (b) one breast in three positions.288
Measurements at different positions of the breast reflect the influence of physiological alterations within different areas of the organ (different types of tissue, different blood volumes, and oxygenation) and serves as a basis for diffuse optical mammography [see Fig. 6.7(b)]. It should be noted that the slightly different boundary conditions and degree of compression, as well as the inhomogeneity of superficial tissue pigmentation, can be critical for obtaining reliable mammograms. Table 2.1 presents the results of in vitro, ex vivo, and in vivo measurements of optical parameters of the human female breast and some other thick tissues carried out by the methods discussed as well as some other optical techniques.
460 |
Continuous Wave and Time-Resolved Spectrometry |
Algorithms for the solving of the inverse problem on determination of μa and μs using Eqs. (1.35) and (1.36) can be successfully used not only for tissue spectroscopy but also for tomography. For tomography purposes, we are not able to provide measurements of the absolute concentrations of absorbers and absolute values of the scattering coefficients (although this is desirable), which allow one to implement these algorithms faster. Generally, the imaging is aimed at the detection of pathology or at the localization of lesions. The detection of a lesion is achieved by recording a 2D image with sufficient contrast, while localization needs optical slicing and tomographic reconstruction to obtain the 3D images by which the size, shape, and position of the hidden object can be determined.287
Imaging systems usually use 2D or 3D scanning of a narrow laser beam or a translation optical stage with the object attached. Nonscanning systems are more robust and correspondingly fit medical applications much better. Such nonscanning systems use a multichannel fiber-optical arrangement with fixed positions of light sources and detectors, or low-noise, high-sensitivity, and fast CCD cameras with multichannel plate optical amplification. In any case, the measurement procedure is completed by sampling the intensity of each pixel as a function of time to obtain a time-space intensity mapping. The image is numerically reconstructed
by attributing to each pixel the intensity measured over the selected integration time.287
A multichannel NIR imager/spectrometer based on the time-correlated single-
photon counting technique was designed for breast imaging in clinics [see Fig. 6.8(a)].1125 The instrument uses two NIR wavelengths, 780 and 830 nm, the
mean power of each laser diode is about 40 μW, and they pulse at 5 MHz with a pulse width of about 50 ps. A highly sensitive R5600U-50 GaAs photomultiplier has been chosen for breast examination. For enhancement of the contrast of carcinoma images, intravenous administration of Infracyanine 25 (IC25), an NIR contrast agent, was used. Optical absorption changes were calculated using the following relation:
μa = − c t2 |
t2 |
ln J1 |
(r, t) dt, |
(6.11) |
|
t1 |
|||||
2 |
|
|
J2 |
(r, t) |
|
where c is the speed of light in the medium; t is the time resolution of the pulse-height analysis (PHA, Hamamatsu Inc.) of the multichannel analyzer (MCA, Hamamatsu Inc.); J1 and J2 are the photon current measurement preand postIC25 injection, respectively, and t1, t2 are the width of the J1 time-resolved curve. Equation (6.11) gives accurate values of μa for small absorption changes.
The relative displacement of the light sources and detectors, and the positions of the projection plane and pathology (carcinoma, black sphere) are shown in Fig. 6.8(b). The calculations of the absorption coefficient differences along the straight lines connecting those source-detector pairs in space that have comparable separations [shown as diamonds in Fig. 6.8(b)] allow for estimation of the IC25 distribution in tissue. Tests with patients were done simultaneously with the standard MR imaging (MRI) examination protocol.
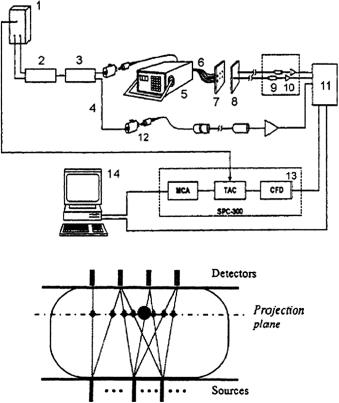
Tissue Optics: Light Scattering Methods and Instruments for Medical Diagnosis |
461 |
(a)
(b)
Figure 6.8 Multichannel, time-correlated single-photon counting NIR imager/spectrometer:
(a) 1, two laser diodes; 2, a wavelength coupler; 3, 19:1 signal splitter; 4, the reference branch; 5, 1 × 24 optical DiCon fiber-optics switch; 6, graded index, 10-m-long optical fibers; 7, compression plates; 8, 8-step index, 10-m-long fiber bundles; 9, PMT; 10, amplification unit; 11, router; 12, attenuator; 13, SPC-300 photon counting system using an SRT-8 8-channel multiplexer; 14, Intel Pentium PC; CFD, constant-fraction discriminator; MCA, multichannel analyzer; TAC, time-to-amplitude converter. (b) Relative displacement of the light sources and detectors, and the positions of the projection plane and pathology (carcinoma, black sphere).1125
Figure 6.9 illustrates the possibilities of time-resolved optical diffusion mammography in comparison with MRI study. Measurements were done for a patient (70-year-old Caucasian) diagnosed with an infiltrating ductal carcinoma approximately 10 mm in diameter. For the presented image, six sources and eight detectors were employed. A good correspondence between the MRI and the NIR images is easily seen. In the 780-nm light image, two objects are resolved, either due to measurement noise or due to actual physiology of the tissue. Owing to more absorption (12%) of IC25 at 780 nm than at 830 nm, expected differences should be enhanced more.
A much more comprehensive time-resolved optical tomography system employing 32 channels and designed for imaging of the neonatal brain and the hu-

462 |
Continuous Wave and Time-Resolved Spectrometry |
Figure 6.9 MRI and NIR image coregistration. (a) Saggital fast spin echo (FSE) MRI slice from a 70-yr-old patient with infiltrating ductal carcinoma. (b) Spin echo (SE) MRI axial image of the same patient. (c) NIR projection image at 780 nm. (d) NIR projection image at 830 nm.1125
man breast is shown in Fig. 6.10.1126 This is the multichannel optoelectronic nearinfrared system for time-resolved image reconstruction (MONSTIR). Light from a pulsed high-power picosecond laser source is switched sequentially into one of 32 fibers that are attached to the surface of an object under study. The detection system is used to record the temporal distribution of light exiting the tissue at certain positions around the object with a temporal resolution of about 80 ps and a rate of photon counting up to a few 105 per second per channel. This is accomplished by utilizing 32 fully simplex ultrafast photon-counting detectors. The scattered photons are collected by 32 low-dispersion, large-diameter (2.5-mm) fiber bundles that are coupled to 32-stepper motor-driven variable optical attenuators (VOAs). Because of the large dynamic range of light intensities around the object, the VOAs are required to ensure that the detectors are not saturated or damaged and that the system operates within the single-photon counting mode. Light transmitted via VOA is collected by a short 3.0-mm diameter single polymer fiber and then is transmitted via a visible blocking filter to the photocathodes of four ultrafast eightanode multichannel plate-photomultiplier tubes (MCP-PMTs). The resulting electronic pulse is preamplified and converted into a logic pulse, and a histogram of the photon flight times is recorded and transfered to the control computer. A dedicated image reconstruction software package, TOAST (time-resolved optical absorption and scattering tomography, http://www.medphys.ucl.ac.uk/toast/index.html),
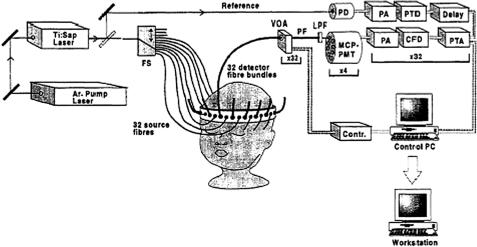
Tissue Optics: Light Scattering Methods and Instruments for Medical Diagnosis |
463 |
Figure 6.10 Schematic diagram of the MONSTIR imaging system: FS, fiber switch; VOA, variable optical attenuator; PF, polymer fiber; LPF, long-pass filter; MCP-PMT, multichannel plate-photomultiplier tube; PA, preamplifier; CFD, constant fraction discriminator; PTA, picosecond time analyzer; PD, photodiode; PTD, picotiming discriminator.1126
is used for the reconstruction of the tomographic images of the absorption and scattering profiles.
A portable three-wavelength NIR time-resolved spectroscopic (TRS) system (TRS-10, Hamamatsu Photonics K.K., Japan) is available on the market.1127 In the TRS system, a time-correlated single-photon-counting technique is used for detection. The system is controlled by a computer through a digital I/O interface consisting of a three-wavelength (761, 795, and 835 nm) picosecond (about 100 ps) pulsed light source, a photon-counting head for single-photon detection, and signal-processing circuits for time-resolved measurement. The average power of the light source is at least 150 μW at each wavelength at a repetition rate of 5 MHz. The instrumental response of the TRS system, which included a 3-m length light source fiber (graded index type single fiber with a core diameter of 200 μm) and a 3-m length light detector fiber (a bundle fiber of 3-mm diameter), was around 150 ps full width at half maximum (FWHM) at each wavelength. This system was used for estimating the absorption and reduced scattering coefficients of the head in a piglet hypoxia model.1127 Measurements of absolute values of the absorption coefficient at three wavelengths enable estimation of the hemoglobin concentration and its oxygen saturation in the head.
6.2.2 Frequency-domain techniques and instruments
Considerable progress in the investigation of tissues and molecules of biological importance with the use of the modulation technique provided the foundation for the development and commercial production of spectrometers of a
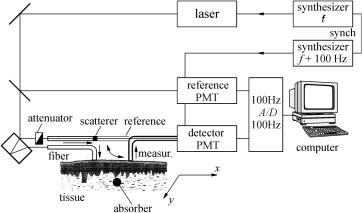
464 |
Continuous Wave and Time-Resolved Spectrometry |
new type (for example, ISS Fluorescence & Analytical Instrumentation). A typ-
ical scheme of the frequency-domain spectrometer for tissue study is shown in Fig. 6.11.1–4,6,301–303,311,312 Such systems for phase measurements use a het-
erodyning principle (two photomultipliers with heterodyning in one of the first dynodes) to transfer a measuring signal to a low-frequency range (100 Hz for the shown system), where phase measurement can be done much more precisely.
Figure 6.11 A typical scheme of a frequency-domain light-scattering spectrometer or pho- ton-density wave imaging system (if 2D scanning of irradiating and receiving fibers is provided).1,3
We should also mention models of compact and comparatively cheap devices— modulation spectrometers—for noninvasive quantitative determination of oxygen saturation of blood hemoglobin, monitoring of optical parameters of tissues, and localization of absorbing or scattering inhomogeneities inside a tissue. Such spectrometers include diode lasers as radiation sources at one or two wavelengths and
a photomultiplier with heterodyning in one of the first dynodes or a fast semiconductor photodetector with a high-frequency amplifier.303,325,326 Specifically, NIM
Incorporated produces a PMD 3000b two-wavelength spectrometer (with λ = 760 and 810 nm and a fixed modulation frequency of 200 MHz) for noninvasive quantitative determination of oxygen saturation of hemoglobin.1128 Carl Zeiss Jena is the manufacturer of a more sophisticated and universal system, which operates at the wavelength of 685 nm with two fixed modulation frequencies equal to
110 and 220 MHz. This system also includes a computer-controlled optical table, which ensures the regime of tissue transillumination.325,326 A much simpler and
more universal research system has been developed and manufactured at Saratov University.1129 This system includes quantum-well lasers (λ = 790 and 840 nm),
which ensure a highly efficient low-noise modulation of laser radiation within the range of 100–1000 MHz; a set of optical fibers; and a computer-controlled optical
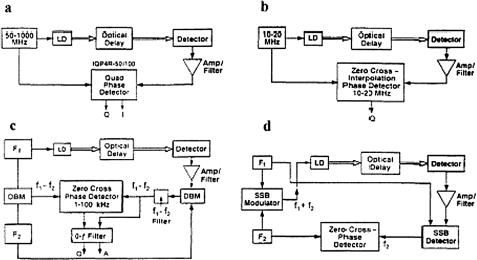
466 |
Continuous Wave and Time-Resolved Spectrometry |
Figure 6.12 Four types of optical propagation delay measurement devices for tissue study:
(a) and (b) homodyne systems; (a) has IQ demodulation, (b) a zero-crossing phase detector.
(c) and (d) heterodyne systems; (c) is amplitude modulated and (d) is single sideband (SSB) with F1 as the RF oscillator and F2 as the local oscillator (audio); the upper sideband f1 + f2 is used.4 LD, laser diode; DBM, double-balanced mixer.
(b) uses a zero cross-phase detector. The system in (c) uses amplitude modulation at two close RF, f1 and f2, and (d) uses single sideband (SSB) modulation; f1 is a RF and f2 is an audio frequency; both systems with zero cross-phase detectors.
A number of phase-measurement systems are described in Refs. 1 and 4. The amplitude measurements are relatively simple, but sometimes they do not provide the accuracy needed because, for example, of the influence of stray light. Phase measurements are amplitude independent and can be carried out with acceptable accuracy. Moreover, multiwavelength phase measurements alone are sufficient to estimate such important quantities as hemoglobin concentration and its degree of oxygenation. Simultaneous amplitude and phase measurements are used for the determination of absolute values of absorption coefficients.
The basic form of a homodyne system with an IQ demodulator is presented in Fig. 6.12(a). Determining the phase shift path (the phase difference between the reference oscillator and the signal pathway) involves a laser diode, an optical detector, an amplifier, and a narrowband filter. The working principle of an IQ demodulator is shown in Fig. 6.13. It includes a 90-deg splitter (hybrid), two double-balanced mixers (DBMs), and a 0-deg splitter. In the demodulator, the carrier (as reference signal) is recovered from an incoming modulated signal and fed to the 90-deg hybrid and the modulated signal (as the signal under test) is fed to the 0-deg hybrids.
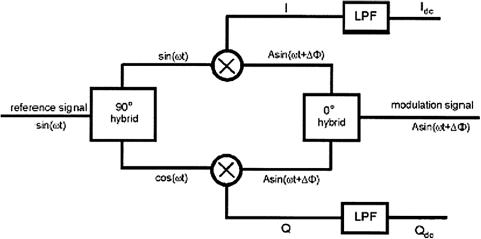
Tissue Optics: Light Scattering Methods and Instruments for Medical Diagnosis |
467 |
Figure 6.13 Diagram of IQ demodulator as a phase and amplitude detector;1130 LPF, low-pass filter.
Functioning as a multiplier, the in-phase mixer produces an output of4,1130
I (t) = sin(ωt)2A sin(ωt + ) = A cos − A cos(2ωt + ), (6.12)
where sin(ωt) is the carrier signal, 2A sin(ωt + ) is the modulated signal, and the phase delay is caused by the scattering medium.
The quadrature mixer produces an output of
Q(t) = cos(ωt)2A sin(ωt + ) = A sin + A sin(2ωt + ), (6.13)
where A sin and A cos are dc signals that carry the information on amplitude (A) and phase ( ) caused by light interaction with the scattering medium. A sin(2ωt + ) and A cos(2ωt + ) are high-frequency components that are blocked by using low-pass filters (LPFs); therefore, after filtration, such signals as Idc and Qdc are registered. The phase and amplitude caused by a medium can be found from the equations
= tan−1 |
Qdc |
, A = ,Qdc2 + Idc2 - |
1/2 |
. |
(6.14) |
Idc |
|
For backscattering geometry, such as that presented in Fig. 6.2, the analytical ex-
pressions for the phase shift and modulation amplitude A in the diffusion approximation are defined as follows:4,325,326
= rsd |
[(μac) |
2 |
+ |
ω2 |
] |
1/2 |
− μac |
|
1/2 |
|
|
+ 0, |
(6.15) |
||||||||||
|
|
|
D |
|
|
|

468 Continuous Wave and Time-Resolved Spectrometry
A = |
|
4πDrsd exp2−rsd [ |
a |
+ |
2D] |
|
+ |
a |
|
3, |
(6.16) |
|
|
A0 |
(μ c)2 |
|
ω2 |
1/2 |
|
μ |
c |
1/2 |
|
where rsd is the source-detector separation, 0 is the initial phase due to the instrumental response, A0 is the initial amplitude due to the instrumental response, D ≈ c/(3μs), and c is the speed of light in the medium.
For relatively small modulation frequencies, when ω < μac, the phase shift is a linear function of frequency,
= |
2 |
|
(Dμac)1/2 + 0 ≈ 2c |
μas |
1/2 |
(6.17) |
|
|
+ 0. |
||||||
|
|
rsdω |
rsdω |
3μ |
|
|
|
For relatively large frequencies, when ω > μac (ω/2π ≤ 500 MHz), |
|
||||||
|
= rsd(ω/2D)1/2 + 0 ≈ rsd&3ωμs/2c'1/2 + 0. |
(6.18) |
|||||
A0 and 0 can be calibrated by using a standard model (phantom) with known μs and μa. Then, after calibration of the experimental setup, optical parameters of the tissue under study can be calculated from the measured amplitude and phase shift on the basis of Eqs. (6.10) and (6.11) using the following iteration formulas:
μa |
= [rsd4 ω2 − 4D2( − 0)4]/4cD( − 0)2rsd2 , |
|
μs |
= c/3D − μa, |
(6.19) |
D |
= −rsd2 ω/2( − 0)[ln(A/A0) + ln(4πDrsd)]. |
|
Therefore, the homodyne system measures the phase difference between the reference oscillator and the signal pathway. The analogue IQ detector (see Fig. 6.13)
allows one to reach an accuracy of 0.2 deg in phase and 0.5 dB in amplitude with carrier frequencies of 140 MHz.4,1130
The heterodyne principle is characteristic for many communication systems. Since the error of the phase measurements decreases when oscillator frequency slows down and the bandwidth of a detector is constant, instruments designed for a low-frequency range may give higher accuracy. The nonlinear mixing of two signals with different frequencies, f1 and f2, gives signals with the sum and difference frequencies, one of which, namely, (f1 − f2), is selected, amplified, filtered, and coupled to a phase detector as a reference signal [see Fig. 6.12(c)]. Propagation of the modulation signal f1 through the optical system, the biological tissue, the optical detector, and the amplifier/filter leads to phase and amplitude changes. The signal on an intermediate frequency [(f1 − f2), 1–100 kHz] is obtained from a second mixer and serves as the measuring signal for the phase detector. The intermediate frequency should be high enough to avoid a 1/f noise problem and low enough to exclude high-frequency errors in zero-crossing phase detection. The
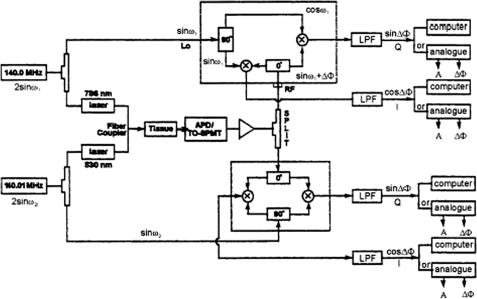
Tissue Optics: Light Scattering Methods and Instruments for Medical Diagnosis |
469 |
drawback of the heterodyne system is that the oscillators F1 and F2 must have a phase coherence equal to the required system accuracy.
The SSB system [see Fig. 6.12(d)] provides both efficient light modulation and efficient signal detection. It has important advantages: (1) the carrier modulation and the laser diode modulation are present only when the local oscillator (F2) activates the sideband selected (thus, convenient control of RF light modulation is available); (2) the local oscillator frequency can be in the convenient audio range; and (3) all of the RF power is in a single narrow band of frequencies set by the low-frequency oscillation.
As an example, let us consider in more detail the functioning of a twowavelength heterodyne IQ detection system, presented in Fig. 6.14.4,1130 The twowavelength NIR systems are usually used to detect the hemoglobin saturation of living tissue. Two RF signal sources are used and operate at slightly different frequencies, namely, 140.00 and 140.01 MHz, which provide the driving signals for two laser diodes with different wavelengths. The two laser beams are combined and directed simultaneously with the fiber coupler to the tissue under study. The optical signals collected from the tissue are fiber coupled to the PMT (or a number of PMTs). After passing an amplifier, the two-wavelength optical signals go into each IQ demodulator at the same time (the signal differentiation is due to different RF frequencies).
If channel 1 is characterized by the RF signal sin(ω1t) and the detected signal is characterized by 2A1 sin(ω1t + 1), and channel 2 by sin(ω2t) and 2A2 sin(ω2t + 2), then the IQ signals for each channel can be expressed as
Figure 6.14 A two-wavelength phase-modulated spectroscopy system operating at 140 MHz and using analog IQ demodulation (see text for details).4
470 |
Continuous Wave and Time-Resolved Spectrometry |
the following:1130
I1(t) = [2A1 sin(ω1t + 1) + 2A2 sin(ω2t + 2)] sin(ω1t)
=A1 cos 1 − A1 cos(2ω1t + 1) + A2 cos[(ω1 − ω2)t + 2]
−A2 cos[(ω1 + ω2)t + 2],
Q1 |
(t) = [2A1 sin(ω1t + 1) + 2A2 sin(ω2t + 2)] cos(ω1t) |
|
|
= A1 sin 1 + A1 sin(2ω1t + 1) + A2 sin[(ω1 − ω2)t + 2] |
|
|
+ A2 sin[(ω1 + ω2)t + 2], |
(6.20) |
I2 |
(t) = [2A1 sin(ω1t + 1) + 2A2 sin(ω2t + 2)] sin(ω2t) |
|
=A2 cos 2 − A2 cos(2ω2t + 2) + A1 cos[(ω1 − ω2)t + 1]
−A1 cos[(ω1 + ω2)t + 1],
Q2(t) = [2A1 sin(ω1t + 1) + 2A2 sin(ω2t + 2)] cos(ω2t)
=A2 sin 2 + A2 sin(2ω2t + 2) + A1 sin[(ω1 − ω2)t + 1]
+A1 sin[(ω1 + ω2)t + 1].
This system uses two low-pass filters (LPF): one is a dc 1.9-MHz band to reject the high-frequency components (2ω1, 2ω2, ω1 + ω2) in each channel; another is a dc 10-kHz band to block the low-frequency component (ω1 − ω2 = 10 kHz). According to Eqs. (6.20), such filtration allows one to separate the combined signal into two signals for each wavelength, and each channel itself contains only I and Q signals [see underlined terms in Eqs. (6.20)]. However, it was shown experimentally that the third-order mixing effects influence the low-frequency crosscorrelation between channels. The interchannel cross talk for a phase is less than 1.4 deg/dB, and for amplitude is less than 3.8 mV/dB (phase or amplitude changes in one channel caused by changes of amplitude in another one).
For more effective separation of signals, a fast Fourier transform analysis can be used. A much simpler solution is to use time-share control of the system. The computer-controlled time share ensures that at any one time only one wavelength optical signal may pass through the whole system. In this way, the interchannel cross talk can be reduced for phase up to 0.1 deg/dB and for amplitudes up to 0.5 mV/dB.4
6.2.3 Phased-array technique
In the NIR region, the wavelengths of diffusive photon-density waves in tissues are equal to 5–14 cm for modulation frequencies from 500 to 100 MHz [see Eqs. (1.47) and (1.48)]. This means that there is low resolution of imaging with the usual source and detection combination in spite of the high accuracy of phase and amplitude measurements. The photon-density waves interference method described

Tissue Optics: Light Scattering Methods and Instruments for Medical Diagnosis |
471 |
for the first time in Ref. 331 (phase and amplitude cancellation method, or phased-
array method) is very promising for the improvement of the spatial resolution of the modulation technique.4,53,342
The concept of this method is illustrated in Fig. 6.15. It is based on the use of either duplicate sources and a single detector or duplicate detectors and a single source so that the amplitude and phase characteristics can be nulled and the system becomes a differential. If equal amplitude at the 0- and 180-deg phases are used as sources, appropriate positioning of the detector can lead to null in the amplitude signal and a crossover between the 0- and 180-deg phase shifts, i.e., at 90 deg:
A sin(ωt + 0) + A sin(ωt + 180) = 2A cos(90) sin(ωt + 90), |
(6.21) |
where ω is the light modulation frequency.
Figure 6.15 The geometry of the amplitude and phase cancellation technique; two sources (S1 and S2) and a single detector (D1), or two detectors (D2 and D3) and a single source (S3).1133
In a heterogeneous medium, the apparent amplitude’s null and the phase’s crossover may be displaced from the geometric midline (see Fig. 6.16). This method is extremely sensitive to perturbation by an absorber or scatterer. A spatial resolution of about 1 mm for the inspection of an absorbing inhomogeneity has been achieved and the similar resolution is expected for the scattering inhomogeneity. Another good feature of the technique is that at the null condition, the measuring system is relatively insensitive to amplitude fluctuations common to both light sources. On the other hand, inhomogeneities, which affect a large tissue volume common to the two optical paths, cannot be detected. The amplitude signal is less useful in imaging since the indication of position is ambiguous (see Fig. 6.16). Although this can be accounted for by further encoding, the phase signal is robust and a phase noise less than 0.1 deg (signal-to-noise ratio is more than 400) for a 1-Hz bandwidth can be obtained.4
The phase modulation system requires, for optimal results, SSB measuring technology [see Fig. 6.12(d)]. Nine sources and four detectors are used in the 50-MHz single-wavelength (780 nm) phase-array imaging system presented in Fig. 6.17.1131 The number of sources and detectors can readily be increased;

472 |
Continuous Wave and Time-Resolved Spectrometry |
Figure 6.16 Demonstration of the existence of amplitude null and phase crossover for a phased-array measuring system used to study an adult human brain. The detector is scanned between two sources placed at 4 cm apart and excited by 0-deg and 180-deg phase-shifted RF signals at 200 MHz.1131
Figure 6.17 Single-wavelength (780 nm), 50-MHz phased-array, single sideband (SSB) phase modulation imaging system.1131

Tissue Optics: Light Scattering Methods and Instruments for Medical Diagnosis |
473 |
furthermore, the number of source and detector combinations can be increased simply by moving the source detector pad in two dimensions with respect to its original position by half the minimal distance between source and detector, equal to 2.5 cm. The image pad dimensions are 9 × 4 cm (see the upper left part of Fig. 6.17).
A local oscillator at 1 kHz modulates a 50 MHz SSB transmitter, the RF output of which is connected to a 0/180-deg phase splitter/inverter and then to nine switches appropriate to the nine light sources, which are sequenced at 0- and 180deg phases by 1-Hz switches. The four PMTs are sequentially connected to the 50-MHz SSB receiver (0.5 mV sensitivity), and the audio output at 1 kHz is coupled to a zero-crossing phase detector to give the phase signals in sequence. The phase detector is coupled via a controlling computer to a computer for image computation and display (not shown). The transmitter and receiver are phase locked by RF coupling. The phase noise of the system is less than 0.1 deg (1-Hz bandwidth). A complete set of data from 16 source and detector combinations is obtained every 16 s.
Figure 6.18 illustrates a single-wavelength (780 nm), 50-MHz phased-array image test of neurovascular coupling in human brain. The image represents the increment in phase shift caused by touching the contralateral finger. Calibration
with models verifies that this signal is due to an increase in hemoglobin concentration.1131
A more universal and comprehensive phased-array imaging system that can be used for testing the brain function of neonates is described in Ref. 1132. Singlewavelength laser diode light sources were replaced by a set of two laser diodes (750 and 830 nm, total of 18 lasers) with a 20-mW power source. The wavelength of 780 nm was shifted to 750 nm because at 750 nm the signal gain is more than
Figure 6.18 The image test for an adult human brain (blonde hair) using the 50-MHz phased-array system presented in Fig. 6.17. Parietal stimulation for 48 s by touching a contralateral finger was provided.1131,1133
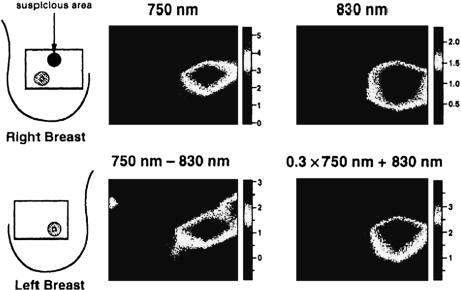

Tissue Optics: Light Scattering Methods and Instruments for Medical Diagnosis |
475 |
6.2.4In vivo measurements, detection limits, and examples of clinical study
Let us consider briefly a few spectroscopy and imaging frequency-domain systems that demonstrate the achievements in the field of optical in vivo diagnostics and that have been applied for clinical studies. It was shown previously that for the accurate evaluation of the absolute absorption and reduced scattering coefficients for a single source-detection position, frequency-dependent measurements of the amplitude and phase of photon-density waves should be provided. Therefore, to obtain quantitative measurements of the absolute optical parameters of various types of tissue, a portable, high-bandwidth (0.3–1000 MHz), multiwavelength (674, 811,
849, and 956 nm) frequency-domain photon migration (FDPM) instrument was designed306,308 (see Fig. 6.20). The key component of an FDPM system is a net-
work analyzer (8753C, Hewlett Packard) that is used to produce modulation sweep in the range of 0.3–1000 MHz. The RF from the network analyzer is superimposed on the direct current of four different diode lasers using individual bias tees and an RF switch. Four 100-μm diameter gradient-index fibers are used to couple each light source to an 8 × 8 optical multiplexer (GP700, DiCon Instruments). Dynamic phase reference and real-time compensation for source fluctuations were provided by an optical tap, which diverts a portion of the source output (5%) to a 1-GHz PIN diode coupled to the network analyzer channel B.
Light is launched onto the tissue under study using up to eight source fibers corresponding to eight source positions. An avalanche photodetector (APD) (C5658, Hamamatsu) is used to detect the diffuse optical signal. Both the APD and probe
Figure 6.20 A multiwavelength, multifrequency, and multichannel frequency-domain spectrometer.306,308


Tissue Optics: Light Scattering Methods and Instruments for Medical Diagnosis |
479 |
A very stable and fast scanning and imaging system that uses the diffraction of diffuse photon density waves is described in Ref. 319. The system consists of an RF-modulated (100 MHz), low-power (about 3 mW) diode laser (786 nm). The source light is fiber guided to the tissue. A detection fiber couples the detected diffuse wave to a fast APD. SSB IQ demodulation electronics were used. The dynamic range of the system is about 2500. The source position was fixed, and a single detection fiber was scanned over a square region 9.3 × 9.3 cm; the amplitude and phase of the photon density wave were recorded at each position for a total of 1024 points. To obtain projection images of hidden macroinhomogeneities in a highly scattering tissue, imaging algorithms based on K-space spectral and fast Fourier transform (FFT) analysis were developed and tested clinically. The FFT approach has yielded clinical projection images with processing times much smaller than current collection times. It was shown that boundary effects present important problems. Matching substances might be used to reduce the boundary effects; nevertheless, the boundary effects may be incorporated in the reconstruction algorithm.
A schematic diagram of an FD optical mammography apparatus (LIMA), developed at Carl Zeiss is shown in Fig. 6.21.325,326 It uses two diode lasers at 690
and 810 nm and the lasers’ intensities are sinusoidally modulated at 110.0010 and 110.008 MHz, respectively. The average power is about 10 mW. Both laser beams (2 mm in diameter) are collimated, made collinear, and directed to the object. An optical fiber (5 mm in diameter) located on the opposite side of the breast delivers light to the detector. A PMT with modulated gain at 110 MHz is used as a detector. The differences in frequencies of light and gain modulation are f1 = 1 kHz (relative to the signal at 690 nm) and f2 = 0.8 kHz (relative to the signal at 810 nm), and are called cross-correlation frequencies. Appropriate electronic filtering allows separation of signals at these frequencies, i.e., at the two wavelengths.
Figure 6.21 Schematic diagram of a frequency-domain mammograph (LIMA).325,326
Copyright 1997 Nat. Acad. Sci., USA
480 |
Continuous Wave and Time-Resolved Spectrometry |
The breast is slightly compressed between two parallel glass plates. The dualwavelength laser beam and the detector fiber are scanned in tandem along the upper and lower plane, respectively, so that source-detection separation is fixed. The entire compression assembly with the two glass plates can be rotated by 90 deg to allow data to be acquired in craniocaudal and mediolateral projections. The extension of the scanning step (the image pixel size) can be set by software, but it is generally defined by the spatial resolution needed, the total acquisition time, and the signal-to-noise ratio. For this system, a scanning step of 1.5 mm in both directions requires a total acquisition time of about 3 min for a whole mammogram and has noise of about 2 deg for phase and 0.1% for amplitude measurements. The boundary effects were overcome using an appropriate algorithm [N (x, y) function] based on the idea of exploring the phase information in a given pixel (x, y) to obtain an estimate of the breast thickness at that pixel. As a second step, the dependence of the amplitude signal on tissue thickness is modeled using the empirically determined dependence on the thickness in the optically homogeneous case. The LIMA system was clinically tested on 15 patients affected by breast cancer.
Two mammograms, x ray and optical (810 nm), for a female left breast with a tumor are presented in Fig. 6.22. A comparison of these mammograms clearly shows that this optical technique has good contrast and tumor detectability, rather than high spatial resolution, which is intrinsically limited by the diffusive nature of light propagation in tissue. The promise of optical imaging methods lies in high contrast, detectability, and specificity, which provide diagnostic capabilities. Further enhancement in contrast can be achieved by introducing additional light sources, wavelengths, modulation frequencies, and/or multiple detectors (see above discussion). In addition to contrast enhancement, FD and TD methods have
the potential to provide an in situ optical biopsy by measuring localized optical properties.306,308
One of the first phase-imaging systems for in vivo studies was designed at the University of Illinois, Urbana-Champaign.328 The optical signal at 760 nm from a mode-locked titanium:sapphire laser (Mira 900, Coherent) was modulated at 160 MHz. Heterodyne mixing at the dynode chain of the PMT produces a crosscorrelation signal (1.25 kHz) carrying the same phase and amplitude information as the original signal. The imaging system provides subsecond data integration times per pixel (104 total pixels, 8 × 8 cm grid in a gradation of 101 steps of 0.8 mm each), resulting in a total measurement time of about 10 min. To partially compensate for limits on the detector’s dynamic range and reduce the influence of boundary effects, the human hand under investigation was immersed in a highly scattering aqueous solution of Liposyn III (20%) (an intravenous fat emulsion) with the scattering and absorption properties approximately matched to those of the hand by diluting the emulsion with water and serial additions of black India ink.
An FD tissue spectrometer described in Ref. 305 uses an arc lamp as a light source that is intensity modulated at 135 MHz by a Pockel’s cell and the heterodyne mixing at the dynode chain of the PMT with a cross-correlation signal at

Tissue Optics: Light Scattering Methods and Instruments for Medical Diagnosis |
481 |
Figure 6.22 (a) X-ray and (b) optical craniocaudal mammograms of a female left breast with a tumor (55-yr-old Caucasian woman with an invasive ductal breast cancer—lateral lower quadrant; the major tumor is 3.0 cm in diameter). The x-ray and optical images cannot be
compared point by point because the degree of compression and the compression geometry are different in the x-ray and optical measurements.325,326 Copyright 1997 Nat. Acad. Sci., USA
100 Hz. For typical signal levels, the noise in this system is dominated by photon shot noise. The effects of the noise can be minimized by using a phased-array configuration with two detectors. For best results, signals from the two detectors should be equalized so that noise in the weaker signal is not dominant. The system can provide, at best, about 4% uncertainty in μa and μs if the signals at the two detectors are equalized. Increasing the modulation depth and frequency allows random errors to be further reduced up to about 1%.
Systematic errors caused by finite tissue volumes and curved surfaces can be much larger than random errors induced by shot noise. As discussed earlier, these systematic errors can presumably be reduced if appropriate scattering and absorbing immersion surrounding a substance is applied or enough informa-
tion about the tissue geometry is available to justify the use of a more corrected algorithm.325,326,328 In vivo measurements made on the femoral biceps muscle of
482 |
Continuous Wave and Time-Resolved Spectrometry |
rabbits show that it is difficult to achieve shot noise limits in practice. The rms values for μa and μs are typically 20% for a 15-s measurement time because the shot noise contribution is estimated to be about 8% in μa and 4% in μs. This means that other sources of variation (tissue blood content or oxygenation, tissue inhomogeneity when scanning, finite source and detection size, uncertainty in their relative positions, etc.) with time were more important than the inherent instrument noise in determining the precision of the μa and μs estimates.
The results of measurements of absorption and reduced scattering coefficients through the forehead on 30 adult volunteers using a multidistance FD NIR spectrometer (Imagent, ISS, Champaign, IL) were reported.1135 The spectrometer employs laser diodes modulated at the frequency of 110 MHz and PMTs whose gain is modulated at a slightly offset frequency of 110.005 MHz to heterodyne the high frequency down to the frequency of 5 kHz. In studies described in Ref. 1135, 33 laser diodes (16 at 758 nm and 16 at 830 nm) and four PMTs were used. The laser diodes were multiplexed so that two lasers with the same wavelength and at the same location were on simultaneously. The light from the lasers was guided by optical fibers with a core diameter of 400 μm to the tissue surface and the photons reemitted from the tissue were collected simultaneously by the fiber bundles with a diameter of 5.6 mm, placed several centimeters apart from the source fibers. The collected light was carried to the PMTs and then the signals from the PMTs were digitally processed to yield the average intensity, modulation amplitude, and phase difference. These data were used for accurate estimation of the absolute absorption and reduced scattering coefficients of the adult brain. It was found that the adult head can be reasonably described by a two-layer model and the nonlinear regression for this model can be used to accurately retrieve the absolute absorption and reduced scattering coefficients of both layers if the thickness
of the scalp/skull is known. For example, optical coefficients of the brain were estimated at 830 nm as μa = 0.145 ± 0.005 cm−1 and μs = 4.1 ± 0.1 cm−1. The
hemoglobin concentration and oxygen saturation of the adult brain were also calculated with sufficiently good accuracy to provide monitoring of cerebral oxygen saturation and hemodynamics in order to assess cerebral health related to tissue oxygen perfusion.
A portable, multiwavelength, FD, NIR spectroscopy instrument similar to that
shown in Fig. 6.14 was used for investigation of the optical properties of the brain in 23 neonates in vivo.1136 It was found that the absorption coefficients of
the infant forehead are lower than the values reported for adults and, being averaged for 23 infants, were equal to μa = 0.078 ± 0.014 cm−1 at 788 nm and μa = 0.089 ± 0.019 cm−1 at 832 nm. A large intersubject variation in μs was also demonstrated, μs = 9.16 ± 1.22 cm−1 at 788 nm and μs = 8.42 ± 1.23 cm−1 at 832 nm. Physiological parameters derived from the absorption coefficients at two wavelengths were determined as the following: the mean total hemoglobin concentration was 39.7 ± 9.8 μM and the mean cerebral blood oxygen saturation was 58.7 ± 11.2%. Therefore, it was shown that the bedside FD, NIR spectroscopy could provide quantitative optical measurement of the infant brain.
Tissue Optics: Light Scattering Methods and Instruments for Medical Diagnosis |
483 |
6.3 Light-scattering spectroscopy
Novel techniques capable of identifing and characterizing pathological changes
in human tissues at the cellular and subcellular levels and based on light scatter-
ing were recently described.47,61,94,95,129,130,150,170,180,450,452,620,731–735,798,811,1137
Light-scattering spectroscopy (LSS) provides structural and functional information of a tissue. This information, in turn, can be used to diagnose and monitor
disease. One important application of biomedical spectroscopy is the noninvasive early detection of cancer in human epithelium.180,452,620,732–734,1137 The enlarg-
ing, crowding, and hyperchromaticity of epithelium cell nuclei are the common features to all types of precancerous and early cancerous conditions. LSS can be used for detection of early cancerous changes and other diseases in a variety of
organs such as esophagus, colon, uterine cervix, oral cavity, lungs, and urinary bladder.452,620,733,734,1137 Eye lens cataract and other ophthalmic diseases can also
be diagnosed using LSS.811
Cells and tissues have complex structures with very a broad range of the scatterers’ sizes: from a few nanometers, the size of a macromolecule, to 7–10 μm, the size of a nucleus, and to 20–50 μm, the size of a cell itself. Most subcellular organelles are not uniform and have complex shapes and structures; nevertheless, they can be referred to as scattering “particles” (see Chapter 1). A great variety of cell organelle structures are small compared to the wavelength. Light scattering by such particles is known as Rayleigh scattering and is characterized by a broad angular distribution and a scattering cross-sectional dependence on the particle’s linear dimension a as a6 and on light wavelength λ as λ−4. When the particle is not small enough, the coupled dipole theory or another approach such as the Rayleigh-Gans approximation (RGA) can be used. The RGA is particularly applicable to particles with sizes comparable to the wavelength and may be useful to study light scattering by small organelles such as mitochondria, lysosomes, etc. For RGA, the scattering in the forward direction prevails, and the total scattering intensity increases with
the increase of the particle relative refractive index m as (m − 1)2 and with its size as a6.
The scattering by a particle with dimensions much larger than the wavelength, such as a cell nucleus, can be described within the framework of van de Hulst approximation that enables obtaining scattering amplitudes in the near-forward direction [see Eq. (2.25)]. For large particles, the scattered intensity is highly forward directed and the width of the first scattering lobe is about λ/a; the larger the particle, the stronger and narrower the first lobe. The intensity of the forward scattering, exhibits oscillations with the wavelength change. The origin of these oscillations is interference between the light ray passing through the center of the particle and one not interacting with it. The frequency of these oscillations is proportional to a(m − 1), so it increases with the particle size and refractive index. The intensity of scattered light also peaks in the near-backward direction, but this peak is significantly smaller than the forward-scattering peak.

484 |
Continuous Wave and Time-Resolved Spectrometry |
These results agree well with the rigorous scattering theory developed for the spherical particles (Mie theory).148 To discriminate cell structure peculiarities, originated by the pathology, the difference in light scattering can be used. Structures with large dimensions and high refractive index produce a scattered field that peaks in the forward and near-backward directions in contrast to smaller
and more optically “soft” structures, which scatter light more uniformly. Perelman et al.150,180,620,732 studied elastic light scattering from densely packed layers of nor-
mal and T84 tumor human intestinal cells affixed to glass slides in a buffer solution (see Fig. 1.2). The diameters of the normal cell nuclei ranged from 5 to 7 μm, and those of the tumor cells from 7 to 16 μm. The reflectance from the samples exhibits distinct spectral features. The predictions of Mie theory were fit to the observed spectra. The fitting procedure used three parameters, average size of the nucleus, standard deviation in size (a Gaussian size distribution was assumed), and relative refractive index. The solid line of Fig. 6.23 is the distribution extracted from the data, and the dashed line shows the corresponding size distributions measured by light microscopy. The extracted and measured distributions for both normal and T84 cell samples were in good agreement, indicating the validity of the physical picture and the accuracy of the method of extracting information.
Figure 6.23 Nuclear size distributions of the samples presented in Fig. 1.2. (a) Normal intestinal cells; (b) T84 cells. In each case, the solid line is the distribution extracted from the data using Mie theory, and the dashed line is the distribution measured using light microscopy (from Ref. 180).
In tissues, the photons returned after a single scattering in the backward or near-backward directions produce a so-called single-scattering component. The photons returned after multiple scattering events produce diffuse reflectance. The spectra of both single-scattering and diffusive signals contain valuable information about tissue properties. However, the type of information is different. The singlescattering component is sensitive to the morphology of the upper tissue layer, which in the case of any mucosal tissue almost always includes or is limited by the epithelium. Its spectroscopic features are related to the microarchitecture of the epithelial cells, and the sizes, shapes, and refractive indices of their organelles, inclusions, and suborganellar components and inhomogeneities. Thus, analysis of
Tissue Optics: Light Scattering Methods and Instruments for Medical Diagnosis |
485 |
this component might be useful in diagnosing diseases limited to the epithelium,
such as preinvasive stages of epithelial cancers, dysplasias, and carcinomas in situ (CIS).180,620,732,733,1137 The diffusive component contains information about tissue
scatterers and absorbers as well, and its diagnostical possibilities and instrumentation are discussed early in this chapter.
The single-scattering component is more important in diagnosing the initial stages of epithelial precancerous lesions, while the diffusive component carries valuable information about more advanced stages of the disease. However, singlescattering events cannot be directly observed in in vivo tissues, because only a small portion of the light incident on the tissue is directly backscattered.
Several methods to distinguish single scattering have been proposed. Fieldbased light-scattering spectroscopy735 and spectroscopic optical coherence tomography (OCT)142 were developed for performing cross-sectional tomographic and spectroscopic imaging. In these extensions of conventional OCT, information on the spectral content of backscattered light is obtained by detection and processing of the interferometric OCT signal. These methods allow the spectrum of backscattered light to be measured either for several discreet wavelengths734 or over the entire available optical bandwidth from 650 to 1000 nm simultaneously in a single measurement.142
A much simpler polarization-sensitive technique based on the fact that initially polarized light loses its polarization when traversing a turbid tissue is also available.150 The conventional spatially resolved backscattering technique with enough small source-detector separation can be used as well.180 In that case, the single-scattering component (2–5%) should be subtracted from the total reflectance spectra, which can be done using the diffusion approximation-based model by fitting to the coarse features of the diffusive component.
Zonios et al. studied the capability of diffuse reflectance spectroscopy to diagnose colonic precancerous lesions and adenomatous polyps in vivo.735 Figure 6.24 shows typical diffuse reflectance spectra from one adenomatous polyp site and one normal mucosa site. Significant spectral differences are readily observed, particularly in the short-wavelength region of the spectrum, where the hemoglobin absorption valley around 420 nm stands out as the prominent spectral feature. This valley is much more prominent in the spectrum of the adenomatous polyp. This feature, as well as more prominent dips around 542 and 577 nm, which are characteristic of hemoglobin absorption as well, are all indicative of the increased hemoglobin presence in the adenomatous tissue.
Apparently, the differences between these spectra are due to changes in the scattering and absorption properties of the tissues. Both the absorption dips and the slopes of the spectra are sensitive functions of the absorption and scattering coefficients, providing a natural way to introduce an inverse algorithm that is sensitive to such features. The authors quantified the absorption and scattering properties using the diffusion-based model discussed in Section 1.1.2. The equation735 analog to Eq. (1.27) was fit to the data using the Levenberg-Marquardt minimization method. Thus, the total hemoglobin concentration cHb and hemoglobin oxygen saturation
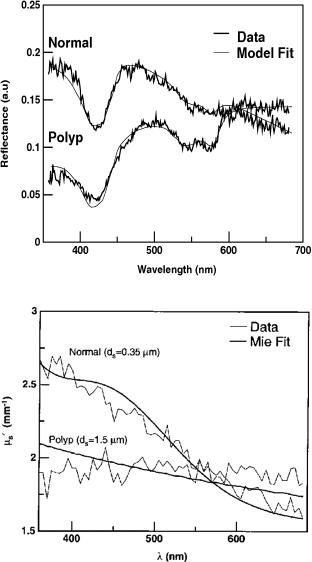
486 |
Continuous Wave and Time-Resolved Spectrometry |
(a)
(b)
Figure 6.24 Diffuse reflectance analysis: (a) measured reflectance spectra (noisy lines) and modeled fits (smooth lines); (b) scattering spectra obtained from the reflectance measurements (noisy curves) and corresponding Mie theory spectra (smooth curves). The effective scatterer sizes ds are indicated (from Refs. 732 and 735).
α were obtained. Also, the optimal reduced scattering coefficient μs(λ) was found for each wavelength λ, ranging from 360 to 685 nm. It was found that μs(λ) has a spectral dependence that resembles a straight line declining with wavelength λ. The slope of μs(λ) decreases with an increasing effective size of the scatterers, ds [Fig. 6.24(b)]. This allows the effective scatterer size to be determined from
Tissue Optics: Light Scattering Methods and Instruments for Medical Diagnosis |
487 |
known μs(λ). The model fits shown in Fig. 6.24(a) are in very good agreement with the experimental data.
The promise of LSS to diagnose dysplasia and CIS was tested in in vivo human studies in four different organs and in three different types of epithelium: columnar epithelia of the colon and Barrett’s esophagus, transitional epithelium of the urinary bladder, and stratified squamous epithelium of the oral cavity.733 All clinical studies were performed during routine endoscopic screening or surveillance procedures. In all of the studies, an optical fiber probe delivered white light from a xenon arc lamp to the tissue surface and collected the returned light. The probe tip was brought into gentle contact with the tissue to be studied. Immediately after the measurement, a biopsy was taken from the same tissue site. The spectrum of the reflected light was analyzed and the nuclear size distribution determined. Both dysplasia and CIS have a higher percentage of enlarged nuclei and, on average, a higher population density, which can be used as the basis for spectroscopic tissue diagnosis.