


ADS8339
SBAS677A –JUNE 2014–REVISED OCTOBER 2014 |
www.ti.com |
7.7 Typical Characteristics
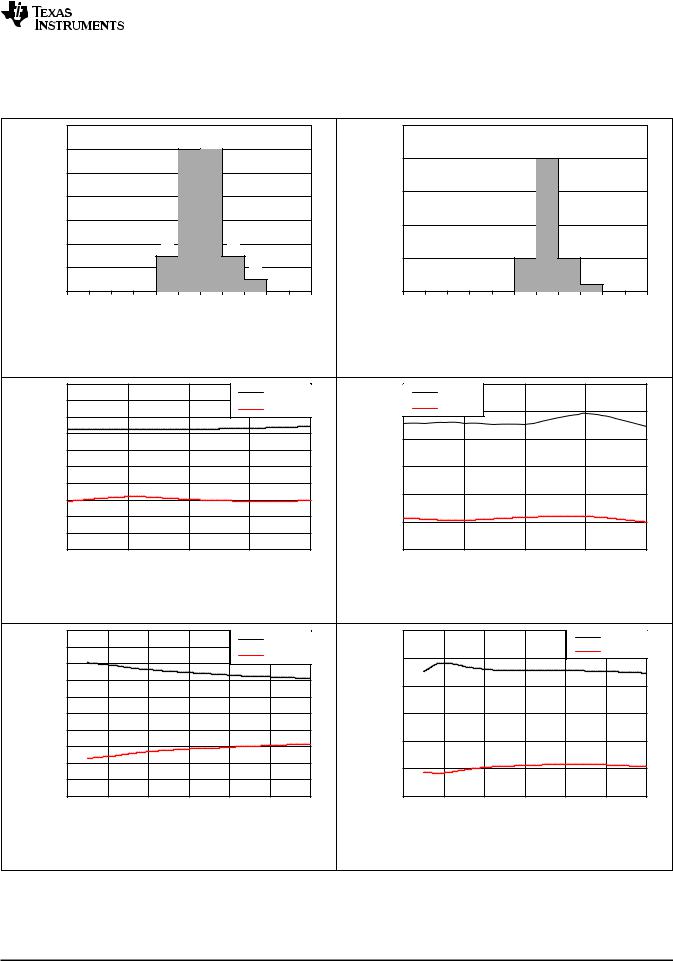
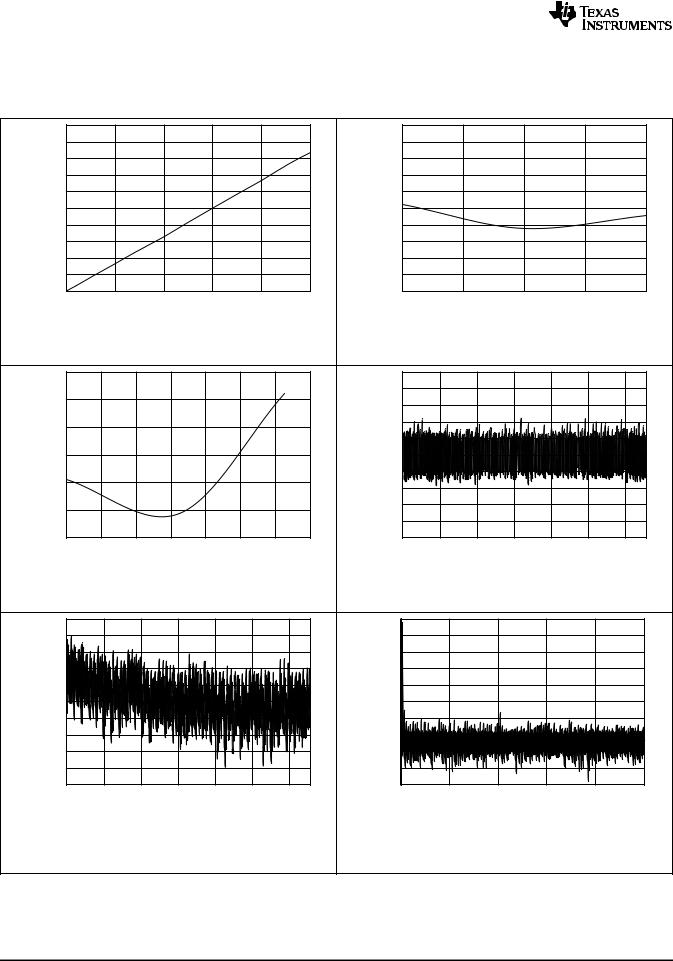
At TA = 30°C, +VA = 5 V, +VBD = 2.7 V, Vref = 4.096 V, and fsample = 250 kHz, unless otherwise noted.
|
±0.2 |
|
±0.25 |
(mV) |
±0.3 |
|
|
Error |
±0.35 |
|
|
Offset |
±0.4 |
|
|
|
±0.45 |
|
±0.5 |
|
4.5 |
4.75 |
|
5 |
|
5.25 |
5.5 |
|
|
|
Supply Voltage (V) |
|
|
C001 |
|
|
+VBD = 2.7 V, Vref = 4.096 V, fS = 250 kSPS, TA = 30°C |
|
|||||
|
|
Figure 1. Offset Error vs Supply Voltage |
|
||||
|
0 |
|
|
|
|
|
|
|
±0.05 |
|
|
|
|
|
|
(mV) |
±0.1 |
|
|
|
|
|
|
±0.15 |
|
|
|
|
|
|
|
Error |
|
|
|
|
|
|
|
±0.2 |
|
|
|
|
|
|
|
Offset |
|
|
|
|
|
|
|
±0.25 |
|
|
|
|
|
|
|
|
|
|
|
|
|
|
|
|
±0.3 |
|
|
|
|
|
|
|
±0.35 |
|
|
|
|
|
|
|
2 |
2.5 |
3 |
3.5 |
4 |
4.5 |
5 |
|
|
|
Reference Voltage (V) |
|
C003 |
||
+VBD = 2.7 V, +VA = 5 V, fS = 250 kSPS, TA = 30°C
Figure 3. Offset Error vs Reference Voltage
|
0 |
|
|
±0.1 |
|
|
±0.2 |
|
(mV) |
±0.3 |
|
±0.4 |
||
Error |
||
±0.5 |
||
Offset |
||
±0.6 |
||
|
||
|
±0.7 |
|
|
±0.8 |
|
|
±0.9 |
|
|
±1 |
±40 |
±20 |
0 |
20 |
40 |
60 |
80 |
100 |
|
|
Free-Air Temperature (ƒC) |
|
C005 |
|||
+VBD = 2.7 V, +VA = 5 V, Vref = 5 V, fS = 250 kSPS
Figure 5. Offset Error vs Free-Air Temperature
|
0.005 |
|
|
|
|
|
|
|
0.0045 |
|
|
|
|
|
|
|
0.004 |
|
|
|
|
|
|
(%FSR) |
0.0035 |
|
|
|
|
|
|
0.003 |
|
|
|
|
|
|
|
0.0025 |
|
|
|
|
|
|
|
Error |
|
|
|
|
|
|
|
0.002 |
|
|
|
|
|
|
|
Gain |
|
|
|
|
|
|
|
0.0015 |
|
|
|
|
|
|
|
|
0.001 |
|
|
|
|
|
|
|
0.0005 |
|
|
|
|
|
|
|
0 |
|
|
|
|
|
|
|
4.5 |
4.75 |
|
5 |
|
5.25 |
5.5 |
|
|
|
Supply Voltage (V) |
|
|
C002 |
|
|
+VBD = 2.7 V, Vref = 4.096 V, fS = 250 kSPS, TA = 30°C |
|
|||||
|
|
Figure 2. Gain Error vs Supply Voltage |
|
||||
|
0.0045 |
|
|
|
|
|
|
|
0.004 |
|
|
|
|
|
|
|
0.0035 |
|
|
|
|
|
|
(%FSR) |
0.003 |
|
|
|
|
|
|
0.0025 |
|
|
|
|
|
|
|
Error |
0.002 |
|
|
|
|
|
|
|
|
|
|
|
|
|
|
Gain |
0.0015 |
|
|
|
|
|
|
|
|
|
|
|
|
|
|
|
0.001 |
|
|
|
|
|
|
|
0.0005 |
|
|
|
|
|
|
|
0 |
|
|
|
|
|
|
|
2 |
2.5 |
3 |
3.5 |
4 |
4.5 |
5 |
|
|
|
Reference Voltage (V) |
|
C004 |
||
+VBD = 2.7 V, +VA = 5 V, fS = 250 kSPS, TA = 30°C
Figure 4. Gain Error vs Reference Voltage
|
0.01 |
|
|
0.009 |
|
(%FSR) |
0.008 |
|
0.007 |
||
|
||
|
0.006 |
|
Error |
0.005 |
|
0.004 |
||
Gain |
||
0.003 |
||
|
0.002 |
|
|
0.001 |
|
|
0 |
±40 |
±20 |
0 |
20 |
40 |
60 |
80 |
100 |
|
|
Free-Air Temperature (ƒC) |
|
C006 |
|||
+VBD = 2.7 V, +VA = 5 V, Vref = 5 V, fS = 250 kSPS
Figure 6. Gain Error vs Free-Air Temperature
8 |
Submit Documentation Feedback |
Copyright © 2014, Texas Instruments Incorporated |
Product Folder Links: ADS8339
ADS8339
www.ti.com |
SBAS677A –JUNE 2014 –REVISED OCTOBER 2014 |
Typical Characteristics (continued)
At TA = 30°C, +VA = 5 V, +VBD = 2.7 V, Vref = 4.096 V, and fsample = 250 kHz, unless otherwise noted. |
|
|
|
|
|||||||||||||||||||
|
14 |
|
|
|
|
|
|
|
|
|
|
|
25 |
|
|
|
|
|
|
|
|
|
|
|
|
|
|
|
|
12 |
12 |
|
|
|
|
|
|
|
|
|
|
|
|
|
|
|
|
|
12 |
|
|
|
|
|
|
|
|
|
|
|
20 |
|
|
|
|
|
20 |
|
|
|
|
|
|
|
|
|
|
|
|
|
|
|
|
|
|
|
|
|
|
|
|
|
|
|
|
Devices |
10 |
|
|
|
|
|
|
|
|
|
|
Devices |
|
|
|
|
|
|
|
|
|
|
|
8 |
|
|
|
|
|
|
|
|
|
|
15 |
|
|
|
|
|
|
|
|
|
|
||
of |
|
|
|
|
|
|
|
|
|
|
|
of |
|
|
|
|
|
|
|
|
|
|
|
Number |
6 |
|
|
|
|
|
|
|
|
|
|
Number |
10 |
|
|
|
|
|
|
|
|
|
|
|
|
|
|
|
|
|
|
|
|
|
|
|
|
|
|
|
|
|
|
|
|||
4 |
|
|
|
3 |
|
|
3 |
|
|
|
|
|
|
|
|
5 |
|
5 |
|
|
|
||
|
|
|
|
|
|
|
|
|
|
|
|
|
|
|
|
|
|
|
|
|
|
||
|
2 |
|
|
|
|
|
|
|
|
|
|
|
5 |
|
|
|
|
|
|
|
|
|
|
|
|
|
|
|
|
|
|
1 |
|
|
|
|
|
|
|
|
|
|
|
1 |
|
|
|
|
0 |
0 |
0 |
0 |
|
|
|
|
|
0 |
0 |
|
0 |
0 |
0 |
0 |
0 |
|
|
|
0 |
0 |
|
|
|
|
|
|
|
|
|
|
|
|
|||||||||||||
|
0 |
|
|
|
|
0 |
0.1 |
0.2 |
0.3 |
0.4 |
0.5 |
|
0 |
|
|
|
|
0 |
0.1 |
0.2 |
0.3 |
0.4 |
0.5 |
|
±0.5 |
±0.4 |
±0.3 |
±0.2 |
±0.1 |
|
±0.5 |
±0.4 |
±0.3 |
±0.2 |
±0.1 |
||||||||||||
|
|
|
|
|
|
ppm/ƒC |
|
|
|
|
|
|
|
|
|
|
|
ppm/ƒC |
|
|
|
|
|
|
|
|
|
|
|
|
|
|
|
|
C007 |
|
|
|
|
|
|
|
|
|
|
|
C008 |
|
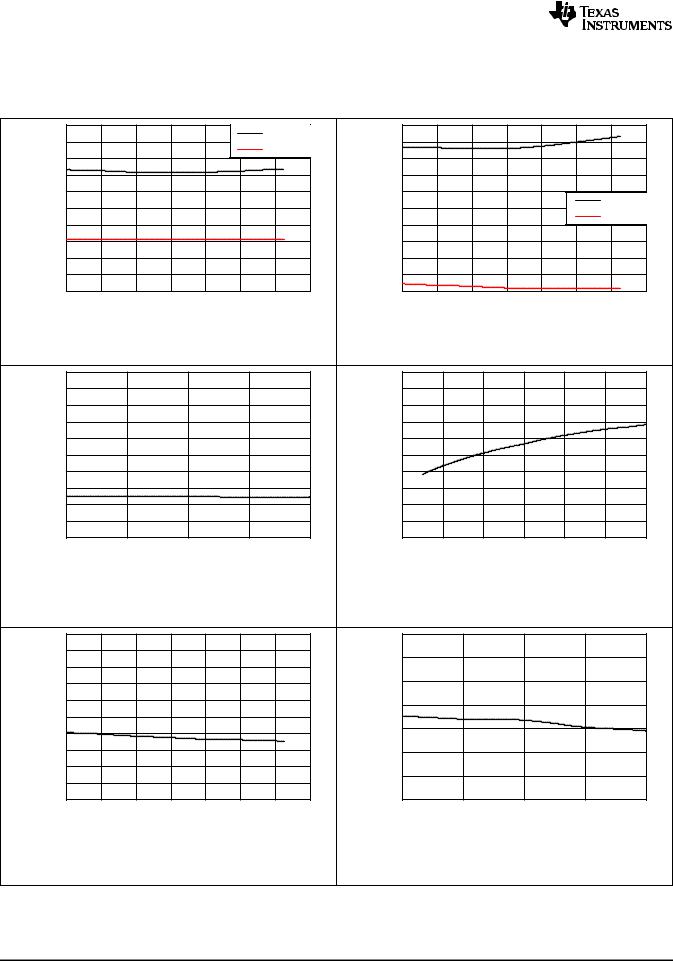
+VBD = 2.7 V, +VA = 5 V, fS = 250 kSPS |
|
|
|
+VBD = 2.7 V, +VA = 5 V, Vref = 5 V, fS = 250 kSPS |
|
|||||||||||||||||
|
|
Figure 7. Gain Error Drift Histogram |
|
|
|
Figure 8. Offset Error Drift Histogram |
|
||||
|
11. |
|
|
DNL Max |
|
|
1.5 |
INL Max |
|
|
|
|
0.8 |
|
|
|
|
|
|
|
|
||
NonlinearityDifferential(LSBs) |
|
|
DNL Min |
|
|
|
INL Min |
|
|
|
|
0.6 |
|
|
|
NonlinearityIntegral(LSBs) |
1. |
|
|
|
|||
|
|
|
|
1 |
|
|
|
|
|||
0.4 |
|
|
|
|
±1 |
|
|
|
|
||
|
|
|
|
|
|
|
0.5 |
|
|
|
|
|
0.2 |
|
|
|
|
|
|
|
|
|
|
|
00. |
|
|
|
|
|
00. |
|
|
|
|
|
±0.2 |
|
|
|
|
|
|
|
|
|
|
|
±0.4 |
|
|
|
|
|
±0.5 |
|
|
|
|
|
|
|
|
|
|
|
|
|
|
|
|
|
±0.6 |
|
|
|
|
|
|
|
|
|
|
|
±0.8 |
|
|
|
|
|
|
|
|
|
|
|
±1 |
|
|
|
|
|
±1.5 |
|
|
|
|
|
4.5 |
4.75 |
5 |
5.25 |
5.5 |
|
4.5 |
4.75 |
5 |
5.25 |
5.5 |
|
|
|
Supply Voltage (V) |
|
C009 |
|
|
|
Supply Voltage (V) |
|
C010 |
|
+VBD = 2.7 V, Vref = 4.096 V, fS = 250 kSPS, TA = 30°C |
|
|
+VBD = 2.7 V, Vref = 4.096 V, fS = 250 kSPS, TA = 30°C |
|
||||||
|
|
Figure 9. DNL vs Supply Voltage |
|
|
|
Figure 10. INL vs Supply Voltage |
|
||||||||
|
1. |
|
|
|
|
|
|
|
1.5 |
|
|
|
|
|
|
|
1 |
|
|
|
|
DNL Max |
|
|
|
|
|
|
|
INL Max |
|
|
0.8 |
|
|
|
|
|
|
|
|
|
|
|
|
||
NonlinearityDifferential(LSBs) |
|
|
|
|
DNL Min |
|
|
|
|
|
|
|
DNL Min |
|
|
|
|
|
|
|
|
NonlinearityIntegral(LSBs) |
1. |
|
|
|
|
|
|||
0.6 |
|
|
|
|
|
|
|
|
|
|
|
||||
|
|
|
|
|
|
1 |
|
|
|
|
|
|
|||
0.4 |
|
|
|
|
|
|
±1 |
|
|
|
|
|
|
||
|
|
|
|
|
|
|
|
|
0.5 |
|
|
|
|
|
|
|
0.2 |
|
|
|
|
|
|
|
|
|
|
|
|
|
|
|
0. |
|
|
|
|
|
|
|
00. |
|
|
|
|
|
|
|
0 |
|
|
|
|
|
|
|
|
|
|
|
|
|
|
|
±0.2 |
|
|
|
|
|
|
|
|
|
|
|
|
|
|
|
±0.4 |
|
|
|
|
|
|
|
±0.5 |
|
|
|
|
|
|
|
|
|
|
|
|
|
|
|
|
|
|
|
|
|
|
|
±0.6 |
|
|
|
|
|
|
|
|
|
|
|
|
|
|
|
±0.8 |
|
|
|
|
|
|
|
|
|
|
|
|
|
|
|
±1 |
|
|
|
|
|
|
|
±1.5 |
|
|
|
|
|
|
|
2 |
2.5 |
3 |
3.5 |
4 |
4.5 |
5 |
|
2 |
2.5 |
3 |
3.5 |
4 |
4.5 |
5 |
|
|
|
Reference Voltage (V) |
|
C011 |
|
|
|
Reference Voltage (V) |
|
C012 |
||||
|
+VBD = 2.7 V, +VA = 5 V, fS = 250 kSPS, TA = 30°C |
|
|
+VBD = 2.7 V, +VA = 5 V, fS = 250 kSPS, TA = 30°C |
|
||||||||||
|
|
Figure 11. DNL vs Reference Voltage |
|
|
|
Figure 12. INL vs Reference Voltage |
|
||||||||
Copyright © 2014, Texas Instruments Incorporated |
Submit Documentation Feedback |
9 |
Product Folder Links: ADS8339
ADS8339
SBAS677A –JUNE 2014–REVISED OCTOBER 2014 |
www.ti.com |
Typical Characteristics (continued)
At TA = 30°C, +VA = 5 V, +VBD = 2.7 V, Vref = 4.096 V, and fsample = 250 kHz, unless otherwise noted.
|
1. |
|
|
1 |
|
|
DNL Max |
|
(LSBs) |
0.8 |
|
DNL Min |
||
|
0.6 |
|
Nonlinearity |
0.4 |
|
0.2 |
||
|
||
|
00. |
|
Differential |
±0.2 |
|
±0.4 |
||
|
||
|
±0.6 |
|
|
±0.8 |
|
|
±1 |
|
±40 |
±20 |
0 |
20 |
40 |
60 |
80 |
100 |
|
|
|
Free-Air Temperature (ƒC) |
|
C013 |
|||
|
+VBD = 2.7 V, +VA = 5 V, Vref = 5 V, fS = 250 kSPS |
|
||||||
|
|
Figure 13. DNL vs Free-Air Temperature |
|
|||||
|
16 |
|
|
|
|
|
|
|
(LSBs) |
15.9 |
|
|
|
|
|
|
|
15.8 |
|
|
|
|
|
|
|
|
|
|
|
|
|
|
|
|
|
Bits |
15.7 |
|
|
|
|
|
|
|
15.6 |
|
|
|
|
|
|
|
|
Of |
|
|
|
|
|
|
|
|
|
|
|
|
|
|
|
|
|
Number |
15.5 |
|
|
|
|
|
|
|
|
|
|
|
|
|
|
|
|
Effective |
15.4 |
|
|
|
|
|
|
|
15.3 |
|
|
|
|
|
|
|
|
|
|
|
|
|
|
|
|
|
|
15.2 |
|
|
|
|
|
|
|
|
15.1 |
|
|
|
|
|
|
|
|
15 |
|
|
|
|
|
|
|
|
4.5 |
|
4.75 |
5 |
|
5.25 |
|
5.5 |
|
|
|
|
Supply Voltage (V) |
|
|
C015 |
|
|
+VBD = 2.7 V, Vref = 5 V, fIN = 1.9 kHz, fS = 250 kSPS, |
|
||||||
|
|
|
|
TA = 30°C |
|
|
|
|
|
|
Figure 15. ENOB vs Supply Voltage |
|
|||||
|
16 |
|
|
|
|
|
|
|
(LSBs) |
15.9 |
|
|
|
|
|
|
|
15.8 |
|
|
|
|
|
|
|
|
|
|
|
|
|
|
|
|
|
Bits |
15.7 |
|
|
|
|
|
|
|
15.6 |
|
|
|
|
|
|
|
|
Of |
|
|
|
|
|
|
|
|
|
|
|
|
|
|
|
|
|
Number |
15.5 |
|
|
|
|
|
|
|
|
|
|
|
|
|
|
|
|
Effective |
15.4 |
|
|
|
|
|
|
|
15.3 |
|
|
|
|
|
|
|
|
|
|
|
|
|
|
|
|
|
|
15.2 |
|
|
|
|
|
|
|
|
15.1 |
|
|
|
|
|
|
|
|
15 |
|
|
|
|
|
|
|
|
±40 |
±20 |
0 |
20 |
40 |
60 |
80 |
100 |
|
|
|
Free-Air Temperature (ƒC) |
|
C017 |
|||
+VBD = 2.7 V, +VA = 5 V, Vref = 5 V, fIN = 1.9 kHz, fS = 250 kSPS
Figure 17. ENOB vs Free-Air Temperature
|
1. |
|
1 |
(LSBs) |
0.8 |
0.4 |
|
Nonlinearity |
0.6 |
±0.2 |
|
|
0.2 |
|
INL Max |
|
0. |
|
0 |
Integral |
INL Min |
±0.6 |
|
|
±0.4 |
|
±0.8 |
|
±1 |
|
±40 |
±20 |
0 |
20 |
40 |
60 |
80 |
100 |
|
|
|
Free-Air Temperature (ƒC) |
|
C014 |
|||
|
+VBD = 2.7 V, +VA = 5 V, Vref = 5 V, fS = 250 kSPS |
|
||||||
|
|
Figure 14. INL vs Free-Air Temperature |
|
|||||
|
16 |
|
|
|
|
|
|
|
(LSBs) |
15.8 |
|
|
|
|
|
|
|
15.6 |
|
|
|
|
|
|
|
|
15.4 |
|
|
|
|
|
|
|
|
Bits |
|
|
|
|
|
|
|
|
15.2 |
|
|
|
|
|
|
|
|
Of |
|
|
|
|
|
|
|
|
|
|
|
|
|
|
|
|
|
Number |
15 |
|
|
|
|
|
|
|
14.8 |
|
|
|
|
|
|
|
|
|
|
|
|
|
|
|
|
|
Effective |
14.6 |
|
|
|
|
|
|
|
14.4 |
|
|
|
|
|
|
|
|
14.2 |
|
|
|
|
|
|
|
|
|
|
|
|
|
|
|
|
|
|
14 |
|
|
|
|
|
|
|
|
2 |
2.5 |
3 |
|
3.5 |
4 |
4.5 |
5 |
|
|
|
Reference Voltage (V) |
|
C016 |
|||
+VBD = 2.7 V, +VA = 5 V, fIN = 1.9 kHz, fS = 250 kSPS, TA = 30°C
Figure 16. ENOB vs Reference Voltage
|
119 |
|
(dB) |
117 |
|
Range |
115 |
|
Dynamic |
113 |
|
|
||
-Free |
111 |
|
109 |
||
Spurious |
||
107 |
||
|
||
|
105 |
4.5 |
4.75 |
5 |
5.25 |
5.5 |
|
|
Supply Voltage (V) |
|
C018 |
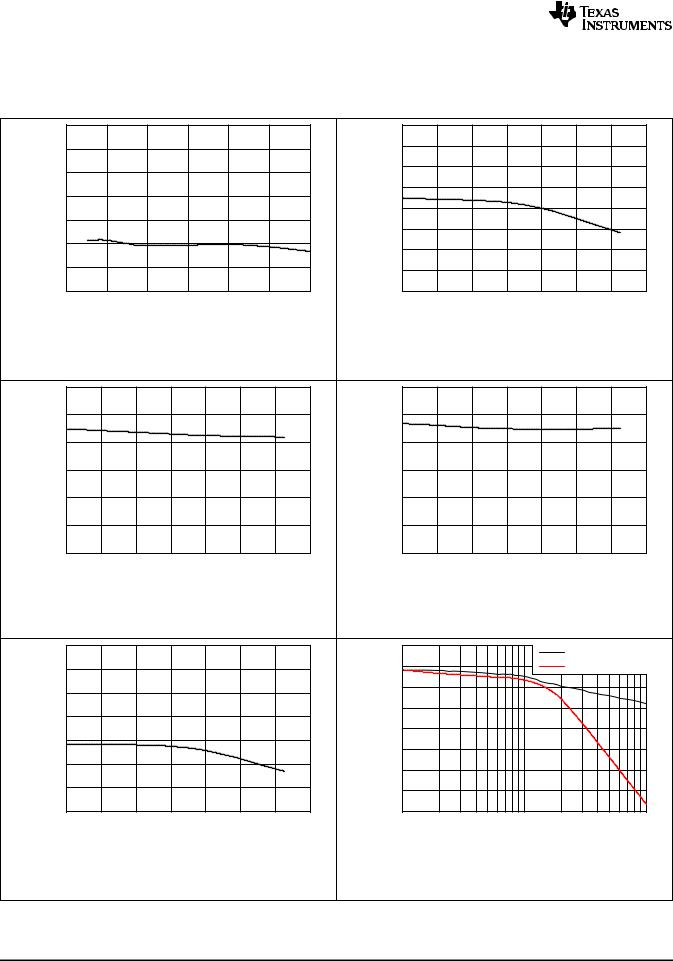
+VBD = 2.7 V, Vref = 4.096 V, fIN = 1.9 kHz, fS = 250 kSPS,
TA = 30°C
Figure 18. SFDR vs Supply Voltage
10 |
Submit Documentation Feedback |
Copyright © 2014, Texas Instruments Incorporated |
Product Folder Links: ADS8339
ADS8339
www.ti.com |
SBAS677A –JUNE 2014 –REVISED OCTOBER 2014 |
Typical Characteristics (continued)
At TA = 30°C, +VA = 5 V, +VBD = 2.7 V, Vref = 4.096 V, and fsample = 250 kHz, unless otherwise noted.
|
94.5 |
|
|
|
|
|
|
(dB) |
94 |
|
|
|
|
|
|
Distortion |
|
|
|
|
|
|
|
93.5 |
|
|
|
|
|
|
|
and |
|
|
|
|
|
|
|
Noise-to- |
93 |
|
|
|
|
|
|
|
|
|
|
|
|
|
|
Signal |
92.5 |
|
|
|
|
|
|
|
|
|
|
|
|
|
|
|
92 |
|
|
|
|
|
|
|
4.5 |
4.75 |
|
5 |
|
5.25 |
5.5 |
|
|
|
Supply Voltage (V) |
|
|
C019 |
|
+VBD = 2.7 V, Vref = 4.096 V, fIN = 1.9 kHz, fS = 250 kSPS, |
|||||||
|
|
|
TA = 30°C |
|
|
|
|
|
|
Figure 19. SINAD vs Supply Voltage |
|
||||
|
119 |
|
|
|
|
|
|
(dB) |
117 |
|
|
|
|
|
|
|
|
|
|
|
|
|
|
Distortion |
115 |
|
|
|
|
|
|
|
|
|
|
|
|
|
|
Harmonic |
113 |
|
|
|
|
|
|
111 |
|
|
|
|
|
|
|
|
|
|
|
|
|
|
|
Total |
109 |
|
|
|
|
|
|
107 |
|
|
|
|
|
|
|
|
|
|
|
|
|
|
|
|
105 |
|
|
|
|
|
|
|
4.5 |
4.75 |
|
5 |
|
5.25 |
5.5 |
|
|
|
Supply Voltage (V) |
|
|
C021 |
|
+VBD = 2.7 V, Vref = 4.096 V, fIN = 1.9 kHz, fS = 250 kSPS, |
|||||||
|
|
|
TA = 30°C |
|
|
|
|
|
|
Figure 21. THD vs Supply Voltage |
|
||||
(dB) |
95 |
|
|
|
|
|
|
94.5 |
|
|
|
|
|
|
|
|
|
|
|
|
|
|
|
Distortion |
94 |
|
|
|
|
|
|
93 |
|
|
|
|
|
|
|
|
93.5 |
|
|
|
|
|
|
and |
92.5 |
|
|
|
|
|
|
Noise-to- |
92 |
|
|
|
|
|
|
|
|
|
|
|
|
|
|
Signal |
91.5 |
|
|
|
|
|
|
90.5 |
|
|
|
|
|
|
|
|
91 |
|
|
|
|
|
|
|
90 |
|
|
|
|
|
|
|
2 |
2.5 |
3 |
3.5 |
4 |
4.5 |
5 |
|
|
|
Reference Voltage (V) |
|
C023 |
||
+VBD = 2.7 V, +VA = 5 V, fIN = 1.9 kHz, fS = 250 kSPS, TA = 30°C
Figure 23. SINAD vs Reference Voltage
|
94.5 |
|
|
|
|
|
|
Ratio (dB) |
94 |
|
|
|
|
|
|
93.5 |
|
|
|
|
|
|
|
to--Noise |
93 |
|
|
|
|
|
|
|
|
|
|
|
|
|
|
Signal |
92.5 |
|
|
|
|
|
|
|
92 |
|
|
|
|
|
|
|
4.5 |
4.75 |
|
5 |
|
5.25 |
5.5 |
|
|
|
Supply Voltage (V) |
|
|
C020 |
|
+VBD = 2.7 V, Vref = 4.096 V, fIN = 1.9 kHz, fS = 250 kSPS, |
|||||||
|
|
|
TA = 30°C |
|
|
|
|
|
|
Figure 20. SNR vs Supply Voltage |
|
||||
|
119 |
|
|
|
|
|
|
(dB) |
117 |
|
|
|
|
|
|
Range |
115 |
|
|
|
|
|
|
Dynamic |
113 |
|
|
|
|
|
|
|
|
|
|
|
|
|
|
-Free |
111 |
|
|
|
|
|
|
109 |
|
|
|
|
|
|
|
Spurious |
|
|
|
|
|
|
|
107 |
|
|
|
|
|
|
|
|
|
|
|
|
|
|
|
|
105 |
|
|
|
|
|
|
|
2 |
2.5 |
3 |
3.5 |
4 |
4.5 |
5 |
|
|
|
Reference Voltage (V) |
|
C022 |
||
+VBD = 2.7 V, +VA = 5 V, fIN = 1.9 kHz, fS = 250 kSPS, TA = 30°C
Figure 22. SFDR vs Reference Voltage
|
95 |
|
|
|
|
|
|
|
94.5 |
|
|
|
|
|
|
(dB) |
94 |
|
|
|
|
|
|
93.5 |
|
|
|
|
|
|
|
Ratio |
|
|
|
|
|
|
|
93 |
|
|
|
|
|
|
|
Noise-to- |
92.5 |
|
|
|
|
|
|
|
|
|
|
|
|
|
|
Signal |
92 |
|
|
|
|
|
|
91 |
|
|
|
|
|
|
|
|
91.5 |
|
|
|
|
|
|
|
90.5 |
|
|
|
|
|
|
|
90 |
|
|
|
|
|
|
|
2 |
2.5 |
3 |
3.5 |
4 |
4.5 |
5 |
|
|
|
Reference Voltage (V) |
|
C024 |
||
+VBD = 2.7 V, +VA = 5 V, fIN = 1.9 kHz, fS = 250 kSPS, TA = 30°C
Figure 24. SNR vs Reference Voltage
Copyright © 2014, Texas Instruments Incorporated |
Submit Documentation Feedback |
11 |
Product Folder Links: ADS8339
ADS8339
SBAS677A –JUNE 2014–REVISED OCTOBER 2014 |
www.ti.com |
Typical Characteristics (continued)
At TA = 30°C, +VA = 5 V, +VBD = 2.7 V, Vref = 4.096 V, and fsample = 250 kHz, unless otherwise noted.
|
119 |
|
|
|
|
|
|
(dB) |
117 |
|
|
|
|
|
|
|
|
|
|
|
|
|
|
Distortion |
115 |
|
|
|
|
|
|
|
|
|
|
|
|
|
|
Harmonic |
113 |
|
|
|
|
|
|
111 |
|
|
|
|
|
|
|
|
|
|
|
|
|
|
|
Total |
109 |
|
|
|
|
|
|
107 |
|
|
|
|
|
|
|
|
|
|
|
|
|
|
|
|
105 |
|
|
|
|
|
|
|
2 |
2.5 |
3 |
3.5 |
4 |
4.5 |
5 |
|
|
|
Reference Voltage (V) |
|
C025 |
||
+VBD = 2.7 V, +VA = 5 V, fIN = 1.9 kHz, fS = 250 kSPS, TA = 30°C
Figure 25. THD vs Reference Voltage
|
96 |
|
|
|
|
|
|
|
(dB) |
95 |
|
|
|
|
|
|
|
Distortionand |
|
|
|
|
|
|
|
|
93 |
|
|
|
|
|
|
|
|
|
94 |
|
|
|
|
|
|
|
-to-Noise |
92 |
|
|
|
|
|
|
|
Signal |
91 |
|
|
|
|
|
|
|
|
|
|
|
|
|
|
|
|
|
90 |
|
|
|
|
|
|
|
|
±40 |
±20 |
0 |
20 |
40 |
60 |
80 |
100 |
|
|
|
Free-Air Temperature (ƒC) |
|
C027 |
|||
|
+VBD = 2.7 V, +VA = 5 V, Vref = 5 V, fIN = 1.9 kHz, |
|
||||||
|
|
|
fS = 250 kSPS |
|
|
|
||
|
|
Figure 27. SINAD vs Free-Air Temperature |
|
|||||
|
117 |
|
|
|
|
|
|
|
(dB) |
115 |
|
|
|
|
|
|
|
|
|
|
|
|
|
|
|
|
Distortion |
113 |
|
|
|
|
|
|
|
|
|
|
|
|
|
|
|
|
Harmonic |
111 |
|
|
|
|
|
|
|
109 |
|
|
|
|
|
|
|
|
|
|
|
|
|
|
|
|
|
Total |
107 |
|
|
|
|
|
|
|
105 |
|
|
|
|
|
|
|
|
|
|
|
|
|
|
|
|
|
|
103 |
|
|
|
|
|
|
|
|
±40 |
±20 |
0 |
20 |
40 |
60 |
80 |
100 |
|
|
|
Free-Air Temperature (ƒC) |
|
C029 |
|||
|
+VBD = 2.7 V, +VA = 5 V, Vref = 5 V, fIN = 1.9 kHz, |
|
||||||
|
|
|
fS = 250 kSPS |
|
|
|
||
Figure 29. THD vs Free-Air Temperature
(dB) |
119 |
|
117 |
||
Range |
||
115 |
||
|
||
Dynamic |
113 |
|
111 |
||
Free- |
||
109 |
||
Spurious |
||
107 |
||
|
||
|
105 |
|
|
103 |
|
±40 |
±20 |
0 |
20 |
40 |
60 |
80 |
100 |
|
|
|
Free-Air Temperature (ƒC) |
|
C026 |
|||
|
+VBD = 2.7 V, +VA = 5 V, Vref = 5 V, fIN = 1.9 kHz, |
|
||||||
|
|
|
fS = 250 kSPS |
|
|
|
||
|
|
Figure 26. SFDR vs Free-Air Temperature |
|
|||||
|
96 |
|
|
|
|
|
|
|
(dB) |
95 |
|
|
|
|
|
|
|
|
|
|
|
|
|
|
|
|
Ratio |
94 |
|
|
|
|
|
|
|
Noise-to- |
93 |
|
|
|
|
|
|
|
|
|
|
|
|
|
|
|
|
Signal |
92 |
|
|
|
|
|
|
|
91 |
|
|
|
|
|
|
|
|
|
|
|
|
|
|
|
|
|
|
90 |
|
|
|
|
|
|
|
|
±40 |
±20 |
0 |
20 |
40 |
60 |
80 |
100 |
|
|
|
Free-Air Temperature (ƒC) |
|
C028 |
|||
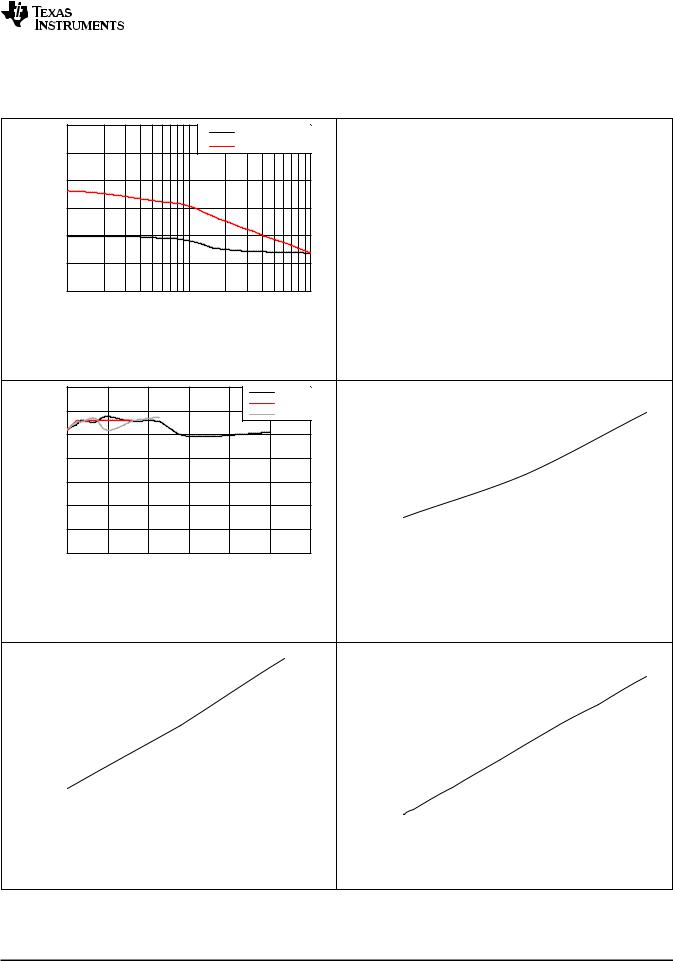
+VBD = 2.7 V, +VA = 5 V, Vref = 5 V, fIN = 1.9 kHz, fS = 250 kSPS
|
|
Figure 28. SNR vs Free-Air Temperature |
|
|
|
95 |
SINAD at ±10 dB |
|
|
(dB) |
|
|
||
94 |
SINAD at ±0.5 dB |
|||
Distortionand |
||||
91 |
|
|
||
|
93 |
|
|
|
|
92 |
|
|
|
Noise-to- |
89 |
|
|
|
|
90 |
|
|
|
Signal |
88 |
|
|
|
|
|
|
||
|
87 |
|
|
|
|
1 |
10 |
100 |
|
|
|
Signal Input Frequency (kHz) |
C030 |
|
+VBD = 2.7 V, +VA = 5 V, Vref = 5 V, fS = 250 kSPS, TA = 30°C
Figure 30. SINAD vs Signal Input Frequency
12 |
Submit Documentation Feedback |
Copyright © 2014, Texas Instruments Incorporated |
Product Folder Links: ADS8339
ADS8339
www.ti.com |
SBAS677A –JUNE 2014 –REVISED OCTOBER 2014 |
Typical Characteristics (continued)
At TA = 30°C, +VA = 5 V, +VBD = 2.7 V, Vref = 4.096 V, and fsample = 250 kHz, unless otherwise noted.
|
135 |
THD at ±10 dB |
|
|
|
|
|
(dB) |
125 |
THD at ±0.5 dB |
|
|
|
||
Distortion |
|
|
|
115 |
|
|
|
|
|
|
|
TotalHarmonic |
105 |
|
|
85 |
|
|
|
|
95 |
|
|
|
75 |
|
|
|
1 |
10 |
100 |
|
|
Signal Input Frequency (kHz) |
C031 |
+VBD = 2.7 V, +VA = 5 V, Vref = 5 V, fS = 250 kSPS, TA = 30°C
Figure 31. THD vs Signal Input Frequency
|
114 |
0 pF |
|
|
|
||
(dB) |
112 |
100 pF |
|
680 pF |
|||
|
|||
Distortion |
|
||
110 |
|
||
|
|
||
Harmonic |
108 |
|
|
106 |
|
||
|
|
||
Total |
104 |
|
|
102 |
|
||
|
|
||
|
100 |
|
|
0 |
100 |
200 |
|
|
300 |
|
400 |
|
500 |
600 |
|||||
|
|
|
|
|
|
Source Resistance ( |
|
|
C033 |
|||||||
|
+VBD = 2.7 V, +VA = 5 V, Vref = 5 V, fIN = 1.9 kHz, |
|
|
|||||||||||||
|
|
|
|
fS = 250 kSPS, TA = 30°C |
|
|
|
|
||||||||
|
|
|
Figure 33. THD vs Source Resistance |
|
|
|||||||||||
|
3.8 |
|
|
|
|
|
|
|
|
|
|
|
|
|
|
|
|
|
|
|
|
|
|
|
|
|
|
|
|
|
|
|
|
|
3.7 |
|
|
|
|
|
|
|
|
|
|
|
|
|
|
|
|
|
|
|
|
|
|
|
|
|
|
|
|
|
|
|
|
(mA) |
3.6 |
|
|
|
|
|
|
|
|
|
|
|
|
|
|
|
|
|
|
|
|
|
|
|
|
|
|
|
|
|
|
||
3.5 |
|
|
|
|
|
|
|
|
|
|
|
|
|
|
|
|
|
|
|
|
|
|
|
|
|
|
|
|
|
|
|
||
Current |
3.3 |
|
|
|
|
|
|
|
|
|
|
|
|
|
|
|
Supply |
3.4 |
|
|
|
|
|
|
|
|
|
|
|
|
|
|
|
3.2 |
|
|
|
|
|
|
|
|
|
|
|
|
|
|
|
|
|
|
|
|
|
|
|
|
|
|
|
|
|
|
|
|
|
IVA |
3.1 |
|
|
|
|
|
|
|
|
|
|
|
|
|
|
|
|
|
|
|
|
|
|
|
|
|
|
|
|
|
|
||
3.0 |
|
|
|
|
|
|
|
|
|
|
|
|
|
|
|
|
|
|
|
|
|
|
|
|
|
|
|
|
|
|
|
|
|
|
2.9 |
|
|
|
|
|
|
|
|
|
|
|
|
|
|
|
|
|
|
|
|
|
|
|
|
|
|
|
|
|
|
|
|
|
2.8 |
|
|
|
|
|
|
|
|
|
|
|
|
|
|
|
|
|
|
|
0 |
20 |
40 |
60 |
80 |
100 |
|||||||
|
±40 |
±20 |
||||||||||||||
|
|
|
|
|
Free-Air Temperature (ƒC) |
|
|
C035 |
||||||||
+VBD = 2.7 V, +VA = 5 V, fS = 250 kSPS
Figure 35. Supply Current vs Free-Air Temperature
|
300000 |
|
|
|
|
|
|
|
|
|
|
|
|
|
|
|
|
|
|
|
|
|
|
|
|
|
|
|
|
|
|
|
|
|
|
|
|
||
|
|
|
|
|
|
|
|
|
262043 |
|
|
|
|
|
|
|
|
|
|
|
250000 |
|
|
|
|
|
|
|
|
|
|
|
|
|
|
|
|
|
|
|
|
|
|
|
|
|
|
|
|
|
|
|
|
|
|
|
|
||
|
|
|
|
|
|
|
|
|
|
|
|
|
|
|
|
|
|
||
|
|
|
|
|
|
|
|
|
|
|
|
|
|
|
|
|
|
||
of Hits |
200000 |
|
|
|
|
|
|
|
|
|
|
|
|
|
|
|
|
|
|
|
|
|
|
|
|
|
|
|
|
|
|
|
|
|
|
|
|||
150000 |
|
|
|
|
|
|
|
|
|
|
|
|
|
|
|
|
|
||
Number |
|
|
|
|
|
|
|
|
|
|
|
|
|
|
|
|
|
||
|
|
|
|
|
|
|
|
|
|
|
|
|
|
|
|
|
|||
100000 |
|
|
|
|
|
|
|
|
|
|
|
|
|
|
|
|
|
||
|
|
|
|
|
|
|
|
|
|
|
|
|
|
|
|
|
|||
|
50000 |
|
|
|
|
|
|
|
|
|
|
|
|
|
|
|
|
|
|
|
|
|
|
|
|
|
|
|
|
|
|
|
|
|
|
|
|
||
|
|
|
|
|
|
|
|
|
|
|
|
|
|
|
|
|
|
||
|
|
|
|
101 |
|
|
|
|
|
|
|
|
|
0 |
|
|
|
||
|
|
0 |
|
|
|
|
|
|
|
|
|
|
|
|
|
|
|
|
|
|
|
|
32765 |
|
|
|
|
32766 |
|
|
32767 |
|
|
|
|||||
|
|
|
|
|
|
|
|
|
|
|
|
|
|||||||
|
|
|
|
|
|
|
|
|
Codes |
|
|
|
|
|
C032 |
||||
+VBD = 2.7 V, +VA = 5 V, Vref = 5 V, fS = 250 kSPS, TA = 30°C |
|||||||||||||||||||
|
|
Figure 32. DC Histogram of ADC Close-to-Center Code |
|||||||||||||||||
|
|
3.5 |
|
|
|
|
|
|
|
|
|
|
|
|
|
|
|
|
|
|
|
|
|
|
|
|
|
|
|
|
|
|
|
|
|
|
|
|
|
|
(mA) |
3.45 |
|
|
|
|
|
|
|
|
|
|
|
|
|
|
|
|
|
|
|
|
|
|
|
|
|
|
|
|
|
|
|
|
|
|
|
||
|
3.4 |
|
|
|
|
|
|
|
|
|
|
|
|
|
|
|
|
|
|
|
Current |
|
|
|
|
|
|
|
|
|
|
|
|
|
|
|
|
|
|
|
|
|
|
|
|
|
|
|
|
|
|
|
|
|
|
|
|
||
|
3.35 |
|
|
|
|
|
|
|
|
|
|
|
|
|
|
|
|
|
|
|
|
|
|
|
|
|
|
|
|
|
|
|
|
|
|
|
|
||
|
Supply |
3.3 |
|
|
|
|
|
|
|
|
|
|
|
|
|
|
|
|
|
|
|
|
|
|
|
|
|
|
|
|
|
|
|
|
|
|
|
||
|
IVA |
3.25 |
|
|
|
|
|
|
|
|
|
|
|
|
|
|
|
|
|
|
|
|
|
|
|
|
|
|
|
|
|
|
|
|
|
|
|
|
|
|
|
|
|
|
|
|
|
|
|
|
|
|
|
|
|
|
|
|
|
|
|
3.2 |
|
|
|
|
|
|
|
|
|
|
|
|
|
|
|
|
|
|
|
|
|
|
|
|
|
|
|
|
|
|
|
|
|
|
|
|
|
|
|
4.5 |
4.75 |
|
|
5 |
|
|
5.25 |
|
|
|
5.5 |
||||||
|
|
|
|
|
|
|
Supply Voltage (V) |
|
|
|
|
|
C034 |
||||||
|
+VBD = 2.7 V, Vref = 4.096 V, fS = 250 kSPS, TA = 30°C |
||||||||||||||||||
|
|
|
Figure 34. Supply Current vs Supply Voltage |
|
|
||||||||||||||
|
|
4 |
|
|
|
|
|
|
|
|
|
|
|
|
|
|
|
|
|
|
|
|
|
|
|
|
|
|
|
|
|
|
|
|
|
|
|
|
|
|
(mA) |
3.5 |
|
|
|
|
|
|
|
|
|
|
|
|
|
|
|
|
|
|
|
|
|
|
|
|
|
|
|
|
|
|
|
|
|
|
|
||
|
3 |
|
|
|
|
|
|
|
|
|
|
|
|
|
|
|
|
|
|
|
Current |
|
|
|
|
|
|
|
|
|
|
|
|
|
|
|
|
|
|
|
2 |
|
|
|
|
|
|
|
|
|
|
|
|
|
|
|
|
|
|
|
Supply |
2.5 |
|
|
|
|
|
|
|
|
|
|
|
|
|
|
|
|
|
|
1.5 |
|
|
|
|
|
|
|
|
|
|
|
|
|
|
|
|
|
|
|
IVA |
|
|
|
|
|
|
|
|
|
|
|
|
|
|
|
|
|
|
|
1 |
|
|
|
|
|
|
|
|
|
|
|
|
|
|
|
|
|
|
|
|
|
|
|
|
|
|
|
|
|
|
|
|
|
|
|
|
|
|
|
|
0.5 |
|
|
|
|
|
|
|
|
|
|
|
|
|
|
|
|
|
|
|
|
|
|
|
|
|
|
|
|
|
|
|
|
|
|
|
|
|
|
|
0 |
|
|
|
|
|
|
|
|
|
|
|
|
|
|
|
|
|
|
|
|
|
|
|
|
|
|
|
|
|
|
|
|
|
|
|
|
|
|
|
0 |
50 |
|
100 |
150 |
200 |
|
250 |
||||||||||
|
|
|
|
|
|
Sampling Frequency (kSPS) |
C036 |
||||||||||||
+VBD = 2.7 V, +VA = 5 V, TA = 30°C
Figure 36. Supply Current vs Sampling Frequency
Copyright © 2014, Texas Instruments Incorporated |
Submit Documentation Feedback |
13 |
Product Folder Links: ADS8339
ADS8339
SBAS677A –JUNE 2014–REVISED OCTOBER 2014 |
www.ti.com |
Typical Characteristics (continued)
At TA = 30°C, +VA = 5 V, +VBD = 2.7 V, Vref = 4.096 V, and fsample = 250 kHz, unless otherwise noted.
|
|
20 |
|
|
|
|
|
|
|
|
(mW) |
18 |
|
|
|
|
|
|
|
|
16 |
|
|
|
|
|
|
|
|
|
|
|
|
|
|
|
|
|
|
|
Dissipation |
14 |
|
|
|
|
|
|
|
|
12 |
|
|
|
|
|
|
|
|
|
|
|
|
|
|
|
|
|
|
|
|
10 |
|
|
|
|
|
|
|
|
Power |
8 |
|
|
|
|
|
|
|
|
6 |
|
|
|
|
|
|
|
|
|
IVA |
|
|
|
|
|
|
|
|
|
4 |
|
|
|
|
|
|
|
|
|
|
|
|
|
|
|
|
|
|
|
|
2 |
|
|
|
|
|
|
|
|
|
0 |
|
|
|
|
|
|
|
|
|
0 |
50 |
|
100 |
150 |
|
200 |
250 |
|
|
|
|
Sampling Frequency (kSPS) |
|
C037 |
|||
|
|
+VBD = 2.7 V, +VA = 5 V, Vref = 5 V, TA = 30°C |
|
||||||
|
|
Figure 37. Power Dissipation vs Sampling Frequency |
|||||||
|
|
60 |
|
|
|
|
|
|
|
|
(nA) |
50 |
|
|
|
|
|
|
|
|
Current |
40 |
|
|
|
|
|
|
|
|
Down-Power |
|
|
|
|
|
|
|
|
|
30 |
|
|
|
|
|
|
|
|
|
|
|
|
|
|
|
|
|
|
|
|
20 |
|
|
|
|
|
|
|
|
IVA |
10 |
|
|
|
|
|
|
|
|
|
0 |
|
|
|
|
|
|
|
|
|
±40 |
±20 |
0 |
20 |
40 |
60 |
80 |
100 |
|
|
|
|
Free-Air Temperature (ƒC) |
|
C039 |
|||
|
+VBD = 2.7 V, +VA = 5 V, Vref = 4.096 V, fS = 250 kSPS |
||||||||
|
Figure 39. Power-Down Current vs Free-Air Temperature |
||||||||
|
|
1. |
|
|
|
|
|
|
|
|
|
1 |
|
|
|
|
|
|
|
|
|
0.8 |
|
|
|
|
|
|
|
|
|
0.6 |
|
|
|
|
|
|
|
|
|
0.4 |
|
|
|
|
|
|
|
(LSB) |
|
0.2 |
|
|
|
|
|
|
|
|
0. |
|
|
|
|
|
|
|
|
INL |
|
0 |
|
|
|
|
|
|
|
±0.2 |
|
|
|
|
|
|
|
||
±0.4
±0.6
±0.8
±1
0 |
10000 |
20000 |
30000 |
40000 |
50000 |
60000 |
|
|
|
Codes |
|
|
C041 |
+VBD = 2.7 V, +VA = 5 V, Vref = 5 V, fS = 250 kSPS, TA = 30°C
Figure 41. INL Error vs Output Code
|
|
15 |
|
|
|
|
|
(nA) |
14 |
|
|
|
|
|
13 |
|
|
|
|
|
|
Current |
11 |
|
|
|
|
|
Down-Power |
12 |
|
|
|
|
|
10 |
|
|
|
|
|
|
|
|
|
|
|
|
|
|
9 |
|
|
|
|
|
|
8 |
|
|
|
|
|
IVA |
7 |
|
|
|
|
|
6 |
|
|
|
|
|
|
|
|
|
|
|
|
|
|
5 |
|
|
|
|
|
|
4.5 |
4.75 |
5 |
5.25 |
5.5 |
|
|
|
|
Supply Voltage (V) |
|
C038 |
|
+VBD = 2.7 V, Vref = 4.096 V, fS = 250 kSPS, TA = 30°C |
|
||||
|
|
Figure 38. Power-Down Current vs Supply Voltage |
||||
|
|
1. |
|
|
|
|
|
|
1 |
|
|
|
|
|
|
0.8 |
|
|
|
|
|
|
0.6 |
|
|
|
|
(LSB) |
|
0.4 |
|
|
|
|
|
0.2 |
|
|
|
|
|
|
|
|
|
|
|
|
|
|
0. |
|
|
|
|
DNL |
|
0 |
|
|
|
|
±0.2 |
|
|
|
|
||
|
±0.4 |
|
|
|
|
|
|
±0.6 |
|
|
|
|
|
|
±0.8 |
|
|
|
|
|
|
|
±1 |
|
|
|
|
0 |
10000 |
20000 |
30000 |
40000 |
50000 |
60000 |
|
|
|
Codes |
|
|
C040 |
+VBD = 2.7 V, +VA = 5 V, Vref = 5 V, fS = 250 kSPS, TA = 30°C
Figure 40. DNL Error vs Output Code
|
0 |
|
±20 |
|
±40 |
(dB) |
±60 |
±80 |
|
Amplitude |
±100 |
|
|
|
±120 |
|
±140 |
|
±160 |
|
±180 |
|
±200 |
0 |
50000 |
100000 |
150000 |
200000 |
250000 |
|
|
Frequency (Hz) |
|
C042 |
|
+VBD = 2.7 V, +VA = 5 V, Vref = 5 V, fIN = 1.9 kHz, fS = 250 kSPS, TA = 30°C
Figure 42. Signal Strength vs Frequency
14 |
Submit Documentation Feedback |
Copyright © 2014, Texas Instruments Incorporated |
Product Folder Links: ADS8339