530 |
INVESTMENT PHILOSOPHIES |
The second difference is in how closely the funds track the index. You can measure this by looking at the R-squared of the funds. A perfect index fund should have an R-squared of 100 percent, but some index funds fall short. Some do because they use sampling for larger indexes, and the more inefficient their sampling the system, the lower the R-squared will be. Others that try to replicate the entire index still fail because of execution lags and because remittances and withdrawals prevent them from being fully invested in the index. Using the Morningstar database again, the R-squared for S&P 500 index funds range from a low of 97 percent to a high of 100 percent. As an investor looking at index funds on a specific index, you want to pick the fund with the lowest expenses and an R-squared close to 100 percent.
T H E C A S E F O R I N D E X I N G
The case for indexing ironically is best made by active investors, who try to beat the market and often fail badly. This seems to be true not just for individual investors but also for the professional money managers. In this section, we consider the depressing evidence that notwithstanding the numerous inefficiencies that academics and practitioners claim to find in markets, usually in paper portfolios in hypothetical studies, converting these paper profits to real profits seems to be very difficult to do.
I n d i v i d u a l I n v e s t o r s
There are thousands of individual investors who attempt every day to pick stocks that they believe will do better than the market. The systems they use for stock picking run the gamut from the naive to the sophisticated. Some base their stock picks on tips from friends—insider trading with six degrees of separation—whereas others use rigorous quantitative analysis. Aided by easier access to data, more powerful personal computers, and online (and cheaper) trading, individual investors have narrowed the gap between themselves and those on Wall Street. But is this a good thing? Are investors earning higher returns than they used to?
These questions have been partially answered by researchers who gained access to the brokerage accounts of 78,000 clients of a large discount brokerage service. Barber and Odean examined the trading records of individuals
Ready to Give Up? The Allure of Indexing |
531 |
who used this brokerage service in a series of papers and came to several interesting conclusions:
The average individual investor does not beat the market, after netting out trading costs. Between 1991 and 1996, for instance, the annual net (of transaction costs) return on an S&P 500 index fund was 17.8 percent whereas the average investor trading at the brokerage house had a net return of 16.4 percent.1
The more individual investors trade, the lower their returns tend to be. In fact, the returns before transaction costs are accounted for are lower for more active traders than they are for less active traders. After transaction costs are accounted for, the returns to active trading get even worse.
Pooling the talents and strengths of individual investors into investment clubs does not result in better returns. Barber and Odean examined the performance of 166 randomly selected investment clubs that used the discount brokerage house. Between 1991 and 1996, these investment clubs had a net annual return of 14.1 percent, underperforming the S&P 500 (17.8 percent) and individual investors (16.4 percent).
There was one hopeful note in the study. The top-performing quartile of individual investors do outperform the market by about 6 percent a month. Building on that theme, other studies of individual investors find that they generate relatively high returns when they invest in companies close to their homes compared to the stocks of distant companies,2 and that investors with more concentrated portfolios outperform those with more diversified portfolios.3 Finally, a study of 16,668 individual trader accounts at a large discount brokerage house finds that the top 10 percent of traders in this group outperform the bottom 10 percent by about 8 percent per year over a long period.4
1B. M. Barber and T. Odean, “Too Many Cooks Spoil the Profits,” Financial Analysts Journal 57 (2000): 17–25.
2Zoran Ivkovich and Scott Weisbenner, “Local Does as Local Is: Information Content of the Geography of Individual Investors’ Common Stock Investments,” Journal of Finance 60 (2005): 267–306.
3Zoran Ivkovich, Clemens Sialm, and Scott Weisbenner, “Portfolio Concentration and the Performance of Individual Investors” (working paper, University of Illinois at Urbana-Champaign, 2005).
4J. D. Coval, D. A. Hirshleifer, and T. Shumway, “Can Individual Investors Beat the Market?” (SSRN Working Paper 364000, 2005).

532 |
INVESTMENT PHILOSOPHIES |
In summary, while there is a small subset of individual investors who are disciplined enough to beat the market even after incorporating transaction costs, the average individual investor does not beat the market and the degree of underperformance increases with trading activity.
P r o f e s s i o n a l M o n e y M a n a g e r s
There are many who would view the evidence in the preceding section as predictable. After all, individual investors are amateurs without the access to the information and trading resources available to mutual fund and pension fund managers (i.e., professional money managers). Professional money managers are supposed to be better informed and smarter, have lower transaction costs, and be better investors overall than individual investors. In fact, based on this belief, we trust money managers with our savings, pay large fees for money manager expertise, and tolerate large transaction costs and taxes. In return, we would expect actively run funds to do better than index funds that mimic the market.
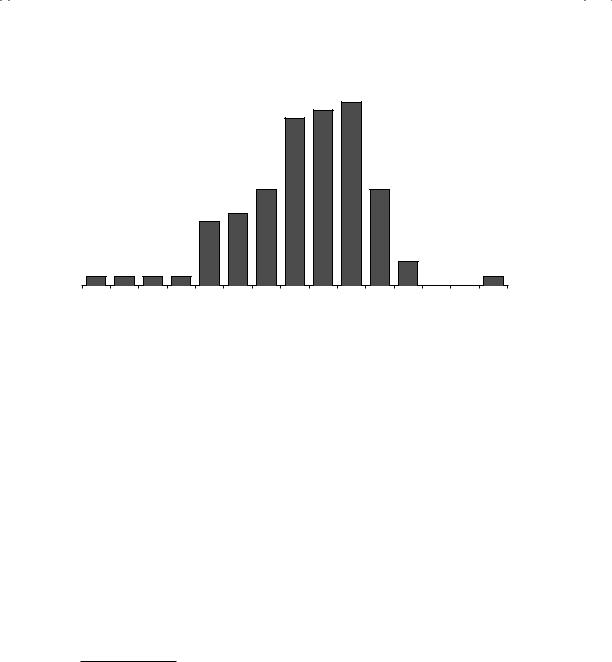
D o e s t h e A v e r a g e M u t u a l F u n d B e a t t h e M a r k e t ? Until the 1960s, the conventional wisdom that professional money managers did much better than individual investors was widely accepted but not really tested, partly because the data were not available and partly because the tools for testing the proposition were not developed. The development of the capital asset pricing model (CAPM), in conjunction with access to data and statistical packages, allowed Michael Jensen to conduct one of the first studies of mutual funds in 1968.5 He examined the returns earned by mutual funds from 1955 to 1964 and compared them to what you would have expected them to earn, given their risk exposure. The expected returns for each fund were calculated using the beta that estimated for the fund and the capital asset pricing model. In fact, the difference between the actual return and the expected return from the CAPM is still called Jensen’s alpha, reflecting the influence this study had on empirical finance for the next three decades. His findings, summarized in Figure 13.3 as excess returns on mutual funds, were that the average portfolio manager underperformed the market between 1955 and 1964.
Note that an excess return less than 0 indicates that a mutual fund underperformed the market. By this measure, more than 60 percent of the mutual funds underperformed the market and the average fund delivered returns that were about 1 to 2 percent less than expected.
5M. Jensen, “The Performance of Mutual Funds in the Period 1945–1964,” Journal of Finance 2 (1968): 389–416.
Ready to Give Up? The Allure of Indexing |
533 |
–0.08 –0.07 –0.06 –0.05 –0.04 –0.03 –0.02 –0.01 |
0 |
0.01 |
0.02 |
0.03 |
0.04 |
0.05 |
0.06 |
Intercept (Actual Return – E(R))
F I G U R E 1 3 . 3 Mutual Fund Performance, 1955 to 1964: The Jensen Study Source: M. Jensen, “The Performance of Mutual Funds in the Period 1945–64,”
Journal of Finance 2 (1968): 389–416.
These results when published created a controversy that has never quite died out. On the one hand, you have many academics and some practitioners arguing that there is no value added by active money managers. On the other, active money managers have come up with a number of problems they have with the Jensen study, and argue that fixing these problems will reveal to the world the extent of the excess returns they generate. Burton Malkiel updated this study to look at mutual funds from 1971 to 1991.6 His conclusion is slightly more positive, in the sense that he finds that prior to management expenses, the average mutual fund matches the market. After expenses, though, the average mutual fund underperforms the market by about 1 percent.7 In a study that both updates the numbers to today and globalizes the findings, Ferreira, Keswani, Miguel, and Ramox look at mutual funds in 27 countries and find that they collectively underperform market indexes by 0.20 percent; excluding the United States, the underperformance is 0.10 percent.8
6B. G. Malkier, “Returns from Investing in Equity Mutual Funds 1971 to 1991,” Journal of Finance 40 (1995): 529–572.
7This is based on using the Wilshire 5000 as the index. The underperformance is much greater (about 3.20 percent) when the S&P 500 is used as the index.
8M. A. Ferreira, A. Keswani, A. F. Miguel, and S. B. Ramos, “The Determinants of
Mutual Fund Performance: A Cross-Country Study” (SSRN Working Paper 947098, 2011).
534 |
INVESTMENT PHILOSOPHIES |
Value of $100 invested in 1982 |
|
100 |
|
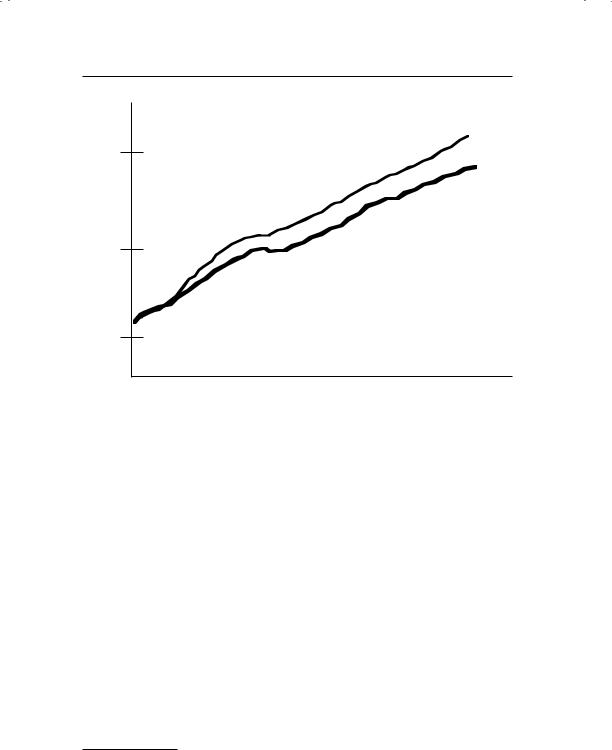
F I G U R E 1 3 . 4 Actively Managed Bond Funds versus Bond Index
Source: J. C. Bogle, Bogle on Mutual Funds (Homewood, IL: Richard D. Irwin, 1994).
Does active money management work better in the bond markets? Figure 13.4 compares the performance of actively managed bond fund to the Lehman Index (a widely used index of bonds that has since been renamed for obvious reasons) between 1983 and 1992.9
Over this 10-year period, the average actively managed bond fund underperformed the bond index by about 1.5 percent a year; $100 invested in the bond index would have grown to $303 by the end of the period, whereas it would have an ending value of $263 if managed by the actively run bond funds. This result has been replicated by other studies.
M e a s u r e m e n t I s s u e s The Jensen study was revolutionary for introducing the notion of risk-adjusted returns to empirical research but it was also limited on a number of dimensions. First, its focus on betas and the capital asset pricing model allowed money managers to claim that the results reflected failures in the model rather than in their performance. Second, the sample used in the Jensen study was a fairly small one and it did not factor in returns from funds that may have been in existence in 1955 but failed before 1964. This problem is referred to as survivor bias. Note that this is
9J. C. Bogle, Bogle on Mutual Funds (Homewood, IL: Richard D. Irwin, 1994).

Ready to Give Up? The Allure of Indexing |
535 |
likely to make the results more negative rather than less negative since it is the poorest-performing funds that usually fail. In this section, we will look at studies that have tried to use alternative measures of risk and control for survivor bias.
Excess Return Measurement In the past two decades, evidence has steadily accumulated on the limitations of the capital asset pricing model and its failure to explain the returns of stocks, especially small cap and low P/E ratio stocks. This has provided ammunition for money managers who have wanted to debunk the evidence in Jensen’s study. However, there seems to be little evidence that using alternative measures of excess returns generates results that are more positive for money managers. Let us consider a few of these measures:
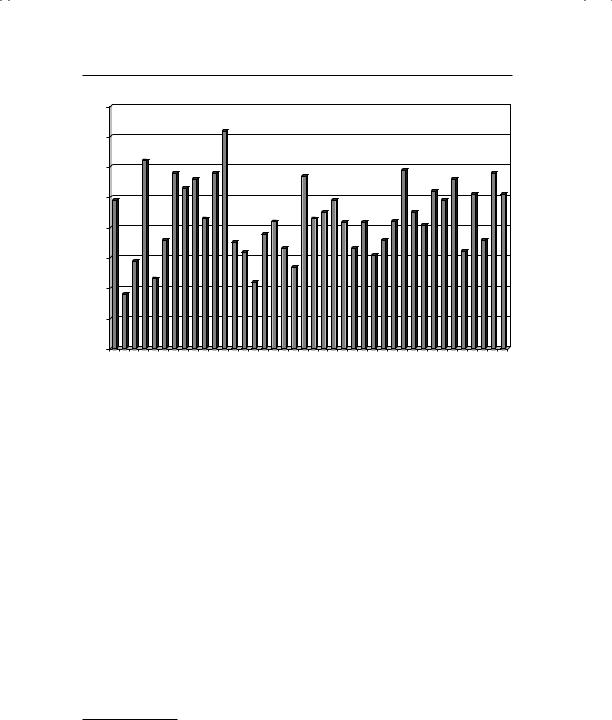
Comparison to the market. Since any risk and return model is likely to come under assault for one weakness or another, you could revert back to a much simpler comparison of returns on mutual funds to a broad index such as the S&P 500. John Bogle, who pioneered passive investing when he led Vanguard, noted in his book on investing that 166 of 205 mutual funds underperformed the Wilshire 5000 between 1983 and 1992. In Figure 13.5, we report on the percentage of active mutual funds that are outperformed by the S&P 500 each year from 1971 to 2010. Note that more than 50 percent of the active funds beat the S&P 500 in only 13 out of the 40 years. Defenders of mutual fund managers will undoubtedly argue that this measure is biased against mutual funds because they hold cash. Since many of these funds choose to hold cash as a market timing device, we have little sympathy for that point of view.
Other risk measures. The Sharpe ratio, which is computed by dividing the excess return on a portfolio by its standard deviation; the Treynor measure, which divides the excess return by the beta; and the appraisal ratio, which divides the alpha from the regression by the standard deviation, can be considered close relatives of Jensen’s alpha and were discussed in Chapter 6. Studies using all three of these alternative measures conclude that mutual funds continue to underperform the market.10 In a study that examined the sensitivity of the conclusion to alternative risk and return models, Lehmann and Modest computed the abnormal
10Sharpe used the ratio in 1966 to evaluate 34 mutual funds to conclude that they underperformed the market. Treynor used his index to come to same conclusion a few years later.
536 |
|
|
|
|
|
|
|
|
|
|
|
|
|
INVESTMENT PHILOSOPHIES |
80% |
|
|
|
|
|
|
|
|
|
|
|
|
|
|
|
|
|
|
|
|
70% |
|
|
|
|
|
|
|
|
|
|
|
|
|
|
|
|
|
|
|
|
60% |
|
|
|
|
|
|
|
|
|
|
|
|
|
|
|
|
|
|
|
|
50% |
|
|
|
|
|
|
|
|
|
|
|
|
|
|
|
|
|
|
|
|
40% |
|
|
|
|
|
|
|
|
|
|
|
|
|
|
|
|
|
|
|
|
30% |
|
|
|
|
|
|
|
|
|
|
|
|
|
|
|
|
|
|
|
|
20% |
|
|
|
|
|
|
|
|
|
|
|
|
|
|
|
|
|
|
|
|
10% |
|
|
|
|
|
|
|
|
|
|
|
|
|
|
|
|
|
|
|
|
0% |
2 |
3 |
4 |
5 |
1 |
4 |
5 |
0 |
1 |
4 |
6 |
|
19711972197319741975197619771978197919801981198 198 |
198 |
198 |
19861987198819891990199 |
19921993199 |
199 |
1996199719981999200 200 |
20022003200 |
2005200 |
2007200820092010 |
|
|
|
|
|
|
|
|
Year |
|
|
|
|
|
|
|
|
|
|
|
F I G U R E 1 3 . 5 |
Percent of Money Managers Who Beat the S&P 500 |
|
|
|
|
Source: S&P SPIVA Report. |
|
|
|
|
|
|
|
|
|
|
|
|
|
|
|
|
|
|
|
return earned by mutual funds using the arbitrage pricing model for 130 mutual funds from 1969 to 1982.11 While the magnitude of the abnormal returns earned is sensitive to alternative specifications of the model, every specification of the model yields negative excess returns.
Expanded proxy models. In Chapter 2, we referenced the study by Fama and French that found that small-capitalization stocks with low price- to-book value ratios earned much higher returns than you would have predicted with the capital asset pricing model. In Chapter 7, we also noted the evidence that has accumulated on price momentum; stocks that have done well recently are more likely to continue to do well, at least in the short term. If you do not control for these well-known empirical irregularities, you are likely to find negative excess returns in mutual funds that invest in large-capitalization stocks with high price- to-book ratios. Carhart used a four-factor model, including beta, market capitalization, price-to-book ratios, and price momentum as factors, and concluded that the average mutual fund still underperformed
11B. N. Lehmann and D. M. Modest, “Mutual Fund Performance Evaluation: A Comparison of Benchmarks and Benchmark Comparisons,” Journal of Finance 42 (1987): 233–265.

Ready to Give Up? The Allure of Indexing |
537 |
the market by about 1.80 percent a year. In other words, you cannot blame empirical irregularities for the underperformance of mutual funds.12
Given this evidence, it seems safe to conclude that the poor performance attributed to mutual funds cannot be blamed on researchers using the wrong benchmarks for comparison.
Survivor Bias One of the limitations of many studies of mutual funds is that they use only mutual funds that have data available for a sample period and are in existence at the end of the sample period. Many databases of mutual funds report only on live funds and remove funds that cease operations. Since the funds that fail are likely to be the poorest performers, there is likely to be a bias introduced in the returns that we compute for funds. In particular, we are likely to overestimate the returns earned by mutual funds by focusing only on the survivors. While this topic has been studied by numerous researchers, the first comprehensive study of survivor bias was by Carhart (referenced earlier) who examined all equity mutual funds (including failed funds) from January 1962 to December 1995. Over that period, approximately 3.6 percent of the funds in existence failed each year, and they tended to be smaller and riskier than the average fund in the sample. In addition, and this is important for the survivor bias issue, about 80 percent of the nonsurviving funds underperformed other mutual funds in the five years preceding their failure. Ignoring them, as many studies do when computing the average annual return from holding mutual funds, results in annual returns being overstated by 0.17 percent with a one-year sample period to more than 1 percent with 20-year time horizons. In practical terms, this would mean that if we found mutual funds to have underperformed the market by 1 percent a year over the past 20 years and we ignored the failed funds, the real underperformance would be closer to 2 percent a year.
P e r f o r m a n c e b y S u b c a t e g o r i e s It may not surprise some that the average fund does not do much better than the market. After all, you could argue that when institutional investors account for 60 to 65 percent of the overall market, it will be difficult for them to collectively beat the market. In fact, Charles Ellis has a provocative treatise on money management that is titled Winning the Loser’s Game that makes exactly this point and should be
12Mark M. Carhart, “On Persistence in Mutual Fund Performance,” Journal of Finance 52 (1997): 57–82.

538 |
|
|
INVESTMENT PHILOSOPHIES |
|
T A B L E 1 3 . 1 Excess Returns by Market Capitalization and Style, |
|
2007 to 2011 |
|
|
|
|
|
|
|
|
|
|
|
|
Value |
Blend |
Growth |
|
|
|
|
|
|
|
Large-cap funds |
–2.90% |
–1.03% |
0.49% |
|
|
Mid-cap funds |
–1.30% |
0.25% |
2.08% |
|
|
Small-cap funds |
–0.37% |
–0.08% |
1.08% |
|
|
|
|
|
|
|
required reading for anyone embarking on a money management career.13 You may still believe that there are subsets of funds or superior fund managers that consistently beat the market. In this section, we consider a number of subsets of funds and examine their performance relative to the market.
By Market Capitalization Do mutual funds that invest in small-cap companies do better than those that invest in large-cap companies? After all, small-cap companies are the ones where active investing should be most likely to pay off, since there is at least the possibility that investors have overlooked key fundamentals about the company. On a raw return basis, the answer seems to be yes. On an excess return basis, the answer depends on how you adjust for risk. Table 13.1 summarizes the excess returns (using the capital asset pricing model) for small-cap, mid-cap, and large-cap funds, categorized by investment style from 2007 to 2011.
Small-cap funds do better than large-cap funds, and growth funds outperform value funds, but the results should not be surprising since the capital asset pricing model consistently yields lower expected returns for small-cap and low-P/E stocks. When a three-factor or four-factor model that corrects for this bias is used to compute excess returns, these differences either narrow or disappear.
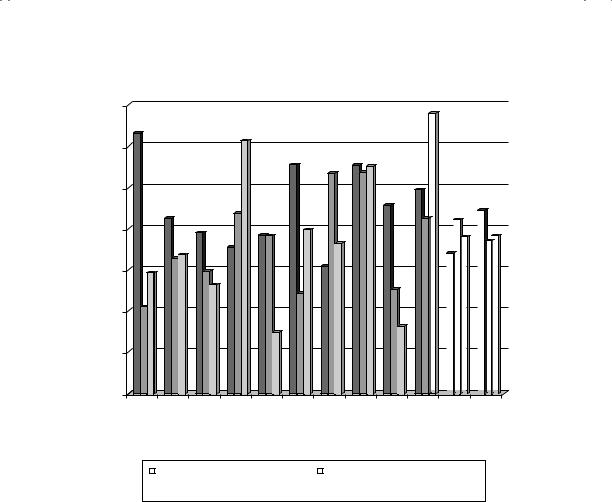
We also looked at the simple measure that we introduced in the preceding section—the percentage of actively managed funds that beat the index, as computed by Standard & Poor’s (S&P). To make the comparison fair, S&P used different indexes for the three groups: the S&P 500 for large-cap companies, the S&P 400 MidCap Index for mid-cap stocks, and the S&P 600 SmallCap Index for funds that invest in small-cap companies. Figure 13.6 summarizes the results from 2000 to 2010.14
Across the entire time period, none of the fund classes outperformed their respective indexes. In fact, large-cap funds did slightly better at beating the index benchmark than mid-cap and small-cap funds.
13C. D. Ellis, Winning the Loser’s Game (New York: McGraw-Hill, 1998). 14SPIVA reports, Standard & Poor’s.
Ready to Give Up? The Allure of Indexing |
539 |
70.00%
60.00%
50.00%
40.00%
30.00%
20.00%
10.00%
0.00% 2000
2001 |
2002 |
2003 |
2004 |
2005 |
2006 |
2007 |
|
Large-Cap Funds vs. S&P 500 |
|
Mid-Cap Funds vs. S&P MidCap |
|
|

 Small-Cap Funds vs. S&P SmallCap
F I G U R E 1 3 . 6 Active Funds versus Index: Percentage of Large-Cap, Mid-Cap, and Small-Cap Funds That Beat Respective Indexes
Source: S&P SPIVA Report.
By Style Mutual funds vary when it comes to investment styles and objectives. Some funds label themselves as growth funds and invest in stocks with high expected growth rates and P/E ratios. Others are value funds, specializing in stocks trading at low multiples of earnings and book value. There are also yield funds (that concentrate on stocks paying high dividends), diversified funds, and small-cap funds. The managers of funds in each of these style classes will probably claim that their group outperforms passive investors and it is investors in the other groups that are responsible for the overall underperformance. In a paper examining the money management industry, Lakonishok, Shleifer, and Vishny classified pension funds into growth, value, yield, and other and examined the annual return and percentage of