

Understanding the Human Machine - A Primer for Bioengineering - Max E. Valentinuzzi
.pdf18 |
Understanding the Human Machine |
tance) as 1 mmHg divided into 1 mL of blood/s. Try to find the analog variables, as for example, hydraulic pressure and electrical potential. Have you ever heard of Hopkinson’s Law? Find it out. Hint: It is another analog of the two laws mentioned above. To summarize, write down the three laws and clearly establish the analogies.
After exchange (gases, nutrients and metabolites) in the capillaries (which are part of the peripheral resistance), the return pathway is via the venous system back to the heart, entering it through the vena cava (a large distensible vein) into a small contractile chamber called the right atrium, RA. Blood goes from here to the right ventricle traversing the tricuspid valve (which connects the RA with the RV) and, from the latter chamber (also contractile but less powerful than its left side companion) proceeds through the pulmonary valve into the pulmonary artery. Thereafter, there is a shorter branching to the lungs, filling all its capillaries and, thus, permitting another exchange (this time it is only a gas exchange: oxygen is taken up and carbon dioxide is downloaded). From them, little venules converge into larger and larger veins as they approach the four pulmonary veins, which dump its oxygenated content into the left atrium, LA, another small and contractile chamber. The final step to complete the circuit is from the LA via the mitral valve back into the LV, already set to start all over again.
Suggested exercise: Again making use of Poiseuille’s Law, calculate the pulmonary resistance (RL). Is it lower or higher than the systemic peripheral resistance? Why is it so? Try first to come up with an explanation of your own. Later, check in any good physiology textbook or discuss it with a classmate or with an instructor.
Study subject: Besides carrying substances, are there other secondary but yet important functions of the circulation? Suggest possible block diagrams for these functions. Explain briefly.
2.2.1.2. The customers
An urban water distribution system has its customers hooked in parallel to a main supplying pipe. Something similar is found in the mammalian blood distribution system. To begin with, from the left heart to the right heart, we have lumped all the peripheral resistance in one block (Figure 2.1). However, this is in fact extremely complex. The arteries, starting with the main outflow (the aorta), branch off into smaller ducts supplying blood to the different vascular beds. These regional subsystems vascularize the tissues that, in the end, are the “customers” or the final users of the blood contents. Each bed, by and large, has a relatively well defined main inflow, as for example the kidneys, with one unmistakable renal
Chapter 2. Source: Physiological Systems and Levels |
19 |
artery per kidney (one to the right and the other to the left), or the ventricles themselves, with the right and left coronary arteries (coronary means “crown”; if you take a look at the heart, especially from above, it gives the impression of a crowned head).
Suggested exercise: Come up with a definition of vascular bed. It is an important concept because, even though all beds share certain common properties, they also differ significantly in others. Search for the main arteries supplying blood to the brain. Is there a single blood input to the skin? Find out what the physiologic pulmonary shunt is.
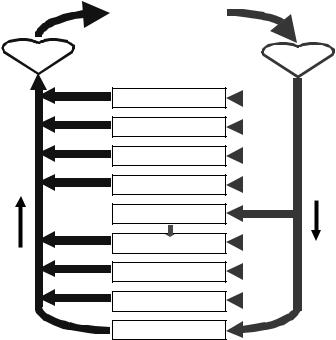
Figure 2.3 depicts the principal users: the coronary circulation, the brain, skeletal muscle, bone (yes, bone also requires some blood), the gastrointestinal and hepatic especially coupled systems, the kidneys, the skin, and other tissues. Out of the total flow expelled by the left ventricle, the figure indicates the respective approximate percentages derived to each regional section. However, depending on the physiological condition (say, exercise, rest, postprandial or preprandial state, shock) these values may change significantly. Some regions (as the brain and the heart) are favored in emergency conditions as compared to other lower hierarchical beds (as, for example, the skin and the guts).
Suggested exercise: Why a person with hypotensive shock is pale? Please, think in terms of the “big print” without trying to develop a clinical history. Hint: Does he/she need blood supply to this particular bed? Give a second thought to the concept of regional hierarchies from the hemodynamic viewpoint: Why should the brain and the heart be favored?
2.2.1.3. Variables of the Cardiovascular System (CVS)
Figure 2.1 and Figure 2.2 are models and, as such, already contain the basic and important variables any cardiovascular physiologist, hemodynamist or cardiologist have to deal with.
− Blood volume (Vb)
It is measured in units of length to the 3rd power, as for example in cubic centimeter (cm3 = mL) or in liters (L). It is a physical almost intuitive concept closely related to mass and density (the latter is defined as mass per unit volume; recall that the density of blood is 1.055 g/cm3, that is, it is slightly higher than that of water). Volume quantifies how much space a given material occupies. In the normal adult, Vb is in the order of 5 to 6 L. Life is not viable without blood, thus, it is essential and indispensable. By a similar token, an empty hydraulic network is useless.
20
Flow =100%
RH
Understanding the Human Machine
|
Flow =100% |
|
Lungs |
||
|
||
|
LH |
|
|
3% Coronary Circ. 
14% Brain 
15% Skeletal Muscle 
5% Bone 
21%
Gi & Spleen
6% Liver 
22% Kidney 
6% Skin 
8% Others
Figure 2.3. THE CIRCULATORY SYSTEM AND ITS PRINCIPAL BEDS. Observe the particular arrangement of the gastrointestinal, spleen and hepatic system. It has a double inflow of blood. Percentages by each branch correspond to the relative amounts of blood flow to the respective beds.
− Blood flow (Fb)
It is measured in units of volume per unit time (say, in mL/s or in L/min), has to be guaranteed through every single piece of tissue. Sometimes, this concept is referred to as perfusion. The total resting outflow, either from the left or from the right ventricle, has an average value of about 5 to 6 L/min (or about 100 mL/s). It is also called cardiac output, CO. However, as clearly seen in Figure 2.3, each bed takes only a portion of this total value. If one considers the pulsating action of the heart, since each ventricle ejects during each contraction the so called stroke volume, SV — about 70 to 80 mL/beat — at a frequency of 70/min, it leads to 4.9–5.6 L/min, which is roughly the figure given above. Remember clearly: Blood supply to the tissues is absolutely necessary. Without it tissues die. Ischemia (ischein, to supress, and haima, blood, from Greek)
Chapter 2. Source: Physiological Systems and Levels |
21 |
is the word to describe the condition characterized by a diminished perfusion. If it happens in the brain or in the ventricles, it may end up in serious cerebral or cardiac injury. It may take place also in any tissue, as for example in the gut. The existence of pressure does not necessarily assure a good passage of blood. An obstructed vessel usually has good hydraulic pressure at the arterial side.
Suggested exercise: Search for at least three pathologies (other than the three already mentioned above), which recognize ischemia as its source.
Suggested experiment: Pick up a weight (for example, 5 kg) with your hand and start to flex the arm as if trying to build up a good-looking biceps. Do it 30 or 40 times. Thereafter, tie your arm around below the shoulder with an elastic band. Repeat the exercise. How many times can you lift it up? Explain.
− Blood pressure (Pb)
It is measured in mmHg or in Pa, at any place all over the circulatory system. It is also essential and is a clear physical concept, defined as force per unit area (1 Pa = 1 Newton/m2; 1 kPa = 1,000 Pa; 1 hPa = 100 Pa). Thus, as a rule of thumb, to pass from mmHg to hPa multiply by 4/3, and vice-versa, to go from hPa to mmHg, obviously multiply by 3/4.
Maintenance of a head pressure is what keeps the blood moving. Except for friction losses, arterial blood pressure at the entrance of any bed is the same. Its mean value is somewhat lower than 100 mmHg (or 13.33 kPa = 133.3 hPa).
Application of Poiseuille’s Law leads to the definition of a fourth (and this time compound) variable, the already mentioned peripheral resistance, Rp. However, if applied to a specific region, the concept of regional resistance, Rr , can also be defined.
Suggested exercise: Calculate the relative resistances of the beds outlined in Figure 2.3 assuming a constant arterial head pressure and a zero pressure on the venous side. Suggested exercise: After the model of Figure 2.3 and using the concepts of regional resistances and different variables of the cardiovascular system, identify three types of possible collapse (shock, in medical language). Find analogies in an urban water system, say, during one of those unbearable summer days when, for example, everybody in town decides to water the yard, clean the swimming pool and wash the car.
2.2.1.4. The heart
By now, it is we hope quite clear to the student that the heart is a muscle divided in two sections, left and right, each with an atrium and a ventricle. Hence, it has four chambers: two are mainly collecting ones (with a
22 |
Understanding the Human Machine |
relatively minor propelling function) while the other two are essentially ejecting structures. The heart in toto acts as two hydraulic pumps connected in series. The unidirectionality of the circuit is undoubtedly manifested by the four cardiac valves (kind of hydraulic diodes). Moreover, the heart can be considered as a periodic pulse generator that, on the average, maintains an equivalent constant flow. Such flow, according to the requirements, can be adjusted (up to a maximum of about 30 L/min during heavy exercise, in a healthy young adult). However, this continuous equivalent concept is merely a practical simplification and it must be emphasized that, by its nature, the circulatory system is pulsatile. Even more, there is evidence indicating that life would not be viable, were the pump of the true constant type. Thus, apparently, pulsations are necessary, although some people question such stand. Besides, it is now well recognized that the system shows reflecting waves and a nonlinear behavior.
The heart is simultaneously a pump and a muscle and, as any muscle, it has contractile elements (sarcomeres) that change their length. The net result is a change in the cross-sectional horizontal ventricular diameter, relatively much larger than the change in the longitudinal (or basalapical) diameter. Wall thickness also changes during contraction, and all this occurs in synchronism, both in the left and in the right ventricles. The increment in intraventricular pressures opens in the end the arterial output valves as these pressures become higher than the arterial blood pressures, so starting the ejection phase. Hence, valve opening is a passive phenomenon, with a pressure gradient being the only driving mechanism (no muscle or tiny motor is involved). In the aortic root, pressure reaches a maximum of about 120 mmHg (or 160 hPa, systolic pressure) and, because of its pulsatile characteristic, shows a minimum in the order of 80 mmHg (or 106 hPa, diastolic pressure). In the pulmonary artery the maximum and minimum are, respectively, 25 and 10 mmHg (or 33.3 and 13.3 hPa) with a mean value of about 15 (or 20 hPa). The difference between the two is called the differential systemic arterial pressure or the differential pulmonary pressure, respectively, both with significant clinical implications.
Within the ventricles the numbers, instead, are rather different. In both ventricles the minimum is always zero (which offers a splendid criterion to know when a catheter is within the chamber), going up to a maximum of 120 and 25 mmHg, respectively, for the left and for the right side, obviously coincident with the maxima given above (remember that the ven-
Chapter 2. Source: Physiological Systems and Levels |
23 |
tricular and the nearby arterial cavities become temporarily a single one when the valves are opened during the ejection phase).
A unique characteristic of any muscle is its contractility, somewhat elusive in its definition for researchers still argue about which is the best. Nonetheless, since intraventricular pressures rise from zero to a maximum because of the contraction, the velocity of doing it, i.e., the temporal derivative of the intraventricular pressure provides an acceptable means for estimating how good the muscle contracts. Hence, contractility, either of the left or of the right ventricle, can be defined as (dPiv/dt), where Piv stands for the corresponding intraventricular pressure. Usually,
the maximum of this derivative, (dPiv/dt)max, is chosen as the proper descriptor.
Cardiac contractility is an extremely important physiological and clinical parameter. It can be defined for any of the four cardiac chambers. However, the left ventricle’s is what people are mostly concerned about for in heart disease, very commonly, ventricular contraction decreased strength leads to cardiac insufficiency and failure. Nervous or hormonal influences can deeply affect cardiac contractility (and, therefore, the ability to develop pressure). For example, sympathetic activity will increase it (the so called positive inotropic effect), producing stronger contractions and higher pressure. The Greek roots inos and tropic, respectively, mean “force” and “tendency”. Other agents may elicit negative inotropic responses (that is, weaker contractions).
Study subject: Find the difference between tropism and trophism. Search for a few examples in physiology. They are important concepts.
2.2.1.5. Laws of the heart: Starling's and Laplace's
But not only contractility plays a role in the force of contraction (and, thus, in the capacity to develop pressure which finally leads to the ejection of blood). There are two beautiful laws contributing to the mechanisms associated with intraventricular pressure build up. Both are significant in cardiac physiology. The first one is physiological, born around 1914 after a series of experiments carried out in London by Ernest Henry Starling (1866–1927) and his collaborators, while the second is physical, to be found in a monumental opera, La Mecanique Celeste, authored by the French mathematician and astronomer Pierre Simon Laplace (1749– 1827) and published in several volumes between 1790 and 1825:
24 |
Understanding the Human Machine |
− Starling’s Law (of the heart)
The force of contraction increases as the initial fiber tension goes up
(the nowadays so called preload).
− Laplace’s Law (adapted to the heart)
The intracavitary pressure (Pic) is directly proportional to the wall stress (Ws) and inversely proportional to the equivalent radius (Req) or
Pic = kWsh / Req |
(2.1) |
where k is a constant and h is the wall thickness. |
|
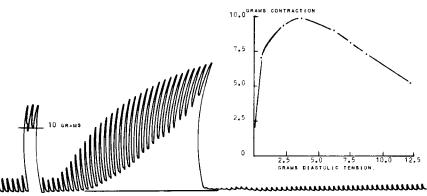
1- Starling's Law, although first described for the heart, is also valid for skeletal muscle. Figure 2.4 is a record obtained from a naturally contracting turtle ventricle while, after each beat, the initial tension (it could be called “mechanical bias”) was manually increased by a small amount using a specially designed spring mechanism attached to a force transducer. The inset (right of the same figure) displays the relationship between the force of contraction (measured as the difference between the maximum and the minimum per beat) and the corresponding stretch applied to the whole ventricle, both in grams (force), measured from the
Figure 2.4. STARLING’S LAW OF THE HEART. Ventricular spontaneous contractions of a turtle’s heart as the organ was gradually stretched by means of a specially designed mechanical arrangement which included the myographic transducer. Notice the increase in contraction with stretch up to a maximum value. Thereafter, because of overstretch, there was a decrease in contraction. The graph to the right shows clearly such maximum. Experimental data obtained from a turtle at the Physiology Department of Baylor College of Medicine, Houston, TX, 1966.
Chapter 2. Source: Physiological Systems and Levels |
25 |
base line to the minima. Both, the temporal record and the plot, clearly show the important increase in the contraction force. However, as the stretch proceeds, the force goes down, indicating entrance into a dangerous operating region where, probably, the overstretch may cause damage to the fibers. This is an easy and highly demonstrative experiment, which was routinely carried out by medical and physiology students alike at Baylor College of Medicine, in Houston, TX, during the professorship years of Hebbel E. Hoff and Leslie A. Geddes, roughly from 1957 to 1975. There used to be an Experimental Physiology Manual, by these two authors and now probably almost impossible to find (a real jewel for those who may still keep a copy), where practical details of the exercise were clearly explained. Its foundation was presented by Starling in the Linacre Lecture at Cambridge, England, in 1915 and published a few years later in 1918. His latter phrasing was: “The law of the heart is thus the same as the law of muscular tissue generally, the energy of contraction, however measured, is a function of the length of the muscle fibre”
(Patterson and Starling, 1914; Starling, 1918).
2- Laplace’s Law was described for spherical bubbles (typically, soap bubbles) with a wall of negligible thickness; in other words, it refers to a film under tension, the so called surface tension (T), which is defined as the tangential force (tangent to the surface) applied perpendicularly to a unit length lying on the surface. The theorem of Laplace applies to a membrane separating two spaces of any shape with tension in it. Any surface — as for example that of a Bunny Rabbit or Teddy Bear balloon
— can always be decomposed into many “caps” each defined by two mutually perpendicular circumferences of respective radii, R1 and R2, which are called the principal radii of curvature. Within the balloon, according to the theorem, the pressure P (actually it is the difference between the inside and the outside pressure, which most frequently is the atmospheric pressure) is given by,
|
1 |
|
1 |
|
|
||
P =T |
+ |
|
(2.2) |
||||
R |
R |
|
|||||
|
|
2 |
|
|
|||
1 |
|
|
|
||||
where T is the already mentioned surface tension, for example in dynes/cm, and the radii, R’s, say, expressed in cm. It is easily seen that pressure comes out in dynes/cm2. When radii are equal, we have a sphere

26 |
Understanding the Human Machine |
T=F/d |
E |
d |
|
|
T |
G |
|
|
T |
||
|
Angle(ETG)= |
|
||
|
(a) |
|
|
|
|
Angle(EAB)= |
|
|
|
|
|
Angle(AOP) |
|
|
|
F |
|
|
B |
|
|
H |
H |
|
|
|
A |
P |
|
R2 |
|
|
||
|
|
|
||
R1 |
|
|
O |
|
|
|
|
||
|
(b) |
|
(c) |
|
Figure 2.5. LAPLACE’s LAW. (a) Definition of surface tensión. (b) Cap element showing its two principal radii and the force over the surface unit length. Pressure is applied from underneath. (c) The arc AB represents one of the two principal arcs on (b), for example, the red one, thus, it defines a plane. Notice that chord AB is divided in two halves; each can be called H, from A to its middle (where the arrow P sets) and from there to point B. It is underlined that point G corresponds to the middlepoint of the segment TT. See text.
(such as a bubble), and the equation simplifies into P = 2T/R (Figure 2.5).
Suggested exercise: Obtain the equation for a cylinder. This case is applicable to the vessels in general.
If the latter equation for the sphere is compared with the above eq. (2.1) for the cardiac case, it comes out that,
kWsh = 2T or
Ws = 2T / kh = KT / h = KF /(dh) |
(2.3) |
clearly showing that wall stress is proportional to the surface tension distributed over the wall thickness. The constant, K = 2/k, can eventually be equated to 1, while d is the unit length over the surface to which the force F acts perpendicularly and tangentially to the same surface. Wall stress is an extremely important concept in cardiology. Excessive stress causes injury to the cardiac tissue and the latter, in turn, may end up in a lower contractility and consequent insufficiency. One clinical strategy aims at reducing wall stress, which acts as an internal load to the heart.
Chapter 2. Source: Physiological Systems and Levels |
27 |
Laplace’s Law is quoted over and over, however, its demonstration is rarely found. Woods applied it in 1892 to hollow organs (such as the uterus, the bladder and the ventricles). K. De Snoo, a Dutch researcher in 1936, offered a simple geometrical derivation that was reviewed by Máximo Valentinuzzi (Sr), in Argentina in 1950, both in studies of the uterine contraction. The law was rephrased by the latter author as follows: The tension on any given point of the uterine wall is equal to the product of the intrauterine pressure and the curvature radius of the uterus at that point, or T = P R. Clearly, this is valid for the heart, too. These papers are difficult to find and, besides, are written in languages other than English.
Burton (1957) produced an editorial article where an excellent discussion is provided, even reporting actual numerical results. Nontheless, no mathematical demonstration was given. Hence, we will develop herein De Snoo’s, even though it has a weak point which the curious and mathematically oriented student may take up for further thinking.
As already stated above, the surface of a balloon of any shape, with pressure in it, can always be broken down into a number of caps, as many as necessary. To give a visual idea, these caps would look like parachutes when quietly falling down to Earth. Let us take a section of an osculating circumference in one of these caps, coincident with one of the characterizing radii (Figure 2.5). From now on, everything in this demonstration is considered on the plane of the circle defined by such circumference. The pressure inside acts on the Chord (AB) subtending the arc,
thus, the arc between points A and B is under the tension, |
|
T = PChord (AB) |
(2.4) |
where P is in [dynes/cm2] and (AB) in [cm], signaling that we are indeed getting units of tension, or [dynes/cm]. Besides, the chord AB is divided in two halves H, or Chord (AB) = 2H, indicating that the tension can be rewritten as T = P (2H). This tension is counterbalanced by an opposing tension D, divided in two equal components tangent to points A and B, respectively. The balancing tension is graphically obtained by, first, sliding the two T’s over their linear projections until they intersect at point E, and second, by application of the parallelogram rule. Thus,
Segment(EG) = D / 2 =T sin(α) |
(2.5) |
where α is the angle (ETG) = angle (EAB), because their sides are parallel, and is also equal to angle (EOP), because their sides are perpendicular. Solving eq. (2.5) for T and replacing D, yields,
T = D / 2sin(α) = PH / sin(α) |
(2.6) |