

Environmental Biotechnology - Jordening and Winter
.pdfJördening, H.-J., Jansen, W., Brey, S., Pellegrini, A., Optimierung des Fließbettsystems zur anaeroben Abwasserreinigung,
Zuckerindustrie 1991, 116, 1047–1052. Jördening, H.-J., Mansky, H., Pellegrini, A.,
German Patent 19502615 C2 (1996). Keim, P., Luerweg, M., Aivasidis, A., Wan-
drey, C., Entwicklung der Wirbelschichttechnik mit dreidimensional kolonisierbaren Trägermaterialien aus makroporösem Gas am Beispiel der anaeroben Abwasserreinigung, Korrespondenz Abwasser 1989,
36, 675–687.
Kitsos, H. M., Roberts, R. S., Jones, W. J., Tornabene, T. G., An experimental study of mass diffusion and reaction rate in an anaerobic biofilm, Biotechnol. Bioeng. 1992,
39, 1141–1146.
Kossen, N. W. F., Oosterhuis, N. M. G., Modelling and scaling-up of bioreactors, in: Bio- technology, 1st edn., Vol. 2 (Rehm, H.-J., Reed, G., eds.), pp. 571–605. Weinheim 1985: VCH.
Kroiss, H., Svardal, K., CSTR reactors and contact processes in industrial wastewater treatment, in: Biotechnology 2nd edn. Vol. 11a (Rehm, H.-J., Reed, G., Pühler, A. Stadler, P., eds.) pp. 65–84, Weinheim 1999, Wiley VCH
Lettinga, G., Hobma, L. W., Hulshoff-Pol, L. W., De Zeeuw, W., De Jong, P., Design operation and economy of anaerobic treatment, Water Sci. Technol. 1983, 15, 177–196.
Lettinga, G., Hulshoff Pol, L.W., Lier, J.B.B.V., Zeeman, G., Possibilities and potential of anaerobic waste water treatment using anaerobic sludge bed (ASB) reactors, in: Biotechnology 2nd edn. Vol. 11a (Rehm, H.-J., Reed, G., Pühler, A. Stadler, P., eds.) pp. 65–84, Weinheim 1999, Wiley VCH
Macarie, H., Overview of the application of anaerobic treatment to chemical and petrochemical wastewaters, Water Sci. Technol. 2001, 44, 201–214
McCarthy, P.L., The development of anaerobic treatment and its future, Water Sci. Technol. 2001, 44, 149–156
Menon, R., Delporte, C., Johnstone, D. S., Pilot treatability testing of food processing wastewaters using the Anaflux™ anaerobic fluidized-bed reactor, 52nd Ind. Waste Conf., Purdue University, West Lafayette, IN, USA 1997.
References 161
Mösche, M., Anaerobe Reinigung von Zuckerfabriksabwasser in Fließbettreaktoren, Thesis, Technical University of Braunschweig, Germany 1998.
Mueller, J. A., Mancini, J. L., Anaerobic filter kinetics and application, Proc. 30th Ind. Waste Conf., pp. 423–447, Purdue University, West Lafayette, IN, USA 1975.
Mulcahy, L. T., La Motta, E.J., Mathematical model of the fluidized bed biofilm reactor, Report No. 59-78-2, Dept. Civil Eng., University of Massachusetts Amherst, USA 1978.
Nakhla, G., Suidan, M.-T., Determination of biomass detachment rate coefficients in anaerobic fluidized bed GAC reactors, Biotech- nol. Bioeng 2002, 80, 660–669
Ney, U., Schobert, S. M., Sahm, H., Anaerobic degradation of sulfite evaporator condensate by defined bacterial mixed cultures, Dechema Biotechnol. Conf., Vol. 3, Part B, pp. 889–892. Weinheim 1989: VCH.
Oliva, E., Jacquart, J. C., Privot, C., Treatment of waste water at the El Aguila brewery (Madrid, Spain): methanization in fluidized bed reactors, Water Sci. Technol. 1990, 22, 483–490.
Ouchijama, N., Tanaka, T., Porosity of a mass of solid particles having a range of sizes, Ind. Eng. Chem. Fundam. 1981, 20, 66–71.
Ozturk, I., Anderson, G. K., Saw, C. B., Anaerobic fluidized bed treatment of brewery wastes and bioenergy recovery, Water Sci. Technol. 1989, 21, 1681–1684.
Parkin, G. F., Speece, R. E., Attached versus suspended growth anaerobic reactors: Response to toxic substances, Water Sci. Technol. 1983, 15, 261–289.
Ragan, J. L., Celanese experience with anaerobic filters, Proc. Semin.: Anaerobic Filters: An Energy Plus for Wastewater Treatment,
pp. 129–135, 9–10 January 1980, Howey In The Hills, FL 1981, ANL/CSNV-TM-50.
Richardson, J. F., Zaki, W. N., Sedimentation and fluidization: Part 1, Trans. Inst. Chem. Eng. 1954, 32, 35–53.
Rittenhouse, G., A visual method of estimating two-dimensional sphericity, J. Sediment. Petrol. 1943, 13, 79–81.
Salkinoja-Salonen, M. S., Nyns, E.-J., Sutton, P. M., Van Den Berg, L., Wheatley, A. D., Starting up of an anaerobic fixed film system,
Water Sci. Technol. 1983, 15, 305–308. Sanchez, J. M., Arijo, S., Munoz, M. A., Morini-
go, M. A., Borrego, J. J., Microbial coloniza-

162 5 High-rate Anaerobic Wastewater Treatment
tion of different support materials used to enhance the methanogenic process, Appl. Microbiol. Biotechnol. 1994, 41, 480–486.
Sanchez, J. M., Rodriguez, F., Valle, L., Munoz, M. A., Morinigo, M. A., Borrego, J. J., Development of methanogenic consortia in fluidized bed batches using sepiolite of different particle size, Microbiologia 1996, 12, 423–434.
Schraewer, R., DasAnfahrverhalten von anaeroben Bioreaktoren zur Reinigung hochbelasteter Stärkeabwässer, Starch/Stärke 1988, 40, 347–352.
Schultes, M., Füllkörper oder Packungen?
Chem. Ing. Tech. 1998, 70, 254–261. Schwarz, A., Yahyavi, B. M., Mösche, M.,
Burkhardt, C., Jördening, H.-J. et al., Mathematical modeling for supporting scale-up of an anaerobic wastewater treatment in a fluidized bed reactor, Wat. Sci. Tech. 1996, 34, 501–508.
Schwarz, A., Mösche, M., Jördening, H.-J., Buchholz, K. Reuss, M., Modellgestützte Betrachtungen zur Reaktionstechnik und Fluiddynamik im industriellen AnaerobFließbettreaktor, in: Technik anaerober Prozesse (Märkl, H., Stegmann, R., eds.). Frankfurt 1998, Dechema.
Shieh, W. K., Keenan, J. D., Fluidized bed biofilm reactor for wastewater treatment,
Adv. Biochem. Eng. Biotechnol. 1986, 33, 132–169.
Shieh, W. K., Mulcahy, L. T., LaMotta, E. J., Mathematical model for the fluidized bed biofilm reactor, Enzyme Microb. Technol.
1982, 4, 269–275.
Snowdon, C. B., Turner, J. C. R., Mass transfer in liquid-fluidized beds of ion-exchange resin beads, in: Proc. Int. Symp. Fluidization
(Drinkenburg, A. A. H., ed.), pp. 599–608. Eindhoven 1967.
Sreekrishnan, T. R., Ramachandran, K. B., Ghosh, P., Effect of operating variables on biofilm formation and performance of an anaerobic fluidized-bed bioreactor, Biotech- nol. Bioeng. 1991, 37, 557–566.
Stronach, S. M., Diaz-Baez, M. C., Rudd, T., Lester, J. H., Factors affecting biomass attachment during start-up and operation of anaerobic fluidized beds, Biotechnol. Bioeng. 1987, 30, 611–620.
Sutton, P. M., Li, A., Evans, R. R., Korchin, S., Dorr-Oliver’s fixed film and suspended growth anaerobic systems for industrial wastewater treatment and energy recovery, 37th Ind. Conf., Purdue University, West Lafayette, IN, USA 1982.
Switzenbaum, M. S., A comparison of the anaerobic filter and the anaerobic expanded/ fluidized bed process, Water Sci. Technol. 1983, 15, 345–358.
Weiland, P., Rozzi, A., The start up, operation and monitoring of high-rate anaerobic treatment systems: discussers’ report, Water Sci. Technol. 1991, 24, 257–277.
Weiland, P., Wulfert, K., Festbettreaktoren zur anaeroben Reinigung hochbelasteter Abwässer: Entwicklung und Anwendung, BTF 1986, 3, 152–158.
Weiland, P., Thomsen, H., Wulfert, K., Entwicklung eines Verfahrens zur anaeroben Vorreinigung von Brennereischlempen unter Einsatz eines Festbettreaktors, in: Verfahren- stechnik der mechanischen, thermischen, chemischen und biologischen Abwasserreinigung, Part 2: Biologische Verfahren (GVC–VDI, ed.), pp. 169–186. Düsseldorf 1988: VDI-Gesell- schaft für Verfahrenstechnik und Chemieingenieurswesen.
Wen, C. Y., Yu, Y. H., A generalized method for predicting the minimum fluidization velocity, AIChE J. 1966, 12, 610–612.
Wingender , J. Flemming, H.-C., Autoaggregation of Microorganisms: Flocs and Biofilms, in: Biotechnology 2nd edn. Vol. 11a (Rehm, H.-J., Reed, G., Pühler, A. Stadler, P., eds.) pp. 65–84, Weinheim 1999, Wiley VCH
Yi-Zhang, Z., Li-Bin, W., Anaerobic treatment of domestic sewage in China, in: Anaerobic Digestion 1988 (Hall, E. R., Hobson, P. N., eds), pp. 173–184. Oxford 1988: Pergamon. Young, J. C., Dahab, M.F., Effect of media de-
sign on the performance of fixed-bed anaerobic reactors, Water Sci. Technol. 1983, 15, 369–384.
Young, J. C., McCarty, P. L., The anaerobic filter for waste treatment, J. Water Pollut. Control Fed. 1969, 41, R161.

163
6
Modeling of Biogas Reactors
Herbert Märkl
6.1 Introduction
As early as 1973 Graef and Andrews (1973) published a mathematical model of the anaerobic digestion of organic substrates. The authors assumed that the conversion of volatile organic acids by methanogenic bacteria to methane was the rate-limiting step in the sequence of biological reactions and that all volatile acids can be represented as acetic acid. Acetic acid is dissociated to a large extent at the relevant pH range between 6.6 and 7.4. The authors assumed that only the undissociated form of acetic acid is the limiting substrate for the microbial production of methane.
The pH value in this mathematical model is calculated from the ion balance, assuming electroneutrality in the fermentation broth. In this context the concentration of dissolved CO2, which itself is partly dissociated to HCO–3 and CO23–, must also be known. In the mathematical model of Graef and Andrews, the concentration of dissolved CO2 is calculated on the basis of the mass transport from the liquid phase to the gas phase of the system. This transport phenomenon proved to be very important for the mathematical modeling of technical biogas reactors, as is shown later in this chapter.
The mathematical model of Graef and Andrews describes a homogenous, completely mixed system as far as the liquid phase of the reactor is concerned.
6.1.1
Elements of the Mathematical Model
This chapter shows that the mentioned elements of the model of Graef and Andrews are an excellent basis for the quantitative analysis of modern biogas reactor systems. In the research work of different groups following this first publication, it was proved that more knowledge is necessary, especially about the microbial kinetics of biogas production (Section 6.3). Most of the real biogas reactors are far from being completely mixed systems, as demonstrated by the example of a biogas tower reactor (BTR) (Fig. 6.1). This type of reactor is described in more detail by Märkl and Re-
Environmental Biotechnology. Concepts and Applications. Edited by H.-J. Jördening and J. Winter Copyright © 2005 WILEY-VCH Verlag GmbH & Co. KGaA, Weinheim
ISBN: 3-527-30585-8
164 6 Modeling of Biogas Reactors
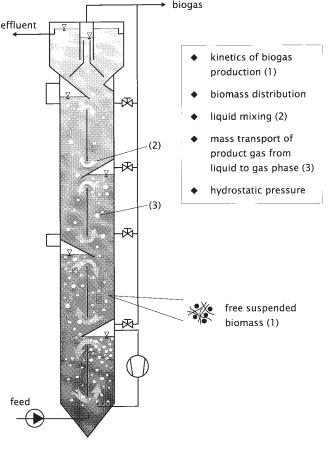
Fig. 6.1 Elements of a mathematical model for a biogas tower reactor (BTR).
inhold (1994). The typical features of the BTR are its tower shape, the modular structure, and the internal installations. Gas collecting devices are used to withdraw the fermentation gas from different levels of the reactor. These gas collectors separate the reactor into modules along the height. By means of these devices, which are equipped with valves, the gas loading and the mixing intensity can be controlled separately in each module. To avoid flotation of active biomass due to excessive gas load, an effective biomass accumulation is generated within the reactor.
The biomass is represented in this reactor by free suspended microorganisms which are associated in the form of sedimentable more-or-less loose pellets (flocs). One very important point, when modeling such a reactor, is to describe the local distribution of active biomass within the reactor (Section 6.4.2).
In a mathematical model the mixing behavior of the liquid phase is of similar importance (Section 6.4.1). The mixing of the BTR is caused by internal airlift loop units. Since the reactor is designed in the shape of a tower and is only fed at the bot-
6.1 Introduction 165
tom (Fig. 6.1), the question of mixing and supplying the microorganisms in each part of the reactor with nutrients is very important during the scale-up of such a system. Besides, hydraulic mixing is important to prevent toxic concentrations of substrate near the inlet of the reactor.
As pointed out by Graef and Andrews (1973), the mass transport of product gas from the liquid phase to the gas phase is an essential element of the mathematical model. Local transport data as a function of the hydrodynamics for the example of the biogas tower reactor is given for CO2 and H2S in Section 6.5 of this chapter. The last element of a mathematical model which is of high importance, especially when discussing tall reactors, is represented by the influence of the local hydrostatic pressure on the kinetics of biogas generation (Section 6.6).
6.1.2
Scale-Up Strategy
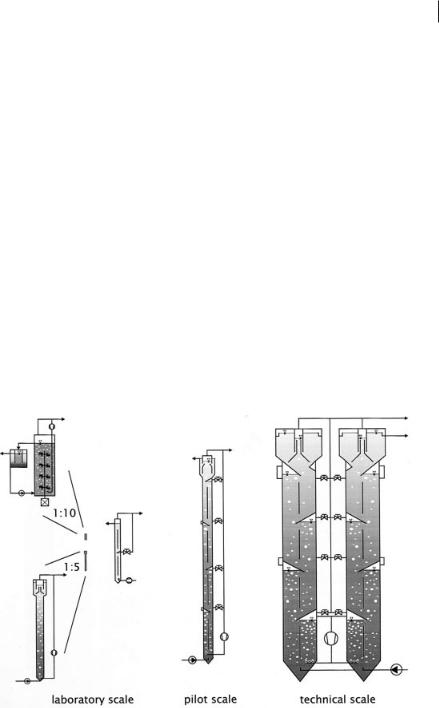
Parameters of the mathematical model elements must be identified by experiments, and the models have to be evaluated with respect to their suitability for the design of technical scale biogas reactors. The scale-up strategy is demonstrated in Figure 6.2 with explanations in Table 6.1. Basic experiments are done in the laboratory. The hydrodynamic behavior and the sedimentation of non-active biomass were studied first in a small reactor unit with a height of 6.5 m. This laboratory reactor has a diameter of 0.4 m and consists of only two modules. To understand the influence of
Fig. 6.2 Strategy for scale-up of the biogas tower reactor, specification of reactors according to Table 6.1.

166 6 Modeling of Biogas Reactors
Table 6.1 Specification of biogas reactors used for the experiments.
|
Experiments |
Kinetics |
Hydro- |
Local |
Mass |
Influence of |
|
|
|
dynamic |
Distribution |
Transport |
Hydrostatic |
|
|
|
and |
of Biomass |
of Product |
Pressure |
|
|
|
Liquid |
|
Gas |
|
|
Reactors |
|
Mixing |
|
|
|
|
|
|
|
|
|
|
LaborStirred tank reactor, active |
|
|
|
|
|
|
atory |
volume 16 L |
|
|
|
|
|
|
Two UASB reactors with |
|
|
|
|
|
|
biogas recirculation, active |
|
|
|
|
|
|
volume 36.5 L and 39.5 L, height |
|
|
|
|
|
|
1.7 m and 1.95 m, respectively |
|
|
|
|
|
|
Laboratory tower reactor, |
|
|
|
|
|
|
height 6.5 m, diameter 0.4 m, |
|
|
|
|
|
|
two modules |
|
|
|
|
|
|
|
|
|
|
|
|
Pilot |
Pilot scale tower reactor, |
|
|
|
|
|
|
height 20 m, diameter 1 m, |
|
|
|
|
|
|
volume 15 m3, four modules, |
|
|
|
|
|
|
photo of reactor shown in Figure 6.3 |
|
|
|
|
|
|
|
|
|
|
|
|
Fig. 6.3 Biogas tower reactor, pilot scale, at the site of Deutsche Hefewerke in Hamburg, built by Preussag Wassertechnik GmbH, Bremen.

6.2 Measuring Techniques 167
Table 6.2 Characteristic data of the wastewater used for the experiments.
|
Average |
Range |
Unit |
|
|
|
|
Total organic carbon (TOC) |
13.8 |
11–19 |
g L–1 |
Chemical oxygen demand (COD) |
31 |
25–36 |
g L–1 |
COD (incl. betaine) |
44 |
|
g L–1 |
Betaine |
5.7 |
4–10 |
g L–1 |
Sulfate |
3.9 |
2.5–6.5 |
g L–1 |
Acetic acid |
58 |
0.6–120 |
mmol L–1 |
Total suspended solids (TSS) |
2.5 |
0.8–3 |
g L–1 |
pH |
4.5 |
4.3–5 |
– |
|
|
|
|
the height of a reactor, a pilot scale biogas reactor was built at the site of a company producing bakers’ yeast (Fig. 6.3). The reactor was designed on the basis of the laboratory scale experiments and investigations on the kinetics of wastewater digestion from bakers’ yeast production. The characteristic data of the wastewater are given in Table 6.2. The active volume of the reactor is 15 m3. It is divided into four modules and at the top of the reactor a settling zone is integrated to maintain a high sludge concentration. The pilot reactor is well equipped with instruments for measuring concentrations and velocities along the height of the reactor. Because the pilot scale reactor reaches almost the height of a technical reactor (in Fig. 6.2 two reactor units with a height of 25 m and a diameter of 3.5 m are shown as examples) it is assumed that the mathematical model, which is evaluated on the pilot scale with respect to hydraulics and takes into account the influence of hydrostatic pressure, will permit prediction of the behavior of a technical scale reactor.
6.2
Measuring Techniques
To understand the microbial degradation process and the system behavior of a biogas reactor and to establish reliable mathematical models, measuring techniques must be available – if possible – to analyze online special substances in the fermentation broth. Therefore, some new measuring techniques have been developed during the last years.
6.2.1
Online Measurement Using a Mass Spectrometer
The anaerobic treatment of wastewater loaded with high concentrations of sulfate is often accompanied by problems due to inhibition by hydrogen sulfide (H2S). It is well established that the inhibition is caused by undissociated hydrogen sulfide present in the liquid phase and not by the total sulfide content. This concentration of undissociated hydrogen sulfide depends on sulfate concentration in the wastewa-

168 6 Modeling of Biogas Reactors
ter, pH, and ionic strength. The concentration of undissociated hydrogen sulfide in the liquid phase undergoes great changes in the pH range used for anaerobic digestion, which is between 6.6 and 7.4. Since the actual concentration of dissolved H2S cannot be calculated on the basis of the H2S partial pressure in the biogas, because gas phase and liquid phase are not in equilibrium as is demonstrated in Section 6.5, this concentration has to be measured.
Measurement on the basis of ion-sensitive electrodes proved to be very problematic, especially with respect to their stability for a long period of time. Meyer-Jens et al. (1995) developed a new type of probe connected to a mass spectrometer. The probe consists of a small tube (outer diameter 0.9 mm, inner diameter 0.7 mm) of polydimethylsilicon. The tube can be inserted directly into the fermentation liquid of the biogas reactor. The H2S dissolved in the liquid phase penetrates the membrane and is transported by a carrier gas (technical nitrogen) to the mass spectrometer.
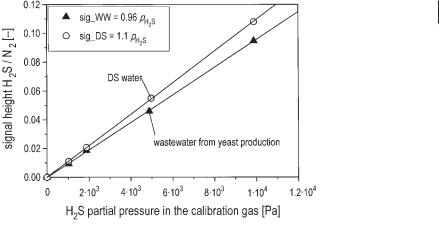
A very simple silicon membrane probe is shown in Figure 6.4. The silicon membrane tube is arranged in a short bypass loop outside of the reactor. The fermentation liquid flows outside of the tube while the carrier gas passes inside. In Figure 6.5 calibration of the measurement system is demonstrated. The calibration curve is perfectly linear within the relevant H2S concentrations. The different gradient for
Fig. 6.4 Configuration of a silicon membrane probe operated in a short bypass at the reactor (after Polomski, 1998).
6.2 Measuring Techniques 169
Fig. 6.5 Calibration of the silicon membrane probe coupled with a mass spectrometer measuring the concentration of dissolved H2S in desalinated water (DS water) and in the wastewater of bakers’ yeast production. The ordinate gives the value of the signal with reference to the N2 signal of the carrier gas. The abscissa is the partial pressure of H2S, with which the liquid is in equilibrium (after Polomski 1998).
desalinated water and wastewater indicates the difference in the solubility (Henry coefficient) of H2S in desalinated water (78.2 mmol L–1 bar–1) and wastewater (68.5 mmol L–1 bar–1) at 37 °C (data given by Polomski, 1998).
The measurement system can also serve well for the detection of dissolved CO2 in the biogas reactor. Figure 6.6 shows the calibration curve for CO2 in a sample of desalinated water. Also with CO2 the solubility (Henry coefficient) for wastewater (2.21 · 10–4 mmol L–1 Pa–1) is 12% smaller than the literature data given for desalinated water (2.52 · 10–4 mmol L–1 Pa–1). Matz and Lennemann (1996) used a similar silicon membrane probe for online monitoring of biotechnological processes by gas chromatographic mass spectrometric analysis. The sensitivity of the probe system could be improved considerably by an instantaneous heating of the membrane to a temperature of 200 °C. This quasi online measuring procedure had a sampling period of 15 min between two successive measuring cycles. Substances like dimethylsulfide, butanethiol, cresol, phenol, ethylphenol, and indole at concentrations between 10 and 200 ppm were detected.
6.2.2
Online Monitoring of Organic Substances
with High-Pressure Liquid Chromatography (HPLC)
Zumbusch et al. (1994) reported the simultaneous online determination of betaine (trimethylglycine), N,N-dimethylglycine (N,N-DMG), acetic and propionic acid during the anaerobic fermentation of wastewater from bakers’ yeast production. Ammonia and chloride could also be measured. The determinations were carried out by
170 6 Modeling of Biogas Reactors
Fig. 6.6 Calibration of the silicon membrane probe coupled to mass spectrometer measuring the dissolved CO2 in desalinated water (after Polomski, 1998).
means of isocratic cation exchange chromatography. For the detection of betaine and N,N-DMG an ultraviolet detector was used. All other substances were detected by conductivity.
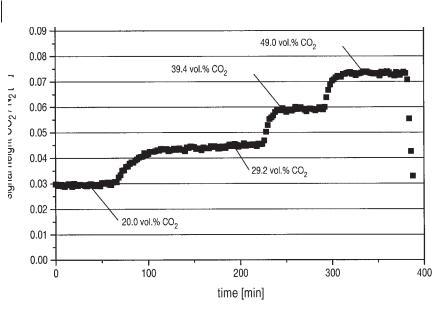
Besides other organic components, such as acetic and propionic acid, betaine is the dominant organic substance in the wastewater. Up to 33% of the TOC is represented by betaine. The use of HPLC analysis combined with an automated ultrafiltration setup for online process monitoring gives interesting information about the dynamic behavior of the anaerobic process, as demonstrated in Figure 6.7. The graphs show the effect of hydrogen sulfide elimination from the fermentation broth. The concentration of undissociated H2S was decreased by a factor of 2 (from 300 to 150 mg L–1). During the same time biogas production increased. The concentration of acetic acid decreased while the other acids measured remained more or less stable. Betaine was completely degraded only at lower H2S concentrations. Interestingly, the concentration of N,N-DMG, which is a metabolic product of the anaerobic degradation of betaine, is also decreased.
6.3 Kinetics
The anaerobic degradation of organic substances is performed in a sequence of biological reactions in a synthrophic cooperation of different microorganisms