

Environmental Biotechnology - Jordening and Winter
.pdf110 3 Activated Sludge Process
To achieve a nitrogen removal efficiency of 86% (çN = 0.86) at, e.g., t* = 13 h and tD/(tN + tD) = 0.35, the cycle period should be tN + tD = 2.75 h.
Eq. 45 indicates that, by variation of the cycle period, technically any removal efficiency can be tuned, but as a prerequisite the nitrate removal capacity of the process must be observed. Cycle periods of less than tN + tD = 1 h, however, are not recommended. From the ratio VD/V (Eq. 27) the ratio tD/(tN + tD) can be calculated:
tD/(tN + tD) = VD/V |
(46) |
3.3.3.6Intermittent nitrification–denitrification processes with intermittent wastewater feeding
Intermittent wastewater feeding is used in three processes:
•alternating nitrification–denitrification process (Bio-Denitro)
•Tri-Cycle process
•Jülich wastewater treatment process (JARV)
The alternating nitrification–denitrification process consists of pairs of activated tanks, each equipped with aeration equipment and mixing devices. The two parallel interconnected tanks are alternately fed with wastewater and return sludge. While one tank is fed, the mixed liquor is discharged from the other to the final clarifier (Fig. 3.23). This process was developed in Denmark at a plant with two parallel oxidation ditches. It was named the Bio-Denitro process [67].
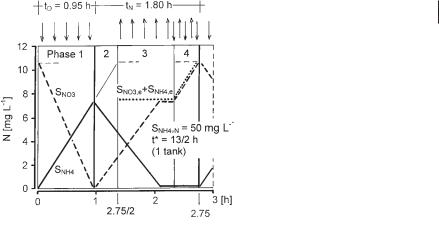
The time courses of ammonia and nitrate levels during a cycle theoretically looks similar to those obtained with intermittent nitrification–denitrification (Fig. 3.24). The effluent concentration of nitrogen can be calculated in a similar way as for intermittent nitrification–denitrification.
The alternating nitrification–denitrification process is usually controlled with a timer. However, SØrensen [68] demonstrated that inline monitoring of nitrate and ammonia and use of appropriate control measures improved the effluent quality.
In Denmark numerous plants are designed for the alternating nitrification–denit- rification process. There are also some plants in Germany, e.g., a newer one in Stuttgart Feuerbach.
Fig. 3.23 Flow diagram of the alternating nitrification–denitrifica- tion process.
3.3 Plant Configurations 111
Fig. 3.24 Time courses of ammonia and nitrate levels in one of the tanks in the alternating nitrification–denitrifica- tion process.
In the Tri-Cycle process three interconnected aeration tanks are consecutively (controlled by a timer) fed with wastewater and return sludge. A cycle begins with a mixing period for denitrification which normally lasts as long as the feeding period (1/3 of the cycle period). Valves in the connecting pipes and at the inlet and outlet of the tanks guide the mixed liquor through the three tanks. Mixed liquor is discharged to the final clarifier from the aeration tank that is aerated for the longest period. This process is used in at least six plants in Germany. Unfortunately only brochures of the company (GVA, Wülfrath, Germany) that developed this process are available.
The Jülich Wastewater Treatment Process (JARV) was developed to overcome problems with bulking sludge in completely mixed aeration tanks. The key of the process is a rather short feeding period compared to the cycle period [69]. This requires a balancing tank upstream of the aeration tank and an effluent gate to equalize the flow to the final clarifiers. Balancing is avoided if, e.g., four parallel aeration tanks are consecutively fed with wastewater. The effluent from the aeration tanks may contain considerable ammonia peaks. It is, therefore, advisable to build a small post-aeration basin between the aeration tanks and the final clarifiers. Only two plants in Germany are operated by this process.
The differences of the three processes relative to the intermittent nitrifica- tion–denitrification process are that almost all readily biodegradable organics are available for denitrification, that there is a higher concentration gradient by which the sludge volume index can be improved, and that during the discharge period the mixed liquor is aerobic (except in the JARV process if a post aeration tank is omitted). The anoxic tank fraction (VD/V) can be estimated as for the pre-anoxic zone denitrification process (Eq. 26).
3.3.3.7Special processes for low COD/TKN ratio
Wastewater from the food industry may be characterized by high concentrations of organics as well as considerable nitrogen concentrations. Anaerobic pretreatment of

112 3 Activated Sludge Process
such sewages is favorable because of the negligible sludge production and energy requirement. If nitrogen removal is required, the COD/TKN ratio can however decrease too much for sufficient denitrification.
Since denitrification of nitrite requires about 35% less organics than denitrification of nitrate, a process in which Nitrosomonas were inhibited was developed by Abeling [70]. The pre-anoxic zone process was operated with a control system to maintain the pH at about pH = 8 by dosing the aerobic tank with NaOH and to keep ammonia at SNH4 = 10 mg L–1 by appropriate aeration control. According to the findings of Anthonisen et al. [45] and Nyhuis [46] (Fig. 3.10), these are conditions under which Nitrobacter are inhibited. Because there is always some ammonia and some nitrite in the effluent, a second stage using a fixed-film reactor was implemented.
A different method of removing high nitrogen concentrations without any organic substrate was published by Jetten et al. [71]. In a continuous-flow stirred reactor as a first stage, about 50% of ammonia was converted to nitrite; and in a second stage a fixed-film reactor converted nitrite to nitrogen gas (N2) by autotrophic bacteria using ammonia as electron donor. However, this is not regarded as an activated sludge process.
3.3.3.8 Post-denitrification with external organic carbon
Few plants around the world use external carbon as the sole carbon source for denitrification in single-stage activated sludge plants. One such plant was constructed to treat the whole wastewater of the Salzgitter Steel Works in Germany.
The wastewater originates from treated blast furnace gas (high ammonia loads), treated coke oven gas (phenols, cyanides, ammonia, etc.), and several other discharges. The total flow of about 50 000 m3 d–1 contains about 35 mg L–1 ammonia nitrogen. Because soft water is used for cooling, the alkalinity is low. Therefore, experiments were first carried out using the pre-anoxic zone process to gain as much alkalinity as possible. Since the organic carbon content of the wastewater was too low, methanol had to be added to ensure sufficient nitrate removal, but the process was very unstable due to the toxic components of the wastewater.
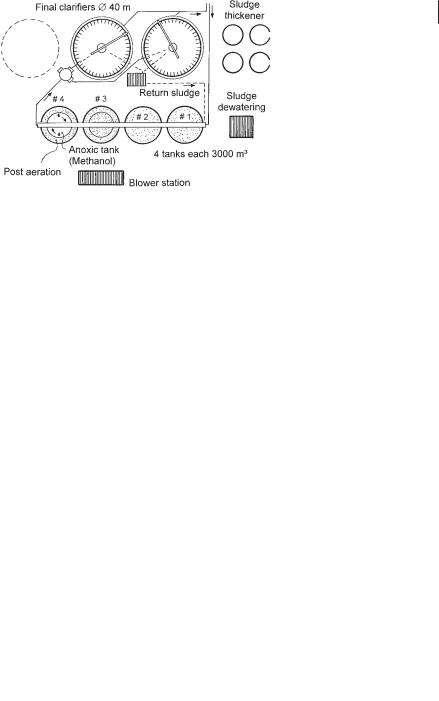
The process was therefore changed to post-denitrification, with satisfying experimental results [72]. The full-scale plant is shown in Figure 3.25. It is possible to operate the first two aeration tanks (#1 and #2) in parallel, to prevent a strong concentration gradient of the toxic substances, but this has not been necessary. The center zone of tank #4 (1500 m3), to which methanol is added in response to the measured nitrate concentration in the tank, serves as a denitrification zone. In the final aerated zone (1500 m3) accidentally overdosed methanol is oxidized. Tank #3, for maintenance purposes, is constructed like tank #4. During normal operation both parts of this tank are aerated.
To remove 1250 kg of nitrate nitrogen per day, 3500 kg of methanol per day are consumed, which is in the practical range of 2.5 to 3.0 kg methanol per kg nitrate nitrogen to be denitrified [72].
3.3 Plant Configurations 113
Fig. 3.25 Flow diagram of the wastewater treatment plant of the Salzgitter Steel Works (post-denitrification) [72].
3.3.4
Interactions between the biological reactors and the final clarifiers
The biological reactor and the final clarifier, linked by the return sludge flow, form a unit process. The conditions shown in Figure 3.26 for rectangular tanks with scrapers are similar to those in circular tanks with scrapers. For steady-state conditions, suspended solids concentration (SSRS) of the return sludge is a function of MLSS and the return sludge flow ratio (QRS/Q):
SSRS = MLSS · |
Q + QRS |
= MLSS · 1 + |
Q. |
|
(47) |
QRS |
QRS |
Since MLSS is kept constant by withdrawing excess sludge, the suspended solids concentration (SSRS) of the return sludge increases with decreasing return sludge flow (QRS). The return sludge flow is the sum of the flow of thickened sludge (Qsl with SSsl) and the short circuit flow (Qshort with MLSS). Since the return sludge flow is set by the return sludge pumping rate and the flow of thickened sludge to the hopper depends on the speed and other factors of the scraper as well as the height of the bottom sludge layer (hS), the short circuiting flow is obtained with Eq. 48:
Qshort = QRS – Qsl |
(48) |
Fig. 3.26 Interaction between biological reactor and final clarifier.

114 3 Activated Sludge Process
As long as QRS > Qsl there will be some short circuit flow, but if
Qsl · SSsl QRS · SSRS |
(49) |
the sludge in the clarifier may accumulate (increasing hS) if the wastewater flow and hence the solids load in the final clarifier increases. In practice, therefore, QRS should be higher than Qsl.
For return sludge pumping two strategies are common:
•constant flow of QRS at least during dry-weather periods
•constant ratio QRS/Q
Because of the diurnal fluctuation in wastewater flow, at constant QRS the bottom sludge layer height hS and SSRS fluctuate approximately in parallel with Q, and MLSS fluctuates inversely to the wastewater flow variation. If the return sludge ratio QRS/Q is kept constant SSRS fluctuates only a little. But if, e.g., during sudden storm water flows, the return sludge flow is immediately increased so as to keep QRS/Q constant, the short circuit flow increases and SSRS decreases accordingly. It therefore makes sense to keep the ratio of QRS to the 1–2 h sliding average of Q constant.
The main design parameter for horizontal-flow clarifiers is the sludge volume surface load qSV expressed as L of sludge per m2 of clarifier surface (Aclar in m2) and hour (Qh is the hourly peak flow in m3 h–1):
|
Qh · MLSS · ISV |
|
|
qsv = |
|
[L m–2 h–1] |
(50) |
|
|||
|
Aclar |
|
|
These and all further design calculations for clarifiers have been compiled by Ekama et al. [73]. The construction of the mixed liquor inlet, as well as of the clear water outlet and the sludge collection system, are also important for the performance of clarifiers.
If aeration tanks having a depth of more than 6 m precede the final clarifier, mixed liquor may float due to over-saturation with nitrogen. Measures to prevent floating include [74]:
•Stripping of nitrogen gas by an overflow weir cascade at the aeration tank outlet or by intensive coarse-bubble aeration in a shallower outlet zone of the aeration tank.
•Applying deep final clarifiers in which mixed liquor is introduced near the bottom.
3.4
Design procedure
Detailed design information may be taken from handbooks [e.g., 75, 76]. In addition, for final clarifier design, Ref. 73 is recommended. The main design steps for single-stage activated sludge plants comprise:

3.4 Design procedure 115
1.Determination of the design loads (e.g., BOD5, COD, suspended solids, nitrogen, phosphorous), the average alkalinity, the wastewater flow (daily and peak), and the peak storm water flow (m3 h–1). Existing data should be checked for annual fluctuations in the wastewater temperature, the loads, and the flows. If nitrification is required, the design load should be selected in combination with the wastewater temperature. The time period with the highest two-week average COD load at the lowest wastewater temperature can be selected to determine the critical sludge age and the sludge production. The highest oxygen demand may however have to be calculated for another period (e.g., summer).
2.Required effluent quality as percent removal or as concentrations (CBOD,e, CCOD,e, SNH4,e, SNO3,e, SP,e, SSe). Mode of inspection, e.g., grab sample or 24-h composite sample. Value to be maintained, e.g., the annual average, 80% of all days, or 80% of grab samples.
3.Selection of the process configuration. Should it be with primary sedimentation? Aerobic selector? Anaerobic mixing tank for enhanced phosphate removal? Phosphate precipitation (and what type of precipitant)? Process for nitrogen removal? Addition of external organic carbon for nitrogen removal – continuously or temporarily? Necessity of adding N, P, and trace elements to specific industrial wastewater? Sludge disposal, separate stabilization, or costabilization of sludge?
4.An aerobic selector can be designed for a volumetric load of 20 kg COD (m3 d–1). For enhanced biological phosphate removal, an anaerobic contact period of 0.25–0.5 h (based on Q + QRS) can be assumed.
5.Selection of the aerobic sludge age (SRTaer) considering the degree of treatment,
e.g., organic carbon removal only; nitrification at any time, at certain time periods, or at periods beyond a certain reactor temperature (e.g., T 10 °C); costabil-
ization of sludge. The following values may be used: Organic carbon removal only: SRT = 4 d; nitrification at T ≥ 10° °C: SRTaer = 8–10 d.
6.For denitrification: estimation of the nitrate to be denitrified (Eq. 24). Assumption of anoxic tank volume fraction VD/V (Eqs. 26 or 27 or values from Figure 3.11). Calculation of sludge age with Eq. 28.
7.For costabilization of sludge (extended aeration) and nitrogen removal, a sludge age of SRT = 25 d can be assumed.
8.Calculation of the remaining alkalinity with Eq. 33 and, if aeration tanks deeper than 6 m are planned, checking of the resulting pH (Section 3.2.6.2).
9.Determination of the MLSS considering the sludge volume index ISV to be expected. It is recommended to first check the final clarifier design to decide upon the appropriate MLSS. Generally, MLSS = 3.0–5.0 kg m–3 is used in design calculations. Higher values should be used only if a sludge volume index of ISV = 100 mL L–1 or less can be expected.
10.Calculation of the daily mass of excess sludge with Eqs. 12 (Mexc,C) and 32 (Mexc,P). For settled municipal wastewater, as a rough estimate one can assume 0.4 to 0.5 kg excess sludge solids per kg COD influent. Finally, the reactor volume is calculated with Eq. 14.

1163 Activated Sludge Process
11.For nitrogen removal only: estimation of the required internal recycle flow (Eq. 37) or the wastewater distribution in the step-feed process (Eq. 40) or the cycle period for intermittent nitrification–denitrification processes (Eq. 44).
12.Design of the aeration installation, considering the minimum and maximum oxygen uptake rates (Eqs. 13, 16, and 25).
13.Design of the final clarifier. As a rough estimate for the surface area of horizontal flow clarifiers, a volumetric sludge surface loading rate of qSV ≤ 450 L m–2 h–1 (Eq. 50) can be assumed. The side wall water depth should not be less than
3.00 m, and the average water depth should be in the range of 3.50–4.50 m (except, e.g., downstream of deep aeration tanks).
For larger plants it is recommended to check the results of static dimensioning with dynamic simulation. This should be considered with the collection of load data.
References
1von der Emde, W., Die Geschichte des Belebungsverfahrens, gwf Wasser Abwasser 1964, 105, 755–780.
2Ardern, E., Lockett, T., Experiments on the oxidation of sewage without the aid of filters, J. Soc. Chem. Ind. 1914, 33, 523–529.
3Pasveer, A., Abwasserreinigung im Oxidationsgraben, Bauamt und Gemeindebau 1958, 31, 78–85.
4Zeper, J., De Man, A., New developments in the design of activated sludge tanks with low BOD loadings, in:
Advances in Water Pollution Research, Vol. 1 (Jenkins, S.H., Ed.), pp. II-8/ 1–10, Oxford 1970: Pergamon.
5Pasveer, A., Sweeris, S., A new development in diffused air aeration. T. N. O. Working Report A 1962, 27, Delft, NL: TNO.
6Scherb, K., Vergleichende Untersuchungen über das Sauerstoffeintragsvermögen verschiedener Belüftungssysteme auf dem Münchener Abwasserversuchsfeld,
Münchener Beiträge zur Abwasser-, Fischerei und Flußbiologie 1965, 12, 330–350.
7Wagner, M., Darstellung von Schadensfällen durch belegte EPDM-Membranen
und Lösungsmöglichkeiten, Schriftenreihe WAR TH Darmstadt 2001, 134, 71–84.
8Mueller, J. A., Boyle, W. C., Pöpel, H. J.,
Aeration: Principles and Practice. Boca Raton FL 2002: CRC Press.
9Jübermann, O., Krause, G., Die Zentralkläranlage der Erdölchemie GmbH und der Farbenfabriken Bayer AG in Dormagen; Ejektorbelüftung in der biologischen Abwasserreinigung, Chem. Ing. Techn. 1968, 40, 288–291.
10Ullrich, A. J., Smith, M. W., The biosorption process of sewage and waste treatment, Sewage. Ind. Wastes 1951, 23, 1248–1252.
11Imhoff, K., Das zweistufige Belebungsverfahren für Abwasser, gwf Wasser Abwasser 1955, 96, 43–45.
12Böhnke, B., Möglichkeiten der Abwasserreinigung durch das Adsorptions-Bele- bungsverfahren. Gewässerschutz–Wasser– Abwasser, RWTH Aachen 1978, 25, 437– 466.
13Bringmann, G., Vollständige biologische Stickstoffeliminierung aus Klärwässern im Anschluß an ein Hochleistungsnitrifikationsverfahren, Ges. Ing. 1961, 82, 233–235.
14Wuhrmann, K., Stickstoffund Phosphorelimination, Ergebnisse von Versuchen im technischen Maßstab, Schweiz. Z. Hydrol. 1964, 26, 520–558.
15Ludzack, F. J., Ettinger, M.B., Controlling operation to minimize activated sludge effluent nitrogen, J. WPCF 1962, 35, 920–931.
16Pasveer, A., Über den Oxidationsgraben,
Schweizerische Z. Hydrol. 1964, 26(2), 466–484.

17Kienzle, K. H., Untersuchungen über BSB5 und Stickstoffelimination in schwachbelasteten Belebungsanlagen mit Schlammstabilisation. Stuttgarter Berichte zur Siedlungswasserwirtschaft, 47. München 1971: R. Oldenbourg.
18Barnard, J. L., Biological denitrification,
Water Pollut. Contr. 1973, 72, 705–720.
19Barnard, J. L., Cut P and N without chemicals, Water Wastes Eng. 11, 33–36.
20Krauth, K. H., Staab, K.F., 1982, Stickstoffelimination durch vorgeschaltete Denitrifikation, Wasserwirtschaft 1974, 72, 251–252.
21von der Emde, W., Die Kläranlage Wien Blumental, Oesterr. Wasserwirtschaft
1971, 23, 11–18.
22Matché, N. F., The Elimination of nitrogen in the treatment plant of Vienna– Blumental. Water Res. 1972, 6, 485–486.
23Thomas, E. A., Verfahren zur Entfernung von Phosphaten aus Abwässern,
Swiss Patent No. 361 543 1962.
24Morgenroth, E., Wilderer, P. A., Continuous flow and sequential processes in municipal wastewater treatment, in:
Biotechnology: A Multi-volume Comprehensive Treatise, Vol. 11a, Environmental Processes I, (Winter, J., Ed.), pp. 312–334. Weinheim 1999: Wiley-VCH.
25Kayser, R., Bemessung von Belebungsund SBR-Anlagen, ATV-DVGW-Kom- mentar zum ATV-DVGW-Regelwerk, Hennef, Germany 2001: ATV-DVWK.
26Kulpberger, R. J., Matsch, L. C., Comparison of treatment of problem wastewater with air and high purity oxygen activated sludge systems, Prog. Water Technol. 1977, 8(6), 141–151.
27Lang, H., Nitrifikation in biologischen Klärstufen mit Hilfe des Bio-2-Schlamm- Verfahrens, Wasserwirschaft 1981, 71, 166–169.
28Schlegel, S., Der Einsatz von getauchten Festbettkörpern beim Belebungsverfahren, gwf Wasser Abwasser 1986,
127, 421–428.
29Lessel, T. H., First practical experiences with submerged rope-type biofilm reactors, Water Sci. Technol. 1991, 23, 825– 834.
30Heinz, A., Röthlich, H., Leesel, T., Kopmann, T., Erfahrungen mit ring-lace Festbettreaktoren in der kommunalen
References 117
Abwasserreinigung, Wasser Luft Boden 1996, 40(4), 18–20.
31Morper, M. R., Upgrading of activated
sludge systems for nitrogen removal by application of the LINPOR process,
Water Sci. Technol. 1994, 29(12), 107–112.
32Takahashi, M., Suzuki, Y., Biological enhanced phosphorus removal process with immobilized microorganisms, Veröffentlichungen des Instituts für Siedlungswasserwirtschaft und Abfallwirtschaft Universität Hannover 1995, 92, 22/1–22/12.
33Vogelpohl, A., Hochleistungsverfahren und Bioreaktoren für die biologische Behandlung hochbelasteter industrieller Abwässer, in: Behandlung von Abwässern, Handbuch des Umweltschutzes und der Umweltschutztechnik, Vol. 4 (Brauer, H. Ed.), pp. 391–413. Berlin 1996: SpringerVerlag.
34Brauer, H., Aerobe und anarobe biologische Behandlung von Abwässern im Hub- strahl-Bioreaktor, in: Behandlung von Abwässern, Handbuch des Umweltschutzes und der Umweltschutztechnik, Vol. 4 (Brauer, H., Ed.), pp. 414–504. Berlin 1996: Sprin- ger-Verlag.
36Krauth, Kh., Staab, K. F., Substitution of the final clarifier by membrane filtration within the activated sludge process: initial findings, Desalination 1988, 68, 179–189.
37van der Roest, H. F., Lawrence, D. P., van Betem A. G. N., Membrane bioreactors for municipal wastewater treatment, Water and Wastewater Practitioner Series: STOWA Report, London 2002: IWA.
38Begert, A., Summenund Gruppenparameter für organische Stoffe von Wasser und Abwasser, Wiener Mitteilungen Wasser, Abwasser, Gewässer 1985, 57, G1–G29.
39Henze, M., Gujer, W., Takahshi, M., van Loosdrecht, M., Activated sludge models ASM1, ASM2, ASM3d and ASM 3. IAWQ Scientific and Technical Report No. 9. London 2000: IAWQ.
40Wuhrmann, K., von Beust, F., Zur Theorie des Belebtschlammverfahrens, II. Über den Mechanismus der Elimination gelöster organischer Stoffe aus Abwasser,
Schweiz. Z. Hydrol. 1958, 20, 311–330.
41Tischler. L. F., Linear Removal of Simple Organic Compounds in the Activated Sludge Process, Thesis, The University of Texas, Austin, TX 1968.

118 3 Activated Sludge Process
42Gujer, W., Kayser, R., Bemessung von Belebungsanlagen auf der Grundlage einer CSB-Bilanz, Korrespondenz Abwasser 1998, 45, 944–948.
43Stensel, H. D., Barnard, J. L., Principles of biological nutrient removal, in: Design and Retrofit of Wastewater Treatment Plants for Nutrient Removal (Randal, C. W., Barnard, J. L., Stensel, H. D., Eds), pp. 25–84. Lancaster, PA 1992: Technomic Publishing.
44Knowles, G., Downing, A. L., Barrett, M. J., Determination of kinetic constants for nitrifying bacteria in mixed culture, J.
Gen. Microbiol. 1965, 38, 263–278.
45Kayser, R., A 131: Quo vadis, Wiener Mitt. Wasser, Abwasser, Gewässer 1997,
114, 149–166.
46Anthonisen, A. C., Loehr, R. C., Prakasam, T. B. S., Srinath, E. G., Inhibition of nitrification by ammonia and nitrous acid, J. WPCF 1976, 24, 835–852.
47Nyhuis, G., Beitrag zu den Möglichkeiten der Abwasserbehandlung bei Abwässern mit erhöhten Stickstoffkonzentrationen. Veröffentlichungen des Instituts für Siedlungswasserwirtschaft und Abfalltechnik der Universität Hannover 61 1985.
48Wicht, H., Beier, M., N2O-Emissionen aus nitrifizierenden und denitrifizierenden Kläranlagen, Korrespondenz Abwasser
1995, 42, 404–413.
49Wicht, H., N2O-Emissionen durch den Betrieb biologischer Kläranlagen, Veröffentlichungen des Instituts für Siedlungswasserwirtschaft TU Braunschweig, 58 (1995).
50EPA Nitrogen Removal, Process Design Manual. Environmental Protection Agency, Cincinnati, OH 1975.
51Kappeler, J. und Gujer, W., Estimation of kinetic parameters of heterotrophic biomass under aerobic conditions and characterization of wastewater for activated sludge modelling, Water Sci. Technol. 1992, 25(6), 125–139.
52Barnard, J. L., Design of prefermentation process, in: Design and Retrofit of Wastewater Treatment Plants for Nutrient Removal (Randal, C. W., Barnard, J. L., Stensel, H. D., Eds), pp. 85–96. Lancaster PA 1992: Technomic Publishing.
53Schön, G., Jardin, N., Biological and chemical phosphorus elimination, in:
Biotechnology: A Multi-volume Comprehensive Treatise, Vol. 11a, Environmental Processes I (Winter, J., Ed.), pp. 285–319.
Weinheim 1999: Willey-VCH.
54Nowak, O., Nitrifikation im Belebungsverfahren bei maßgebendem Mischwasserzufluss. Wiener Mitt. Wasser, Abwasser, Gewässer 135 (1996).
55Kayser, R., Activated sludge process, in;
Biotechnology: A Multi-volume Comprehensive Treatise, Vol. 11a, Environmental Processes I (Winter, J., Ed.), pp. 253–283. Weinheim 1999: Willey-VCH.
56Mohlman, F. W., The sludge index,
Sewage Works J. 1934, 6, 119–122.
57Jenkins, D., Daigger, G. T., Manual on the Causes and Control of Activated Sludge Bulking, Foaming and Other Solids Separation Problems, 3rd Edn. Boca Raton FL 2003: CRC Press.
58Cooper, P. F., Collinson, B., Green, M. K., Recent advances in sewage effluent denitrification: Part II, Water Pollut. Control
1977, 76, 389–398.
59Miyaji, Y., Iwasaki, M., Serviga, Y., Biological nitrogen removal by step-feed process, Prog. Water Technol. 1980, 12(6), 193–202.
60Schlegel, S., Nitrifikation und Denitrifikation in einstufigen Belebungsanlagen; Betriebsergebnisse der Kläranlage Lüdinghausen, gwf Wasser Abwasser 1983, 124, 428–434.
61Matsché, N. F., Removal of nitrogen by simultaneous nitrification–denitrification in an activated sludge plant with mammoth rotor aeration, Prog. Water Technol. 1977, 8(4–5), 625–637.
62Ermel, G., Stickstoffentfernung in einstufigen Belebungsanlagen: Steuerung der Denitrifikation. Veröffentlichungen des Instituts für Stadtbauwesen TU Braunschweig 35
1983.
63Seyfried, C. F., Hartwig, P., Großtechnische Betriebserfahrungen mit der biologischen Phosphatelimination in den Klärwerken Hildesheim und Husum, Korrespondenz Abwasser 1991, 38, 184–190.
64Kayser, R., Process control and expert systems for advanced wastewater treatment plants. in: Instrumentation and Control of Water and Wastewater Treatment and Transport Systems (Briggs, R., Ed.), pp. 203–210. Oxford 1990: Pergamon.

65Wareham, D. G., Hall, K. J., Mavinic, D. S., Real-time control of aerobic anoxic sludge digestion using ORP, ASCE J. Env. Eng. 1993, 119, 120–136.
66Boes, M., Stickstoffentfernung mit intermittierender Denitrifikation: Theorie und Betriebsergebnisse, Korrespondenz Abwasser 1991, 38, 228–234.
67Tholander, B., An example of design of activated sludge plants with denitrification, Prog. Water Technol. 1977, 9(4–5), 661–672.
68Sørensen, J., Optimization of a nutrient removing wastewater treatment plant using on-line monitoring, Water Sci. Technol. 1996, 33(1), 265–273.
69Zanders, E., Groeneweg, J., Soeder, C. J., Blähschlammverminderung und simultane Nitrifikation/Denitrifikation,
Wasser-Luft-Betrieb 1987, 31(9), 20–24.
70Abeling, U., Stickstoffelimination aus Industrieabwässern; Denitrifikation über Nitrit. Veröffentlichungen des Instituts für Siedlungswasserwirtschaft und Abfalltechnik der Universität Hannover 86 (1994).
71Jetten, M. S. M., Horn, S. J., van Loosdrecht, M. C. M., Towards a more sus-
References 119
tainable municipal wastewater treatment system, Water Sci. Technol. 1997, 35(6), 171–180.
72Zacharias, B., Biologische Stickstoffelimination hemmstoffbelasteter Abwässer am Beispiel eines Eisenhüttenwerkes,
Veröffentlichungen des Instituts für Siedlungswasserwirtschaft TU Braunschweig, 60
(1996).
73Ekama, G. A., Barnard, J. L., Günthert, F. W., Krebs, P., McCorquodale, J. A., Parker, D. S., Wahlberg, E. J., Secondary settling tanks: theory, modelling, design and operation. IAWQ Scientific and Technical Report No. 6, London 1997: IAWQ.
74ATV, Hinweise zu tiefen Belebungsbecken, Korrespondenz Abwasser 1996, 43, 1083–1086.
75Randal, C. W., Barnard, J. L., Stensel, H. D., Design and Retrofit of Wastewater Treatment Plants for Nutrient Removal. Lancaster, PA 1992: Technomic Publishing.
76ATV, ATV Handbuch: Biologische und weitergehende Abwasserreinigung, 4th Edn. Berlin 1997: Ernst & Sohn.