Chapter 5
Troubleshooting the
Network with
Sniffers
Solutions in this chapter:
■Understanding Packet Analysis and TCP Handshakes
■Creating Filters Using Tcpdump
■Configuring Ethereal to Capture Network Packets
■Viewing Network Traffic between Hosts Using EtherApe
;Summary
;Solutions Fast Track
;Frequently Asked Questions
261

262 Chapter 5 • Troubleshooting the Network with Sniffers
Introduction
A sniffer, or packet sniffer, is software or hardware that captures network traffic. This traffic can be analyzed to determine problems in a network, such as bottlenecks or performance degradation. It can also confirm hacker attacks against your network systems. If you suspect a system is under attack, you can capture the packets on its interface to identify what types of packets are hitting the system, as well as where the packets originated. Once a problem is determined, an administrator can make network changes to ensure that the network operates efficiently and securely.
Packet sniffers capture packets on a specific interface, or on all interfaces, depending on how you configure the sniffer. By default, they display all traffic captured on the network. However, this usually results in far too much traffic for an administrator to sort through.Therefore, sniffers offer filters that allow you to only capture and display packets that meet particular criteria. For instance, you may only be interested in capturing packets between one client and one server to determine the server’s response time, or to determine why a particular client cannot access a server. Sniffers allow you to enter the Internet Protocol (IP) addresses of the client and server, so that only the network traffic between the two IP addresses will be captured and displayed.
This chapter introduces you to three popular open source Linux sniffers:
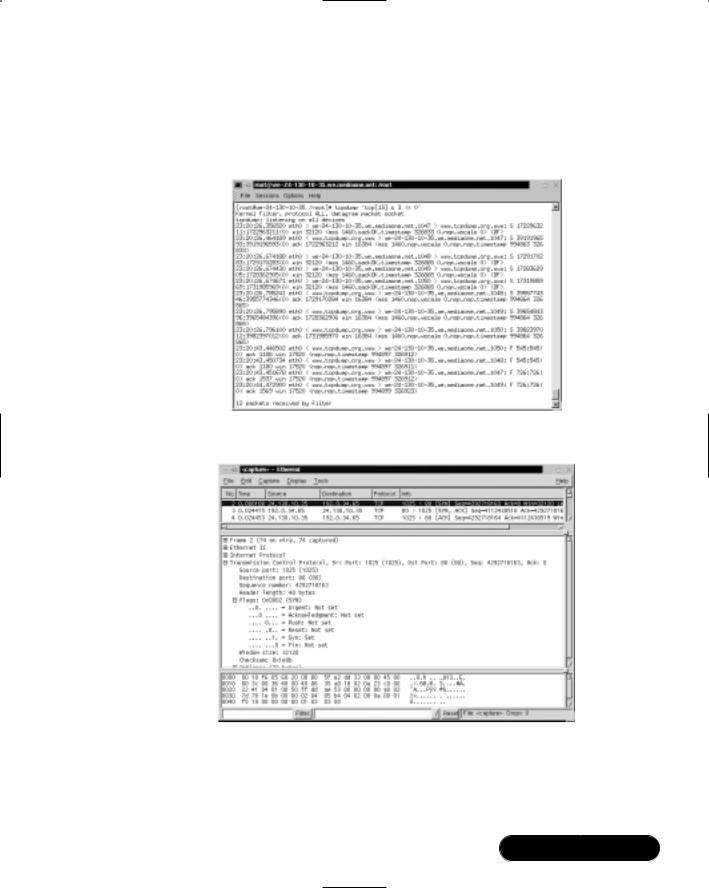
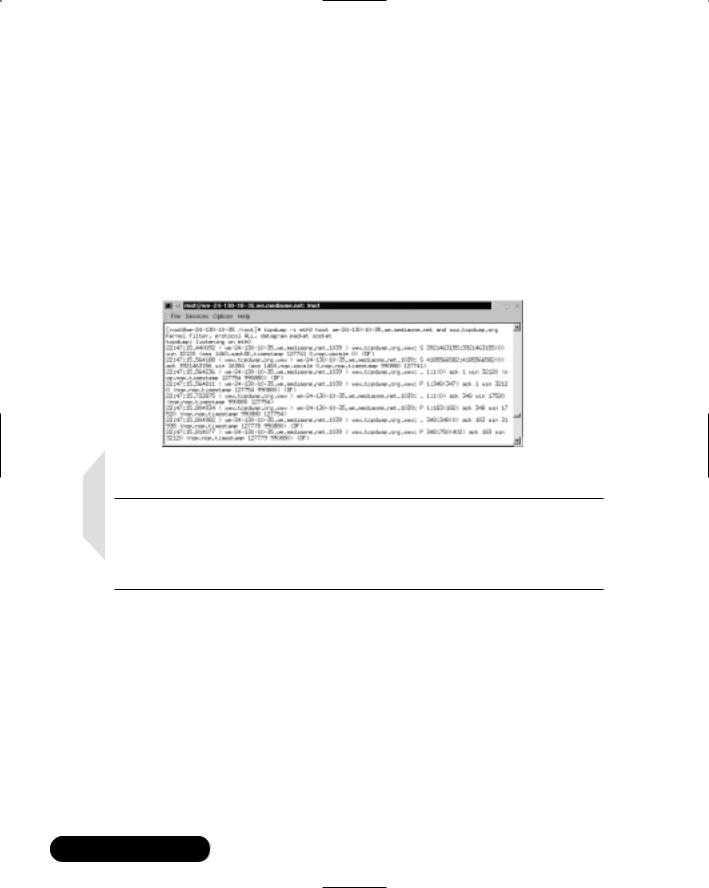
■Tcpdump A command-line network traffic monitoring tool. It has been around for a long time and most graphical sniffers depend on it. Visit the tcpdump public repository at www.tcpdump.org.Tcpdump is shown in Figure 5.1.
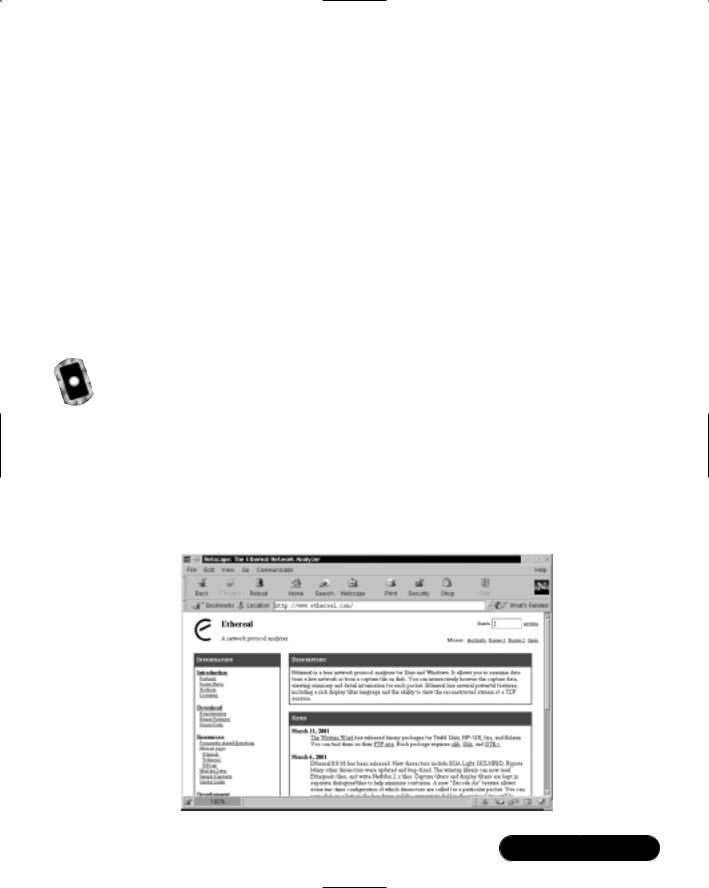
■Ethereal A graphical network traffic-monitoring tool that is more user friendly than tcpdump. It allows you to view real-time packet captures and uses many tcpdump commands and options for filtering. Once the data is captured, Ethereal allows you to interactively view each packet and its individual headers. Descriptions of the packet headers are summarized. It also allows you to view reconstructed TCP streams. It displays real-time traffic, as well as traffic saved to a file.Visit the Ethereal home page at www.ethereal.com. Ethereal is shown in Figure 5.2.
■EtherApe A graphical network traffic monitoring tool. Unlike Ethereal, EtherApe displays networking activity graphically by identifying hosts and the links that exist between the hosts.The links are color coded and
www.syngress.com
Troubleshooting the Network with Sniffers • Chapter 5 |
263 |
change constantly as the host connections change. It displays real-time traffic, as well as traffic saved to a file.Visit the EtherApe home page at http://etherape.sourceforge.net. EtherApe is shown in Figure 5.3.
Figure 5.1 Tcpdump
Figure 5.2 Ethereal
When you complete this chapter, you will know how to configure a packet sniffer.These skills will be assumed throughout the rest of this book, as packet sniffing is used regularly to determine network problems and possible security violations.You will capture packets regularly as a security professional.
www.syngress.com

264 Chapter 5 • Troubleshooting the Network with Sniffers
Figure 5.3 EtherApe
Before you use the individual open source sniffers, you must understand how to read a packet and be able to analyze a Transmission Control Protocol (TCP) connection.Without these skills, you will be unable to analyze the traffic captured by the sniffers.
Understanding Packet
Analysis and TCP Handshakes
As you would expect, packet analysis requires an understanding of network packets.This chapter requires you to already understand the seven layers of the Open System Interconnection Reference Model (OSI/RM) and the TCP/IP protocols within each layer. If you are not familiar with the seven layers and their respective TCP/IP protocols, visit the Cisco Press Internetworking Basics document at www.cisco.com/cpress/cc/td/cpress/fund/ith2nd/it2401.htm. For additional Internetworking fundamentals documents, visit www.cisco.com/cpress/ cc/td/cpress/fund.
One of the most important tasks for a security administrator is analyzing TCP traffic. It can tell us a great deal about our network connections. It can also identify many denial-of-service (DoS) attacks and man-in-the-middle, or hijacking, attacks. Because TCP is the protocol used for making a connection in TCP/IP, a careful analysis of the connection process can be extremely helpful for all packet analysis.
www.syngress.com

Troubleshooting the Network with Sniffers • Chapter 5 |
265 |
TCP Handshakes
Whenever two hosts establish a connection on a TCP/IP network, a TCP handshake must occur to establish the session.The handshake consists of rules that the two hosts must follow. All sniffers are capable of viewing any TCP connection establishment and termination, which includes the TCP handshake.
TCP handshakes use special mechanisms, called flags, to establish and terminate a connection. Flags are included in the TCP header, and each flag completes a different function in the TCP connection process.The flags used in a TCP connection are listed in Table 5.1.The next section explains how the flags are used in a TCP handshake.
Table 5.1 Flags Used in TCP Connections
Flag |
Description |
|
|
SYN |
Synchronize sequence numbers. Used for connection establishment. |
FIN |
The sender is finished with the connection. Used for connection |
|
termination. |
RST |
Reset the connection. |
PSH |
Push the data. |
ACK |
Acknowledgment |
URG |
Urgent |
|
|
Establishing a TCP Connection
To open a TCP connection, the TCP header includes different flags.The hosts exchange packets with these flags set to determine who opens the connection and who terminates the connection.The hosts must acknowledge each flag so that each host knows that the connection process is complete. If acknowledgments were not required, it would be much easier for hackers to hijack a TCP connection that was still active, even though the original host already thought it terminated the connection.
There are three steps required to open a TCP connection.These steps are called the three-way handshake.This example will be the establishment of a TCP connection between a client and a server.
1.Client Sends a SYN flag and the server port number with which it wants to communicate (such as port 80 for a Web server). It also includes the client’s Initial Sequence Number (ISN).
www.syngress.com

266Chapter 5 • Troubleshooting the Network with Sniffers
2.Server Responds with its own SYN flag and ISN to the client’s TCP port. It also responds with an ACK flag to acknowledge the client’s SYN flag.
3.Client Responds with an ACK flag to acknowledge the server’s SYN flag.
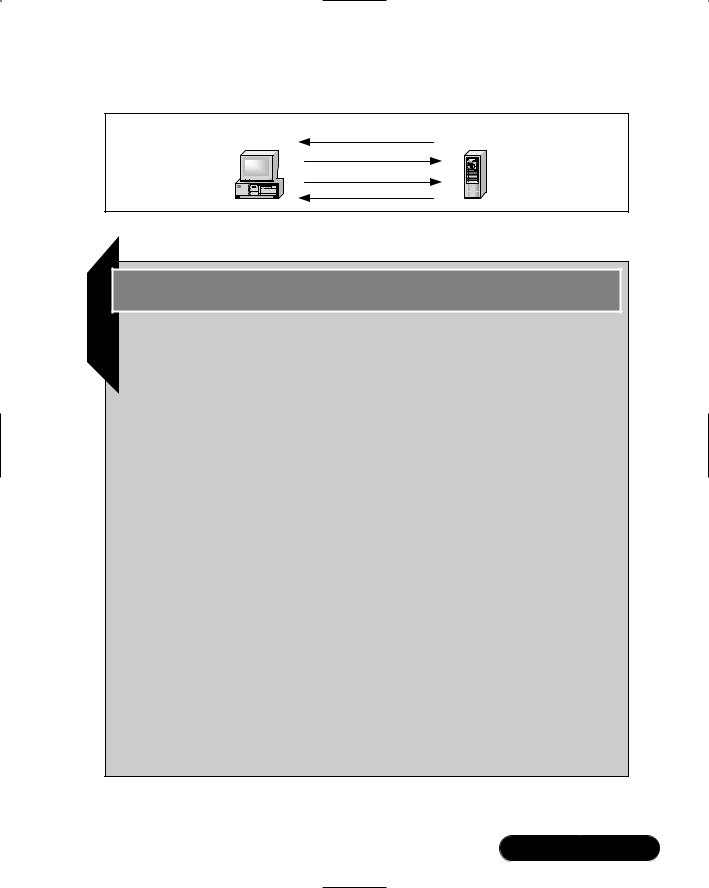
Once the three-way handshake is complete, a TCP connection is established. The Application layer protocols, such as Hypertext Transfer Protocol (HTTP), can now send data through this TCP connection.The three-way handshake is shown in Figure 5.4.
Figure 5.4 Three-Way Handshake
Client |
1. |
SYN |
Web Server |
|
|
2. SYN ACK
3. ACK
Terminating a TCP Connection
After the session is no longer required, or the data transfer between the hosts is complete, either host may terminate the TCP connection.There are four steps to terminate a TCP connection. Either host can terminate the connection (i.e., the client or the server). In this example, the server will terminate the connection.
1.Server Sends a FIN flag to the client.The FIN flag is usually sent in response to the client issuing a close command in an application on the server.This is often called an active close.
2.Client Responds with an ACK flag to acknowledge that the connection will be terminated.
3.Client Sends a FIN flag to the server.This is often called a passive close.
4.Server Responds with an ACK flag to acknowledge that the TCP connection is terminated.
Once both hosts acknowledge the FIN flag from the other host, the TCP connection is terminated. It is possible for data to be sent one way if only one direction has been terminated. However, most applications do not take advantage of this TCP possibility. The TCP termination process is shown in Figure 5.5.
www.syngress.com
Troubleshooting the Network with Sniffers • Chapter 5 |
267 |
Figure 5.5 Terminating a TCP Connection
Client |
1. |
FIN |
Web Server |
|
2. |
ACK |
|||
|
|
3. FIN
4. ACK
Tools & Traps…
The TCP Flaw
An inherent flaw in TCP was discovered in the mid-1980s that has recently received attention in the media and in security advisories. The problem centers on the Initial Sequence Numbers (ISNs), which are packet numbers used in TCP connections. These numbers are only known by the hosts that are making the connection. The sequence numbers are used to identify legitimate packets and determine which packets are part of a given transmission. The packets that follow contain a sequence number based on the INS. The sequence number changes each time by adding the number of bytes that are transmitted to the other host.
The problem is that if the ISNs of a TCP connection are not random, or if they are not random in subsequent TCP sessions, a hacker can guess the ISN. If he or she guesses correctly, the hacker will be able to hijack the session.
Hackers attempting to exploit this vulnerability will have an extremely difficult time. Not only will they need to guess the ISN, but they must identify the vulnerable systems. The actual attack is extremely difficult to implement. However, if a hacker develops tools for this hack and makes it available on the Internet, any person with a modem and not much experience will be able to implement it.
The TCP flaw is 20 years old and is still a concern. As recently as 1996, researchers at AT&T proposed a solution to the Internet Engineering Task Force (IETF). To date, only OpenBSD is considered to have consistently random ISNs. Linux and Solaris would be considered average at performing this task.
www.syngress.com

268 Chapter 5 • Troubleshooting the Network with Sniffers
Creating Filters Using Tcpdump
Tcpdump is a command-line network traffic-monitoring tool that can capture packets on a network interface and allows administrators to analyze the results. It is maintained by the TCPDUMP Group.
Because tcpdump is a command-line tool, analyzing the results can be difficult.Tcpdump allows you to capture all packets on a given interface, or all interfaces on a system, for analysis. If the interface is not specified, it searches for the lowest interface number, excluding the loopback, and prints the packets for that interface.To filter the packets that tcpdump captures, you can add filters by using options and expressions, which you will learn about in this section.
As stated earlier, tcpdump has been around for a long time, and most graphical sniffers use similar filter specifications.Tcpdump usually installs during standard Linux installations. The tcpdump public repository is located at www.tcpdump.org, and the Red Hat Linux tcpdump Red Hat Package Manager (RPM) can be downloaded at www.redhat.com/apps/download/ (keyword tcpdump). For Linux installation, the program must be installed as root, or setuid to root.
Any version of tcpdump will work for the following examples.Version 3.6 and later has additional support for IPv6 and support for Solaris 8. If you require either feature, download version 3.6 or later.
Tcpdump Options
Options are used in tcpdump to filter the amount of packets your system captures.Without them, administrators can be overwhelmed by the number of packets that tcpdump prints. Figure 5.6 displays the printout of 12 packets captured in just .3 milliseconds. All network packets were captured without any filters. Several Address Resolution Protocol (ARP) requests exist, and all packets were captured on the default eth0 interface, since no interface was specified.
Table 5.2 lists many of the tcpdump options that assist in filtering tcpdump captures. For a complete listing, please access the tcpdump man page.
www.syngress.com
Troubleshooting the Network with Sniffers • Chapter 5 |
269 |
Figure 5.6 Tcpdump Capture without Options or Expressions
Table 5.2 Tcpdump Options
|
Option |
Description |
|
|
|
|
-a |
Display data in ASCII. |
|
-b |
Capture packets using the Data Link layer specified. These |
|
|
include the following protocols (see RFC 1340 if you want to list |
|
|
these protocols as decimal values): |
|
|
ip |
|
|
ipv6 |
|
|
802.2 |
|
|
802.3 |
|
|
arp |
|
|
rarp |
|
|
dec |
|
|
lat |
|
|
atalk |
|
|
aarp |
|
|
x25 |
|
|
ipx |
|
-c |
Quit tcpdump after a specific number (count) of packets have |
|
|
been captured. |
|
-e |
List the link-level header for each packet that is captured. |
|
-F |
Instead of listing options and expressions, you can use a file as the |
|
|
input for your filter expression. If a file is used, any expressions |
|
|
you list on the command line will be ignored. |
|
|
|
|
|
Continued |
www.syngress.com
270 Chapter 5 • Troubleshooting the Network with Sniffers
Table 5.2 Continued
Option |
Description |
|
|
-i |
Specify the interface you want tcpdump to listen. If the interface |
|
is not specified, it searches for the lowest interface number, |
|
excluding the loopback, and prints the packets for that interface. |
-n |
Do not list host names, only list host addresses as numbers (such |
|
as IP addresses). This avoids Domain Name System (DNS) lookups. |
-nn |
Do not list port numbers as service names. The /etc/services file is |
|
used for the service names. |
-p |
Do not enable promiscuous mode for the interface. |
-q |
Quick output to reduce the amount of protocol information |
|
displayed by tcpdump on each line. |
-r |
Read packet data from a saved file instead of capturing data on |
|
an interface. |
-t |
Do not list the timestamp. |
-v |
Print out verbose output from the capture. Includes even more |
|
data, such as time-to-live (TTL) and type of service data. The –vv |
|
option will list additional data. |
-w |
Write the tcpdump packet capture to a file instead of displaying it. |
-x |
Display the packet information in hexadecimal format. |
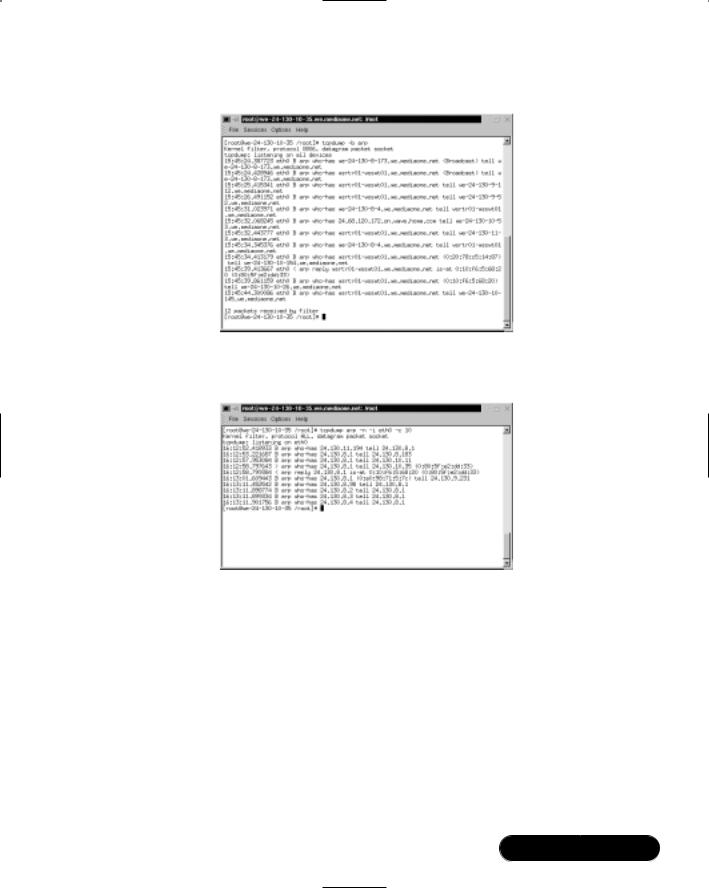
You can use options to filter out all traffic except for ARP requests and replies.To do this, enter the following:
tcpdump –b arp
In Figure 5.7, notice that only ARP requests and replies appear.The requests are arp who-has entries, and the reply is listed as an arp reply entry.There is only one reply (entry number 10) in this capture, but many ARP requests.
In the next example, you will use options to filter out host names, specify your interface, capture only 10 packets, and only capture ARP packets again.To do this, enter the following:
tcpdump arp –n –i eth0 –c 10
In Figure 5.8, notice that host names no longer appear, and IP addresses and hardware addresses are captured. Notice that most of the ARP requests are broadcasts. Line 4 is an ARP request for the hardware address of 24.130.8.1, which happens to be the default gateway of that system.The ARP reply follows in line 5, which lists the hardware address as 0:10:f6:5:68:20.
www.syngress.com
Troubleshooting the Network with Sniffers • Chapter 5 |
271 |
Figure 5.7 ARP Filter
Figure 5.8 ARP Filter with No Host Names, a Specified Interface, and a 10 Count
Tcpdump Expressions
The tcpdump options listed in Table 5.2 are important in determining how the data will be printed.Tcpdump expressions can determine which network hosts you will capture data from. If you do not specify an expression, all packets on the network between all hosts will be printed. An expression will ensure that only the data you require, such as the IP traffic between your interface and a specific host, will be printed.
Each expression is made up of at least one primitive. A primitive is an id followed by qualifiers. An id is a host name or number, and a qualifier can one of three types, as shown in Table 5.3.
www.syngress.com

272 |
Chapter 5 • Troubleshooting the Network with Sniffers |
||
|
|
Table 5.3 Three Types of Qualifiers in an Expression |
|
|
|
|
|
|
|
Qualifier |
Description |
|
|
|
|
|
|
type |
Specifies the id as a host, network, or port. The syntax is host, |
|
|
|
net, or port. For example, you can enter host 24.130.10.35, |
|
|
|
net 192.168.60, or port 80. |
|
|
dir |
Specifies the direction of traffic you want to capture. By |
|
|
|
default, traffic in both directions will be captured, which is src |
|
|
|
or dst. The directions you can specify are dst, src, src and dst, |
|
|
|
and src or dst. For Data Link layer protocols, such as Serial Line |
|
|
|
Internet Protocol (SLIP) or Point-to-Point (PPP), use the inbound |
|
|
|
and outbound qualifiers to define your direction. |
|
|
proto |
Specifies a protocol to capture. The protocols you can choose |
|
|
|
from are the following: |
|
|
|
ether |
|
|
|
fddi |
|
|
|
ip |
|
|
|
arp |
|
|
|
rarp |
|
|
|
decnet |
|
|
|
lat |
|
|
|
sca |
|
|
|
moprc |
|
|
|
mopddl |
|
|
|
tcp |
|
|
|
udp |
|
|
|
|
|
|
You can combine qualifiers to include several different filters. For example, |
|
|
|
you can enter the tcpdump command followed by ether dst 24.130.10.35 or |
|
|
|
tcp port 80. It all depends on how specific you want your search to be.The fol- |
|
|
|
lowing examples in Table 5.4 are allowable primitives that you can use. Notice |
|
|
|
the repetition between the host, ether, net and port primitives. For more examples, |
|
|
|
see the tcpdump man page. |
|
|
|
Table 5.4 Allowable Primitives |
|
|
|
|
|
|
|
Primitive |
Description |
|
|
|
|
|
|
dst host host |
Captures all packets with the destination IP |
|
|
|
address (or name) of the specified host. |
|
|
src host host |
Captures all packets with the source IP address |
|
|
|
(or name) of the specified host. |
Continued
www.syngress.com

|
Troubleshooting the Network with Sniffers • Chapter 5 |
273 |
Table 5.4 Continued |
|
|
|
|
|
Primitive |
Description |
|
|
|
|
host host |
Captures all packets with the source and destina- |
|
|
tion IP address (or name) of the specified host. |
|
ether dst ethernet_host |
Captures all packets with the destination Ethernet |
|
|
address (or name from /etc/ethers) of the specified |
|
|
Ethernet host. |
|
ether src ethernet_host |
Captures all packets with the source Ethernet |
|
|
address (or name from /etc/ethers) of the specified |
|
|
Ethernet host. |
|
ether host ethernet_host |
Captures all packets with the source and destina- |
|
|
tion Ethernet address (or name from /etc/ethers) |
|
|
of the specified Ethernet host. |
|
dst net network |
Captures all packets with the destination network |
|
|
address (or name from /etc/networks) of the speci- |
|
|
fied network. |
|
src net network |
Captures all packets with the source network |
|
|
address (or name from /etc/networks) of the |
|
|
specified network. |
|
net network |
Captures all packets with the source and destina- |
|
|
tion network address (or name from /etc/ |
|
|
networks) of the specified network. |
|
dst port port |
Captures all packets with the destination port |
|
|
number (or name from /etc/services) of the |
|
|
specified port. |
|
src port port |
Captures all packets with the source port number |
|
|
(or name from /etc/services) of the specified port. |
|
port port |
Captures all packets with the source and destina- |
|
|
tion port number (or name from /etc/services) of |
|
|
the specified port. |
|
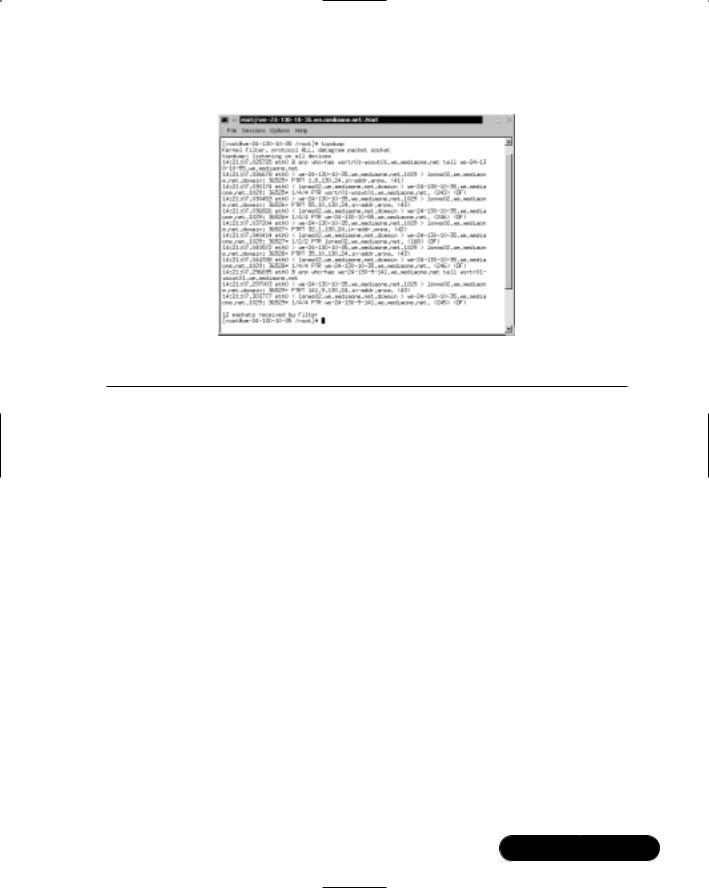
In the following example, the host we-24-130-10-192.we.mediaone.net will be monitored for all packets with its host name in the source or destination fields.You need to select a host name that you can monitor on your local network.This will not work outside of your network.
I used the hostname of a local workstation.To generate traffic, I pinged the host from my system. In Figure 5.10, you can see an ARP request and reply, the echo request and reply, and Windows Network Basic Input/Output System (NetBIOS) User Datagram Protocol (UDP) packets. As you can see, we are
www.syngress.com

274 Chapter 5 • Troubleshooting the Network with Sniffers
monitoring a Windows host from our Linux system. The tcpdump command entered on the Linux system is:
tcpdump host we-24-130-10-192.we.mediaone.net
The results are shown in Figure 5.9.
Figure 5.9 Monitoring a Host on a Local Network
The following primitives listed in Table 5.5 are extremely helpful for identifying specific protocols, broadcasts, and multicasts on a network.
Table 5.5 Additional Primitives
Primitive |
Description |
|
|
|
|
tcp |
Captures all packets that match the specified protocol. |
|
udp |
|
|
icmp |
|
|
ip |
|
|
arp |
|
|
rarp |
|
|
decnet |
|
|
ether broadcast |
Captures all Ethernet broadcast packets. |
|
ip broadcast |
Captures all IP broadcast packets. This includes all-one and |
|
|
|
all-zero broadcasts, as well as broadcasts based on the |
|
|
subnet-directed broadcasts. Helpful for determining |
|
|
|
|
|
Continued |
www.syngress.com

Troubleshooting the Network with Sniffers • Chapter 5 |
275 |
Table 5.5 Continued
Primitive |
Description |
|
|
|
problems with automatic IP address allocations, such as |
|
Bootstrap Protocol (BOOTP) and Dynamic Host |
|
Configuration Protocol (DHCP). |
ether multicast |
Captures all Ethernet multicast packets. |
ip multicast |
Captures all IP multicast packets. |
For example, if you believe your system is experiencing a denial-of-service (DoS) attack, you can filter out Internet Control Message Protocol (ICMP) packets to determine if that system is the victim of a ping flood.To filter out ICMP packets that are destined to your system, enter the following command:
tcpdump icmp –n –i eth0
The results are shown in Figure 5.10. As you can see, the host names are filtered out, as well as all protocols except for ICMP protocols.This can assist you in determining the source of the ping flood. In this case, the ICMP echo request packets are originating from a host at 24.130.10.192.
Figure 5.10 Determining the Source of a Ping Flood Using Primitives
Boolean Operators
You can also use Boolean operators to further specify a filter. Boolean operators are the AND, OR, and NOT operators. For example, you can specify that you want to capture packets between 192.168.60.10 and 192.168.60.11.You can also
www.syngress.com
276 Chapter 5 • Troubleshooting the Network with Sniffers
capture packets between bob or susan. Finally, you can capture packets between susan and all hosts except for bob by using the not operator.
In the next example, you will capture packets between a host and the Web server at www.tcpdump.org by using a Boolean operator.The command is as follows (substitute your host name or IP address):
tcpdump –i eth0 host we-24-130-10-35.we.mediaone.net and www.tcpdump.org
Only the packets sent between the mediaone.net host and the www.tcpdump
.org Web server appear, as shown in Figure 5.11.
Figure 5.11 Capturing Packets between Two Specific Hosts
NOTE
The first three packets in Figure 5.12 comprise the TCP three-way handshake that establishes the TCP session. After the handshake, the Web page data is downloaded to the client, such as the images and text files that make up the Web page.
To learn more about Boolean operators, please consult the tcpdump man page.You now have enough knowledge to create meaningful filters in tcpdump.
Installing and Using Tcpdump
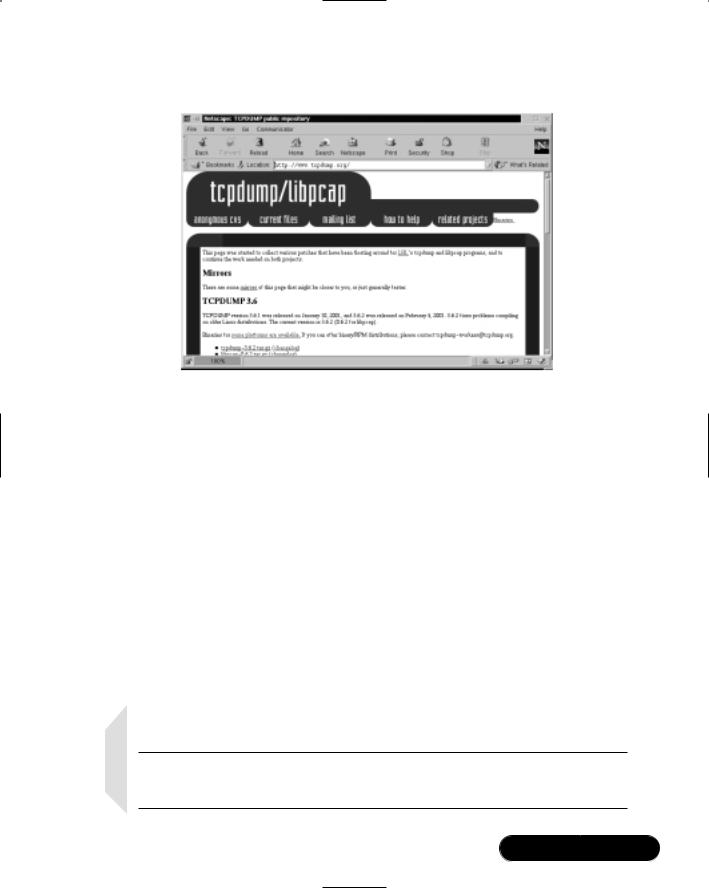
Your system should already have a version of tcpdump installed. If you require the latest version of tcpdump (for instance, you need bug-free IPv6 support), you should visit the tcpdump repository at www.tcpdump.org and download the latest version.The tcpdump repository is shown in Figure 5.12.
www.syngress.com
Troubleshooting the Network with Sniffers • Chapter 5 |
277 |
Figure 5.12 Tcpdump Repository
If you are using Red Hat Linux, you can download the latest RPM at www.redhat.com/apps/download and perform a search for keyword tcpdump. The latest RPM is usually several versions behind the latest tcpdump repository version. Follow these steps to install tcpdump:
1. Verify that the tcpdump RPM is installed on your system by entering:
rpm –qa | grep tcpdump
2.If you do not receive a reply, such as tcpdump-3.x-x, then you need to download and install tcpdump.
3.Once you have verified tcpdump is installed, you are ready to capture packets.
4.Capture all the packets on your network by entering:
tcpdump
5. Press CTRL+C and to stop the capture.
NOTE
If no packets appear after you stop the capture, you need to generate packets. For example, you can ping localhost or a server.
www.syngress.com

278 Chapter 5 • Troubleshooting the Network with Sniffers
6.View the captured packets. It may resemble the following packet, which will be used to describe some of the important features of the packet.
23:20:26.356520 eth0 > we-24-130-10-35.we.mediaone.net.1047 >
www.tcpdump.org.www: S 1722963211:1722963211(0)
The first section is the timestamp (23:20:26) followed by milliseconds (.356520).The interface used to capture the packets is eth0. Next, the source host is the we-24-130-10-35.we.mediaone.net. It is sending the packet using its TCP port 1047. It is sending this packet to the destination host www.tcpdump.org.The destination port is port 80, which is identified as www in the /etc/services file (the port number or port name can be used).The S is a synchronize flag used in a TCP handshake. In this case, it is the first SYN flag sent to the server.Therefore, the ISN for the TCP connection is 1722963211.All sequence numbers for this TCP connection will be based on this ISN. 1722963211:1722953211 is also the starting sequence number and the ending sequence number for this packet.The (0) indicates that no data (in bytes) is sent with this packet. If data had been sent with this packet, the ending sequence number would have increased by the number of bytes sent.
7.Can you find any TCP handshakes in your packet capture? Identify the basic elements of the packets you have captured using the previous step as an example.
8.Next, capture only ARP packets on your network by entering the following:
tcpdump –b arp
9.Capture ARP packets again, but specify the interface to use (eth0 is used as an example):
tcpdump –i eth0 –b arp
10.Capture IP packets this time. Print the results with number only (no DNS lookups required) and only capture 12 packets.To accomplish this task, enter:
tcpdump –n ip –c 12
Your screen may resemble Figure 5.13, depending on your network traffic.
www.syngress.com

Troubleshooting the Network with Sniffers • Chapter 5 |
279 |
Figure 5.13 Tcpdump Command Using Filters
11.Capture source and destination packets to another host on your network. For example, enter:
tcpdump host [hostname]
12. Capture a specific type of packet on your interface. For example, enter:
tcpdump icmp –i eth0
13.Finally, capture packets between your system and another system, such as a Web server. For example, enter:
tcpdump –i eth0 [your_hostname] and www.tcpdump.org
You have learned the basics of tcpdump.You can apply this knowledge to all sniffer programs because tcpdump is the basis for all sniffers. Because tcpdump is difficult to analyze, and because the file size is flat, many network administrators use graphical sniffers to determine network problems and to troubleshoot possible security threats.The remaining sniffers in this lesson are more user friendly than tcpdump and will simplify the packet analysis process.
Configuring Ethereal to
Capture Network Packets
Ethereal is a graphical user interface (GUI) packet sniffer that is much easier to use than tcpdump. It performs the same tasks as tcpdump, but in a user-friendly format. Because Ethereal uses many of the same filters as tcpdump, it is essential
www.syngress.com
280 Chapter 5 • Troubleshooting the Network with Sniffers
that you fully understand the tcpdump commands and filters, as they will be used in Ethereal throughout this chapter and in your daily administrative work.
Ethereal is very flexible because it allows you to read capture files from other programs, such as tcpdump, Network Associate Sniffer Basic and Sniffer Pro, NetXRay (now Sniffer Basic), snoop, atmsnoop, Microsoft Network Monitor, and Lucent/Ascend router debug output.When opening these files, Ethereal automatically determines the file type.
Both Ethereal and tcpdump capture packets using the pcap library (libpcap). Since they both use the pcap library syntax, they can share many of the same commands, such as filtering options and primitives.
Ethereal uses the same screen format as other packet sniffers—if you learn how to use Ethereal, you can apply your knowledge to any GUI sniffer. It divides the screen into three panes.The top pane is used for packet summary. It typically shows the summary of many different packets.The middle pane is a protocol tree, which displays the OSI/RM layers of the selected packet in the summary pane. The bottom pane is a hex dump.The hex dump displays the packet as it looks when traveling across the physical wire. Figure 5.14 displays a random packet capture of a network. Note that the pane sizes are adjustable.
Figure 5.14 Ethereal Panes
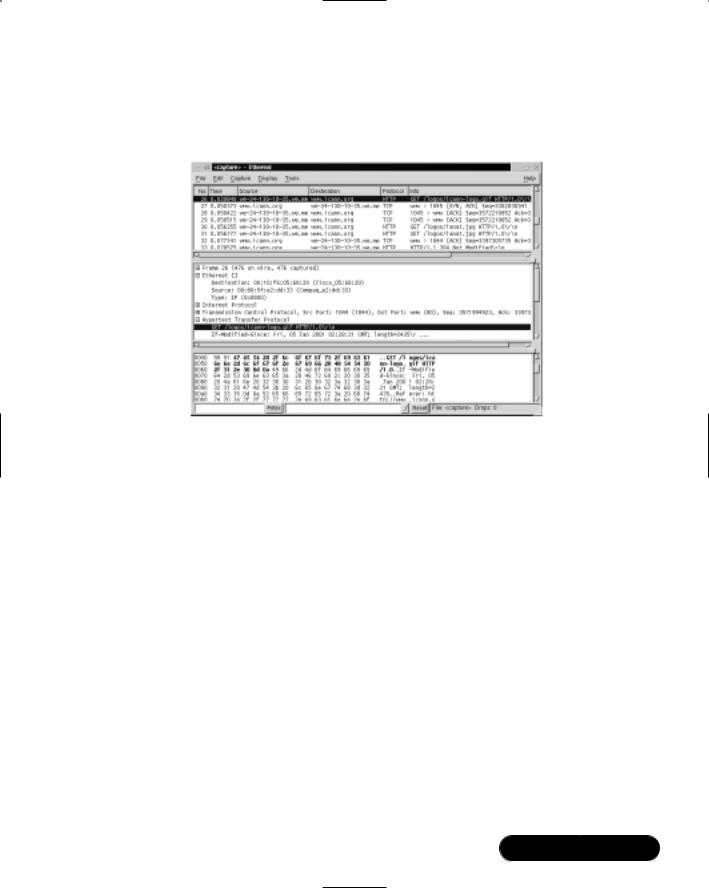
In Figure 5.15, an HTTP GET command is listed in the summary pane, which is the top pane. It displays the basic data regarding the packet. In this case,
www.syngress.com
Troubleshooting the Network with Sniffers • Chapter 5 |
281 |
it states that the HTTP GET command will download the icann-logo.gif image to the client’s Web browser.
Figure 5.15 Hex Code for an HTTP GET Command
The second pane displays the protocol tree for the packet. Each packet can be expanded by selecting the + sign.You can discover a great deal about each packet using the protocol tree, such as the hardware address of your host (Ethernet II Source field) and your default gateway (Ethernet II Destination field), the TCP port number and sequence numbers, and all Application layer activity. Expand each protocol to learn more about the packet.
The third pane displays the hexadecimal format of the packet, which is how it appears when traveling over the wire. If you highlight a line in the protocol tree, the corresponding hex code will appear in the hex pane, as shown in Figure 5.15.
Ethereal Options
Unlike tcpdump, Ethereal options are run before the packet capture occurs (in most cases).The options are run at the command line before the program runs. For example, at the command line you would enter:
ethereal [options]
The program will run using the options you specify. For example, if you wanted Ethereal to use numbers instead of host names to avoid DNS lookups,
www.syngress.com

282 Chapter 5 • Troubleshooting the Network with Sniffers
you would specify this as an option at the command line before the program runs. The Ethereal options are listed in Table 5.6.
Table 5.6 Ethereal Options
Option |
Description |
|
|
-c |
Defines the default number of packets to capture. |
-f |
Defines the filter expression to use for all captures. |
-h |
Displays the version number and available options. |
-i |
Defines the interface to use for all captures. |
-k |
Instructs Ethereal to start the packet capture immediately. If the |
|
interface is not defined, Ethereal (similar to tcpdump) uses the |
|
lowest number interface (excluding the loopback). |
-m |
Defines the font for Ethereal text. |
-n |
Disables names in Ethereal so only numbers will be used. This |
|
disables DNS lookups, as well as TCP and UDP port names. |
-r |
Instructs Ethereal to display a packet capture within a file. |
-R |
Allows you to apply a packet filter to a file. Any packet that does |
|
not apply to the filter is removed from the display. |
-s |
Defines the default length, in bytes, of each packet capture. |
-t |
Defines the timestamp format. There are three choices: |
|
Absolute ( a ) Actual time and date the packet is captured. |
|
Delta ( d ) The time since the last packet was captured. |
|
Relative ( r ) The time since the first packet was captured in the |
|
current packet capture. |
|
By default, the relative timestamp format is used. |
-w |
Defines the default packet capture filename. |
|
|
NOTE
When determining the timestamp format to use, consider the purpose of your packet capture. If you are determining the performance response time of a server, the delta timestamp is ideal because it will indicate how long it takes a server to respond to a client request. If you are determining a possible attack, you may want to use absolute timestamp to document the date and time an attack took place.
www.syngress.com
Troubleshooting the Network with Sniffers • Chapter 5 |
283 |
Ethereal Filters
Ethereal filters are similar to the filters in tcpdump.The easiest way to apply filters is to open the program using the ethereal command at the command line, and then using the GUI to navigate to the filter configuration screen.You can then use the same filters used in tcpdump.The only difference is that you will not enter tcpdump before the filter specifications.
Once benefit of Ethereal is that you can easily save your filters and access them as needed for each packet capture you make.You can have multiple filters from which to choose for different needs. For example, one filter might be used for capturing packets between two hosts, while another is used to capture ICMP packets on the network for troubleshooting purposes.
To learn more about filter syntax, please consult the Ethereal and/or tcpdump man page.
Configuring Ethereal and Capturing Packets
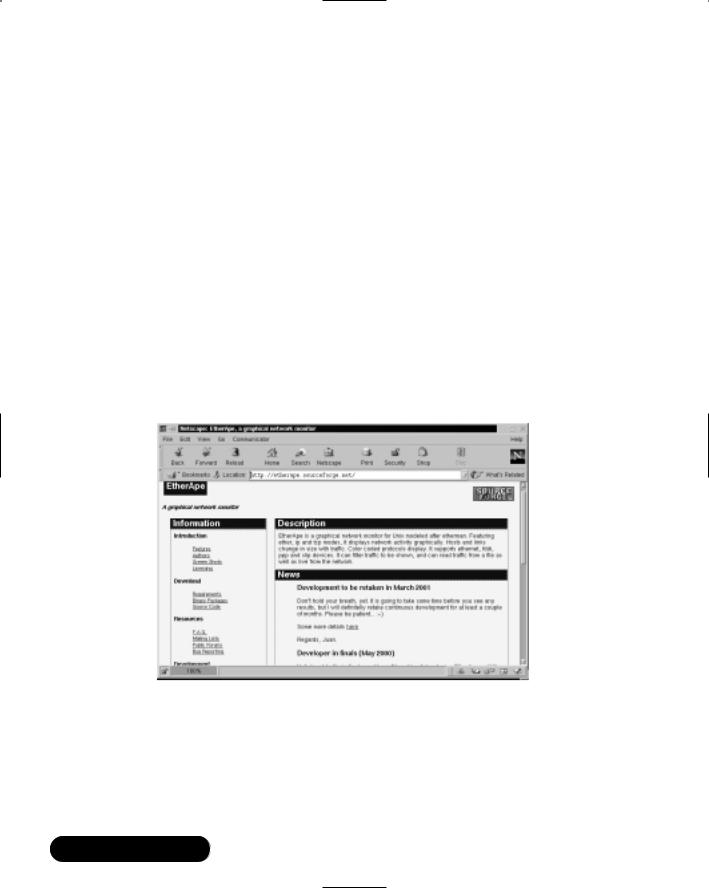
The following steps will teach you how to configure Ethereal and capture packets on your network.Your system may already have a version of Ethereal installed. If you require the latest version of Ethereal, you should visit the Ethereal Web site at www.ethereal.com and download the latest version. (This RPM is also available on the CD accompanying this book (ethereal-0.8.9-4.i386.rpm).The Ethereal Web site is shown in Figure 5.16.
Figure 5.16 The Ethereal Download Site
www.syngress.com

284 Chapter 5 • Troubleshooting the Network with Sniffers
If you are using Red Hat Linux, you can use the files on the CD or download the latest RPM at www.redhat.com/apps/download and perform a search for keyword ethereal. The latest RPM is usually several versions behind the latest Ethereal Web site version.To install Ethereal, complete the following steps:
1. Verify that the Ethereal RPM is installed on your system by entering:
rpm –qa | grep ethereal
2.If you do not receive a reply, such as ethereal-8.x-x, you need to download and install Ethereal.
3.Once you have verified that Ethereal is installed, you are ready to capture packets.
4.To add filters to Ethereal, open a command interface and enter:
ethereal
5.Select the Edit menu, and choose Filters.The Ethereal: Filters screen appears, as shown in Figure 5.17. Since no filters have been configured, the configuration screen is blank.
Figure 5.17 Ethereal Filter Configuration Screen
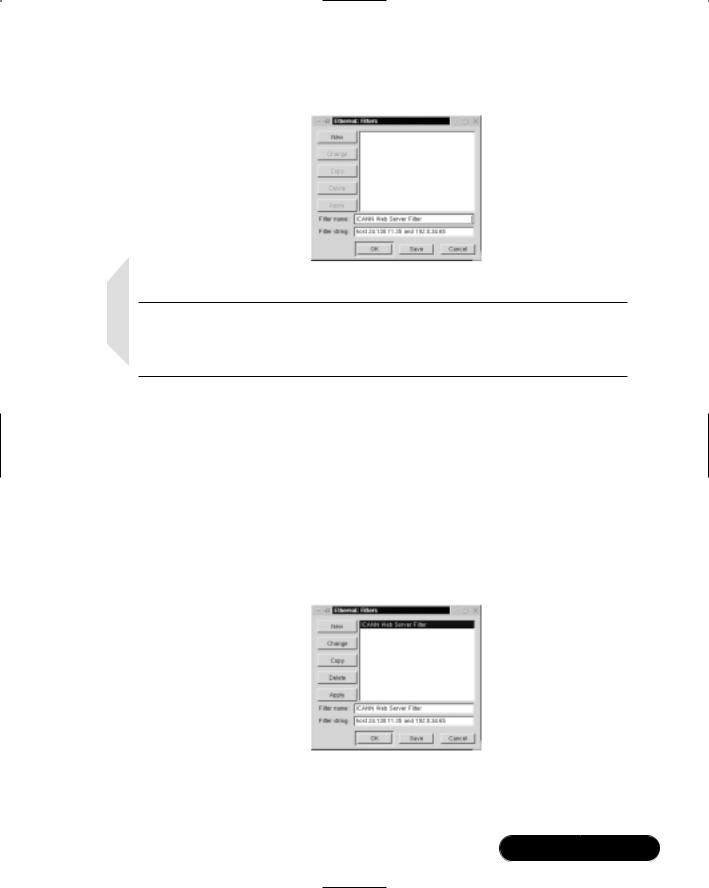
6. To create a filter that allows only traffic between your host and another host, you must add a filter name and a filter string. For example, to create a filter between your host and the Web server at the ICANN (192.0.34.65), enter the filter name and filter string shown in Figure 5.18. Enter your IP address, not the 24.130.11.35 address listed in Figure 5.18.
www.syngress.com
Troubleshooting the Network with Sniffers • Chapter 5 |
285 |
Figure 5.18 Creating a Filter between Two Hosts
NOTE
The filter string in Ethereal is the same primitive used in tcpdump. Both Ethereal and tcpdump use libpcap, which allows them to share many of the same filter configurations.
7.This filter will only capture packets with a source or destination address that matches 24.130.11.35 (the IP address of my system) and 192.0.34.65 (the IP address of the ICANN Web server). Please note that we could have also listed the host names (we-24-130-11-35.we.mediaone.net and www.icann.org).
8.After the two fields are complete, click Save, and then click New.Your filter will appear in the filter field, as shown in Figure 5.19.
Figure 5.19 Completing the Filter Creation Process
9.Click OK to return to Ethereal.You can add additional filters, such as an ICMP filter, by repeating the process.Your new filter will appear in the
www.syngress.com

286 Chapter 5 • Troubleshooting the Network with Sniffers
Ethereal: Filter screen directly beneath the ICANN Web Server Filter. Each new filter will simply be added to the list, as shown in Figure 5.20.
Figure 5.20 Adding Multiple Filters
10.To add the filter to a packet capture, you need to specify the filter.You can do this before or after the packet capture occurs. For example, to apply the filter before the capture, simply select the Capture menu and choose Start.The Capture Preference screen appears, as shown in Figure 5.21. Click Filter and choose the filter that you want to apply. In Figure 5.21, the ICMP filter was chosen.
Figure 5.21 Ethereal Capture Preferences
Notice that the Update list of packets in real time and Enable name resolution check boxes are selected.This ensures that packets are displayed as they are captured (i.e.,“live”), instead of displaying them only when the capture is complete.The Enable name resolution check box will display host names, as well as protocol names.You can also disable name resolution at the command line by entering ethereal –n when you run Ethereal, or by deselecting the Enable name resolution check box in the Capture Preferences screen.
www.syngress.com
Troubleshooting the Network with Sniffers • Chapter 5 |
287 |
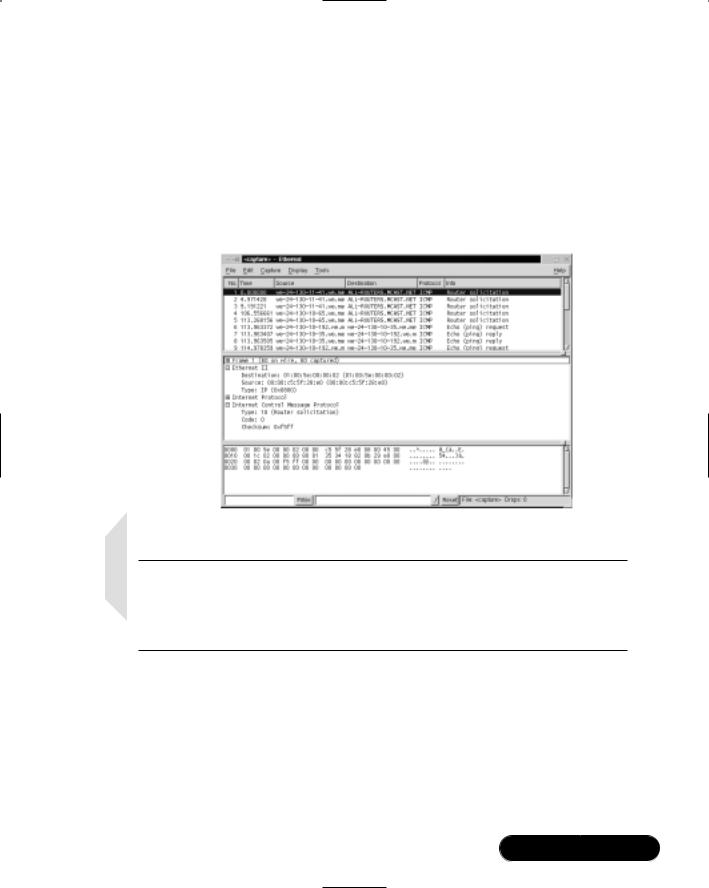
11.After you select the desired filter, click OK and the capture starts. Packets appear as they are captured so you can analyze the traffic on your network in real time.When you capture several packets, click Stop.
12.The packet capture appears in Ethereal.Your screen may resemble Figure 5.22, which shows Router solicitation packets and echo request and replies on the network.
Figure 5.22 Ethereal Packet Capture with Filter Applied
NOTE
Ethereal can take a long time to process packets after you stop the capture. Be patient. You may have to wait up to a minute for the captured packets to display properly. You may lose your capture if you interrupt Ethereal before it displays the packets.
13.Apply the host filter you created in Step 6 to filter only traffic between your host and another host (i.e., a server).
14.Create your own filters and apply them to a packet capture. Use the filter techniques you learned in the tcpdump section, especially the primitives in Tables 5.4 and 5.5.
www.syngress.com
288 Chapter 5 • Troubleshooting the Network with Sniffers
As you can see, the GUI provided by Ethereal allows administrators to view detailed information about each packet.The protocol tree is especially helpful in determining the purpose of each protocol within the packet.The combination of Ethereal and tcpdump provides administrators with almost all of their sniffer needs on Linux systems.
Viewing Network Traffic between Hosts Using EtherApe
EtherApe is a graphical network traffic-monitoring tool. Unlike Ethereal, EtherApe displays networking activity graphically by identifying hosts and the links that exist between the hosts.The links are color coded and change constantly as the host connections change. It displays real -time traffic, as well as traffic saved to a file.Visit the EtherApe home page at http://etherape.sourceforge.net, shown in Figure 5.23.
Figure 5.23 EtherApe Home Page
As you can see, EtherApe supports Ethernet, Fiber Distributed Data Interface (FDDI), PPP, and SLIP devices, and is capable of reading network traffic live and from a file. It can also save network traffic and display it later.The program uses GNU Network Object Model Environment (GNOME) libraries for the interface. Similar to tcpdump and Ethereal, EtherApe uses libpcap, the library for packet capturing and filtering.
www.syngress.com

Troubleshooting the Network with Sniffers • Chapter 5 |
289 |
EtherApe uses the command-line options listed in Table 5.7. Enter these options as needed when you run the program. Use the format:
etherape [options]
Table 5.7 EtherApe Options
Option |
Name |
Description |
|
|
|
-d |
Diagram only |
Do not display diagram text. |
-f |
Filter |
Define a specific capture filter. |
-F |
No fade |
Do not allow old links to fade in diagram. |
-i |
Interface |
Define the interface for EtherApe to listen for |
|
|
network traffic. |
-L |
Link color |
Define the color of the diagram links. |
-m |
Mode |
Define the operation mode. You can choose |
|
|
from the following: |
|
|
ethernet |
|
|
fddi |
|
|
ip |
|
|
tcp |
|
|
By default, the lowest level is used for the |
|
|
device. |
-n |
Numeric |
Disables names so that only numbers will be |
|
|
used. This disables DNS lookups, as well as TCP |
|
|
and UDP port names. |
-n |
Text color |
Define the color of the diagram nodes. |
-r |
Infile |
Defines the input file. |
-T |
Text color |
Define the color of the diagram text. |
-? |
Help |
Display help message. |
|
|
|
Configuring EtherApe and
Viewing Network Traffic
The following steps will teach you how to configure EtherApe and view traffic on your network.Your system may already have a version of EtherApe installed. If you require the latest version of EtherApe, you should visit the EtherApe Web site at http://etherape.source-forge.net and download the latest version.
www.syngress.com
290 Chapter 5 • Troubleshooting the Network with Sniffers
If you are using Red Hat Linux, you can download the latest RPM at www.redhat.com/apps/download and perform a search for keyword EtherApe. (This RPM is also available on the CD accompanying this book: etherape-0.5.6- 4.i386.rpm.) To install EtherApe, complete the following steps:
1. Verify that the EtherApe RPM is installed on your system by entering:
rpm –qa | grep etherape
2.If you do not receive a reply, such as etherape-0.5.x-x, you need to download and install EtherApe.
3.Once you have verified EtherApe is installed, you are ready to capture packets.
4.To open EtherApe, open a command interface and enter:
etherape
5.EtherApe opens and displays the network traffic diagram by default. If you are running Red Hat Linux 7, the diagram text is unreadable.You must select a font in order to read the text.To select a font, click Preferences on the EtherApe toolbar.The EtherApe Preference screen appears, as shown in Figure 5.24.
Figure 5.24 EtherApe Preferences: Choosing a Readable Font (If Necessary)
6.Click Font and choose a font; for example, Helvetica or Times New Roman. Click Save so you will not have to do this again, and then click OK.
www.syngress.com

Troubleshooting the Network with Sniffers • Chapter 5 |
291 |
7.The network traffic diagram now appears with readable network addresses, as shown in Figure 5.25.
Figure 5.25 Ethernet Traffic on EtherApe
8.By default, EtherApe diagrams the lowest-layer protocols, which are Ethernet protocols. If you are diagramming a busy network, ARP packets may quickly overrun your diagram.To diagram IP traffic instead, exit EtherApe. At the command line, enter:
etherape –m ip
This command opens EtherApe in IP mode, which will display the IP addresses and host names on your network, as shown in Figure 5.26.
Figure 5.26 EtherApe in IP Mode
www.syngress.com

292 Chapter 5 • Troubleshooting the Network with Sniffers
9. Experiment with the filter field by clicking Preferences and selecting the Capture tab. Using the Capture filter field, create an end-to-end IP filter or a port-to-port TCP filter.
As you can see, EtherApe offers a graphical representation of your network traffic. Instead of displaying individual packets, it creates a diagram of network traffic links between hosts. EtherApe used in conjunction with tcpdump, and Ethereal provides a complete toolkit for a network administrator.
www.syngress.com
Troubleshooting the Network with Sniffers • Chapter 5 |
293 |
Summary
In this chapter, you learned that a sniffer, or packet sniffer, is software or hardware that captures network traffic.This traffic can be analyzed to determine problems in a network, such as bottlenecks or performance degradation. It can also confirm hacker attacks against your network systems. If you suspect a system is under attack, you can capture the packets on its interface to identify what types of packets are hitting the system, as well as where the packets originated. Once a problem is determined, an administrator can make network changes to ensure that the network operates efficiently and securely.
You learned about three different programs that capture packets using the pcap library (libpcap), as well as the importance of identifying packet functions. For example, you learned about the function of a TCP handshake, how to identify one, and its importance on TCP/IP networks.
Tcpdump is a command-line network traffic-monitoring tool that prints out packet headers on a network interface and allows administrators to analyze the results. Because tcpdump is a command-line tool, analyzing the results can be difficult. Options are used in tcpdump to filter the amount of packets your system captures.Without them, administrators can be overwhelmed by the number of packets that tcpdump prints. An expression determines from which network hosts you will capture data. If you do not specify an expression, all packets on the network between all hosts will be printed. An expression will ensure that only the data you require, such as the IP traffic between your interface and a specific host, will be printed.
Ethereal is a graphical user interface (GUI) packet sniffer that is much easier to use than tcpdump. It performs the same tasks as tcpdump, but in a userfriendly format. Ethereal uses the same screen format as other packet sniffers. If you learn how to use Ethereal, you can apply your knowledge to any GUI sniffer. It divides the screen into three panes.The top pane is used for packet summary, and typically shows the summary of many different packets.The middle pane is a protocol tree, which displays the OSI/RM layers of the selected packet in the summary pane.The bottom pane is a hex dump.The hex dump displays the packet as it looks when traveling across the physical wire.
EtherApe is a graphical network traffic-monitoring tool. Unlike Ethereal, EtherApe displays networking activity graphically by identifying hosts and the links that exist between the hosts.The links are color coded and change constantly as the host connections change.
www.syngress.com

294 Chapter 5 • Troubleshooting the Network with Sniffers
EtherApe used in conjunction with tcpdump and Ethereal provides a complete toolkit for a network administrator. All three packet-capturing tools provide troubleshooting assistance for network problems, and can be used to identify potential security problems on your network.You will use these tools throughout this book, so it is important that you have an understanding of their functionality.
Solutions Fast Track
Understanding Packet Analysis and TCP Handshakes
;Analyzing TCP traffic is one of the most important tasks for a security administrator. It can tell you a great deal about your network connections, as well as identify many denial-of-service (DoS) attacks and man- in-the-middle, or hijacking, attacks.
;A TCP handshake must occur whenever two hosts establish a connection on a TCP/IP network.This handshake consists of rules that the two hosts must follow.
;Special mechanisms, called flags, are used to establish and terminate a TCP connection. Flags are included in the TCP header, and each flag completes a different function in the TCP handshake.The flags used are SYN, FIN, RST, PSH, ACK, and URG.
Creating Filters Using Tcpdump
;Tcpdump captures packets on a given interface, or on all interfaces on a system, for analysis. It is a command-line tool, which can make it difficult to read.
;Tcpdump options allow you to filter the packets that are captured. For example, you can limit the capture to ARP packets or display only IP addresses (not host names).
;Tcpdump expressions allow you to specify the hosts from which you will capture packets. For example, an expression will ensure that only the data you require, such as the traffic between your interface and a specific host, will be printed.
www.syngress.com

Troubleshooting the Network with Sniffers • Chapter 5 |
295 |
Configuring Ethereal to Capture Network Packets
;Ethereal provides a GUI environment for capturing network packets, which makes it easier for many administrators to use.
;Ethereal and tcpdump capture packets using the pcap library (libpcap). Since they both use the pcap library (libpcap) syntax, they can share many of the same commands, such as filtering options and primitives.
;You can easily save Ethereal filters and access them as needed for each packet capture you make.You can have multiple filters from which to choose for different needs.
Viewing Network Traffic between Hosts Using EtherApe
;EtherApe is a GUI that displays networking activity graphically by identifying hosts and the links that exist between the hosts. It displays realtime traffic, as well as traffic saved to a file.
;EtherApe also uses the pcap library (libpcap), the library for packet capturing and filtering, which is similar to tcpdump and Ethereal.
;EtherApe uses options to specify the capture information, such as the interface, link colors, or whether names or numbers will be used.
www.syngress.com

296 Chapter 5 • Troubleshooting the Network with Sniffers
Frequently Asked Questions
The following Frequently Asked Questions, answered by the authors of this book, are designed to both measure your understanding of the concepts presented in this chapter and to assist you with real-life implementation of these concepts. To have your questions about this chapter answered by the author, browse to www.syngress.com/solutions and click on the “Ask the Author” form.
Q: How does a sniffer eavesdrop the traffic on a network?
A:Ethernet was designed as a shared network since all systems share the same physical wire. It was designed so that systems would ignore all traffic that was not addressed to a particular system’s hardware address. Sniffer, or wiretap, programs turn off this filter, and switch a system’s interface into promiscuous mode, which then views all packets on the same physical wire.
Q:Now that I can sniff network traffic, how can I stop people from sniffing my data?
A:As you have learned, packet sniffing is a powerful tool. It allows malicious hackers to capture packets that contain passwords and usernames.The only way to protect yourself against hackers with packet sniffers is to encrypt your data. Even if hackers capture your encrypted data, they will be unable to decrypt it (unless they are extremely determined).
Q:When I use Ethereal, the only TCP packets I can capture are those to and from my interface.Why?
A:Your network interface card (NIC) probably has not switched to promiscuous mode for the packet capture. Promiscuous mode forces an interface to supply all network packets it sees to a host.Your operating system may be unable to switch your interface to promiscuous mode, or your interface may not support promiscuous mode. If your interface cannot be put into promiscuous mode, you will only see TCP traffic addressed to your interface, link-layer addresses, broadcast and multicast packets.Try another interface for your packet captures.
Q: When I perform a live capture in Linux, Ethereal freezes.Why?
www.syngress.com
Troubleshooting the Network with Sniffers • Chapter 5 |
297 |
A:This problem was fixed in Ethereal 0.8.2 and later. Ethereal would freeze during a live capture because of the libpcap library. If the network was idle, libpcap was unable to return control to Ethereal, and Ethereal would freeze. Code was added to Ethereal to fix this issue.
Q:When I use EtherApe, the hosts move before I can identify them. How can I keep them on my screen for analysis?
A:You must set the node timeout to zero (0), or else the hosts will disappear after they are finished transmitting their data.
Q:I installed EtherApe, but the diagram host names and addresses are a garbled mess. I can’t read anything.
A:You must configure the font.When EtherApe is running, click Preferences. In the Diagram tab, click Font, and choose a font such as Helvetica or Times New Roman. Make sure you click Save so you avoid this problem in the future.
www.syngress.com