

Waste sources and classification |
11 |
materials such as equipment, tools, pipes, sludge, resins from water purification, protective clothing, etc. The only difference is that these materials contain radioactivity in one form or another.
However, the production of radioactive wastes is not limited to nuclear power generation, but also occurs in all areas that utilise radioisotopes (e.g., hospitals) or handle or produce NORM. Further, an area that is often not mentioned, due to political sensitivity, is waste arising from military applications. While the spectrum of radionuclides in military wastes may be different, the materials are generally no different to those seen in civilian and non-nuclear industries that use similar processes (e.g., even depleted uranium (DU), used in anti-tank shells among other munitions, is also used industrially).
Therefore, military applications, the nuclear industry, medicine and a range of other industries, as well as various research activities, all generate radioactive waste as a result of their operations.
2.4.1. Nuclear fuel cycle
Commercially, electricity has been generated by the nuclear industry for nearly 50 years, since the first Magnox reactor came on-line in the UK. Currently, around 20 per cent of the world’s electricity requirement in 31 countries is met by nuclear power (440 reactors, 366 GW(e) at the end of 2004; IAEA, 2005).
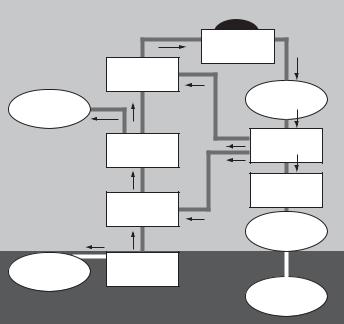
The civilian nuclear industry produces radioactive wastes from many sources and these can best be described by examining the nuclear fuel cycle (Fig. 2.1). This cycle
|
Fuel rods |
|
|
|
|
|
|
Reactor |
Spent fuel |
|
|
|
|
|
|
Fuel |
|
|
|
|
fabrication |
|
|
|
Depleted |
|
Pu |
|
Storage |
396 U-235 |
|
|
||
uranium |
|
|
|
|
|
|
|
|
|
|
Enrichment |
|
|
Reprocessing |
|
|
|
|
|
|
|
|
|
Wastes |
|
0.796 U-235 |
|
U |
|
|
|
|
|
Vitrification |
|
Conversion |
|
|
|
|
to UF6 |
|
|
|
|
U3O8 |
|
|
Storage |
|
|
|
|
Tailings |
Mining |
Disposal
Fig. 2.1. The nuclear fuel cycle showing all the processes from mining uranium ore to final disposal of radioactive waste (Uranium Information Centre, 2006).
12 |
D.F. McGinnes |
describes each step from the mining of uranium through reactor operation and then either to recycling (in nuclear industry jargon, the ‘‘closed cycle’’) or direct disposal of spent fuel (once-through cycle) The waste produced (‘‘arising’’ in the industry jargon) from the commercial processes applied in each part of this cycle are discussed below:
2.4.1.1. Mining
The majority of mining waste arises as ‘‘tailings’’ or, in other words, the leftovers from the mining and extraction process consisting of the residues remaining after the uranium ore has been processed by milling and acid leaching to produce ‘‘yellow cake’’ uranium oxide, U3O8.
To put this in perspective, to provide fuel for 1 year’s operation of a typical large light water reactor (with an electricity output of 1 GW(e)), between 45,000 to 50,000 tonnes (100 per cent) of uranium ore are required to produce 200 tonnes (0.4 per cent) of yellow cake. This then leaves between 43,000 and 48,000 tonnes (99.6 per cent) of tailings requiring further management.
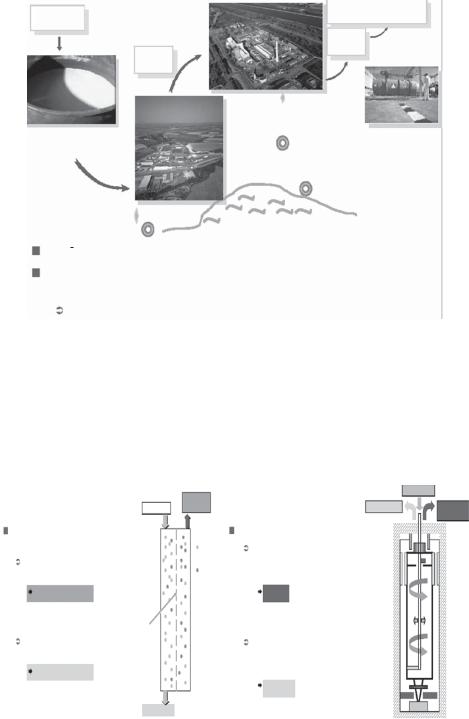
On completion of open-cast mining activities, the tailings are generally returned to the pit from where the uranium ore was originally extracted and the site rehabilitated for further use (see Fig. 2.2). For mines where the replacement of the tailings is not generally economically feasible, the storage facilities used to manage the tailings during mining operations are, generally, transformed into a long-term stable structure and the site rehabilitated for further use.
2.4.1.2. Fuel production
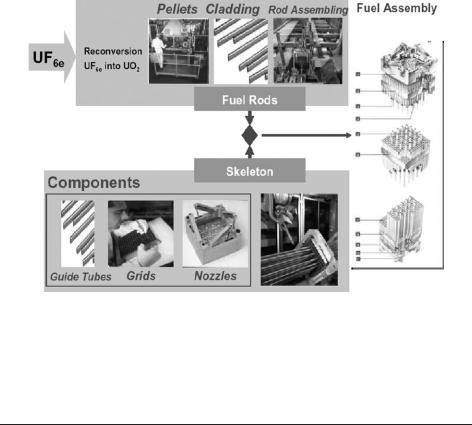
The production of fuel from yellow cake involves three activities: conversion, enrichment and fuel fabrication (Fig. 2.3).
The first stage of this process (Fig. 2.4) is the conversion of U3O8 powder (200 t) to UF6 (32 t), which is a gas at temperatures above 56LC; this is required for the enrichment process (centrifugation or diffusion) where the U-235 content of the gaseous UF6 is enriched from natural levels of 0.7 wt% to levels of between 2 and 4.95 wt%. In terms of the 1 GW(e) reactor mentioned above, this means that the 200 tonnes of concentrate produce 25 tonnes of enriched uranium containing 3–4 wt% U-235 and leaves 175 tonnes of depleted uranium containing 0.3 wt% U-235. Finally, the enriched UF6 (32 t) is converted to a UO2 powder (25 t) for compressing and sintering into fuel pellets, which are then fabricated into fuel assemblies (Fig. 2.5).
These activities produce small amounts of uranium-containing liquid and solid wastes that are packaged for storage and disposal. These are generally classified as L/ILW-LL.
The depleted uranium that results from enrichment operations is mostly recovered. A proportion can subsequently be reused, within the nuclear fuel cycle, by combining it either with recycled plutonium or using it to dilute highly enriched uranium from dismantled nuclear weapons to make fuel for nuclear reactors. In addition to the nuclear fuel cycle, due to its high density depleted uranium in its metallic form is also, as was noted above, used by the military sector as armour or casings for munitions.
2.4.1.3. Reactor operation
Assuming, once again, a typical large light water reactor of 1 GW(e) capacity, 200–350 m3 of L/ILW and 25 tonnes of SF will be generated per year.
Waste sources and classification |
13 |
Fig. 2.2. (a) Open-cast uranium mine – before remediation (image courtesy of AREVA-NC). (b) Open-cast uranium mine – after remediation (image courtesy of AREVA-NC).
If the spent fuel is directly disposed of, this corresponds to a disposal volume of around 75 m3, following encapsulation. If the spent fuel is reprocessed, this produces around 3 m3 of vitrified waste (HLW), which is equivalent to a disposal volume of around 30 m3, following placement in a disposal canister (see, e.g., Johnson and King, 2003).
In terms of activity, 99 per cent of the total is contained in the spent fuel, consisting of activation and fission products and actinides (Table 2.3), and is either contained within the spent fuel matrix (vast majority) or in the fuel assembly structural materials (activation).
14 |
D.F. McGinnes |
MINES |
ENRICHERS |
|
|
|
UF6 |
|
UF4 |
|
Pierrelatte (Drôme) |
Mining |
Cylinder 48Y |
Concentrates |
Avignon |
|
|
|
Marseille |
Malvési (Aude) |
Narbonne |
|
Malvesi and Pierrelatte conversion plants: certified ISO 9002 and ISO 14001
Pierrelatte plant (Comurhex company): the largest european fluorine producer, and the second biggest worldwide
Examples: WF6 used in electronics industry, F2N2 used to leak proof fuel tanks
Fig. 2.3. Example of the stages of fuel production (image courtesy of AREVA-NC).
Lowand intermediate-level waste is generally produced as a result of normal reactor operations, such as the cleaning of the reactor coolant systems and fuel storage ponds or the decontamination of equipment. Other wastes consist of various types of filters or metal components that have become radioactive as a result of their use in, or near, the reactor (Fig 2.6).
Feed
The UF6 gas partly crosses a membrane (filter)
U235F6 molecules are smaller, faster: they
cross the membrane more often, statistically
The gas is depleted in U235
Membrane
U238F6 molecules are bigger, slower: they cross the membrane less often, statistically
The gas is depleted in U235
Enriched
Exit
U238F6
U235F6
|
Feed |
Depleted Exit |
Enriched |
|
Exit |
The UF6 gas is centrifugated
U235F6 molecules are lighter and preferably move to the center of the rotor
Red bale / Gas enriched in U235
U238F6 molecules are heavier and preferably move to the periphery of the rotor
Yellow bale / Gas depleted inU235
Depleted Exit
Fig. 2.4. The fuel enrichment processes – diffusion and centrifugation (image courtesy of AREVA-NC).
Waste sources and classification |
15 |
Fig. 2.5. Fuel assembly manufacturing – main steps (image courtesy of AREVA-NC).
Table 2.3
Sources of radionuclides within waste – an example from light water reactor spent fuel. Note that actinide decay chain daughter nuclides are not specifically listed as, over the time frames where they are important for a repository, their ingrowth via decay dominates.
Nuclide |
Half-life (y) |
Dec. |
Nuclide type |
Produced |
Percentage |
Relevance |
|
|
|
|
from |
of total |
|
|
|
|
|
|
or activity |
|
|
|
|
|
|
in spent |
|
|
|
|
|
|
fuel (40y) |
|
|
|
|
|
|
|
|
H-3 |
12.3 |
|
AP |
Li (n, ) |
|
|
C-14 |
5730 |
|
AP |
N (n,p) |
|
|
Cl-36 |
3.0Eþ05 |
, þ |
AP |
Cl (n, ) |
|
|
Ar-39 |
269 |
|
AP |
K (n,p) |
|
|
Ca-41 |
1.0Eþ05 |
þ |
AP |
Ca (n, ) |
|
|
Mn-54 |
0.85 |
þ ( ) |
AP |
Fe (n,d), |
|
-dose rate |
|
|
|
|
(d, ) |
|
|
Fe-55 |
2.7 |
þ |
AP |
Fe (n, ) |
|
|
Co-60 |
5.3 |
( ) |
AP |
Co (n, ) |
|
-dose rate |
Ni-59 |
7.5Eþ04 |
þ |
AP |
Ni (n, ) |
|
|
Ni-63 |
101 |
|
AP |
Ni (n, ) |
|
|
Se-79 |
1.1Eþ06 |
|
FP |
|
|
|
Kr-85 |
10.8 |
( ) |
FP |
|
2.0 ( ) |
-dose rate |
Sr-90 |
28.6 |
|
FP |
|
16.7 ( ) |
|
Y-90 |
secs |
|
Sr-90 |
|
16.7( ) |
heat |
|
|
|
|
|
|
output, |
|
|
|
|
|
|
-dose rate |
|
|
|
|
|
|
|
(Continued)
16 |
|
|
D.F. McGinnes |
|
|
|
Table 2.3 |
|
|
|
|
|
|
(Continued ) |
|
|
|
|
|
|
|
|
|
|
|
|
|
Nuclide |
Half-life (y) |
Dec. |
Nuclide type |
Produced |
Percentage |
Relevance |
|
|
|
|
from |
of total |
|
|
|
|
|
|
or activity |
|
|
|
|
|
|
in spent |
|
|
|
|
|
|
fuel (40y) |
|
|
|
|
|
|
|
|
Mo-93 |
4000 |
þ |
AP |
Mo (n, ) |
|
|
Zr-93 |
1.5Eþ06 |
|
FP |
|
|
|
Nb-93m |
16.1 |
|
FP |
|
|
-dose rate |
Nb-94 |
2.0Eþ04 |
( ) |
AP |
Nb (n, ) |
|
-dose rate |
Tc-99 |
2.1Eþ05 |
|
FP |
|
|
|
Ru-106 |
1.02 |
|
FP |
|
|
|
Rh-106 |
secs |
( ) |
Ru-106 |
|
|
-dose |
|
|
|
|
|
|
rate, heat |
|
6.5Eþ06 |
|
|
|
|
output |
Pd-107 |
|
FP |
|
|
|
|
Ag-108m |
418 |
þ ( ) |
AP |
Ag (n, ) |
|
-Dose |
|
|
|
|
|
|
rate |
Sn-121m |
55.0 |
|
FP |
|
|
|
Cd-113m |
14.6 |
|
FP |
|
|
|
Sn-126 |
2.3Eþ05 |
|
FP |
|
|
|
Sb-125 |
2.8 |
( ) |
FP |
|
|
-dose rate |
Te-125m |
0.16 |
|
Sb-125 |
|
|
-dose rate |
I-129 |
1.6Eþ07 |
|
FP |
|
|
|
Cs-134 |
2.1 |
, þ ( ) |
FP |
|
|
-dose |
|
|
|
|
|
|
rate, heat |
|
2.3Eþ06 |
|
|
|
|
output |
Cs-135 |
|
FP |
|
|
|
|
Cs-137 |
30.2 |
|
FP |
|
26.2 ( ) |
heat output |
Ba-137m |
secs |
|
Cs-137 |
|
25.0 ( ) |
-dose |
|
|
|
|
|
|
rate, heat |
|
|
|
|
|
|
output |
Ce-144 |
0.78 |
( ) |
FP |
|
|
-dose rate |
Pr-144 |
secs |
( ) |
Ce-144 |
|
|
-dose |
|
|
|
|
|
|
rate, heat |
|
|
|
|
|
|
output |
Sm-151 |
93.0 |
|
FP |
|
|
|
Eu-152 |
13.3 |
, þ ( ) |
FP |
|
|
-dose rate |
Eu-154 |
8.8 |
, þ ( ) |
FP |
|
|
-dose |
|
|
|
|
|
|
rate, heat |
|
|
|
|
|
|
output |
Eu-155 |
4.8 |
|
FP |
|
|
|
Ho-166m |
1200 |
|
FP |
|
|
|
U-234 |
2.5Eþ05 |
|
AC |
|
|
|
U-235 |
7.0Eþ08 |
|
AC |
|
|
criticality |
U-236 |
2.3Eþ07 |
|
AC |
|
|
|
U-238 |
4.5Eþ09 |
|
AC |
|
|
|
Np-237 |
2.1Eþ06 |
|
AC |
U-238 |
|
|
Pu-238 |
87.7 |
|
AC |
|
35.8 ( ) |
heat output |
Pu-239 |
2.4Eþ04 |
|
AC |
U-238 |
3.3 ( ) |
criticality, |
|
|
|
|
|
|
heat output |
Pu-240 |
6563 |
|
AC |
Pu-239 |
5.5 ( ) |
heat output |
|
|
|
|
|
|
|