

1manly_b_f_j_statistics_for_environmental_science_and_managem
.pdf36 Statistics for Environmental Science and Management, Second Edition
Christchurch
Transect
Dunedin
Figure 2.2
A transect about 90-km long and 3-km wide along which bracken has been sampled in the South Island of New Zealand.
The approximate 95% confidence limits for the true population mean density is therefore 0.625 ± 1.96 × 0.162, or 0.31% to 0.94%.
The strata for stratified sampling were five stretches of the transect, each about 18-km long, and each containing 5400 pixels. The sample results and some of the calculations for this sample are shown in Table 2.4. The estimated population mean density from equation (2.19) is 0.613%, with an estimated variance of 0.0208 from equation (2.21). The estimated standard error is therefore √0.0208 = 0.144, and an approximate 95% confidence limits for the true population mean density is 0.613 ± 1.96 × 0.144, or 0.33% to 0.90%.
In the situation being considered, there might be some interest in estimating the area in the study region covered by bracken. The total area is 27,000 ha. Therefore, the estimate from simple random sampling is 27,000 × 0.00625 = 168.8 ha, with an estimated standard error of 27,000 × 0.00162 = 43.7 ha, expressing the estimated percentage cover as a proportion. The approximate 95% confidence limits are 27,000 × 0.0031 = 83.7 to 27,000 × 0.0094 = 253.8 ha. Similar calculations with the results of the stratified sample give an estimated coverage of 165.5 ha, with a standard error of 38.9 ha, and approximate 95% confidence limits of 89.1 to 243.0 ha.
In this example, the advantage of using stratified sampling instead of simple random sampling is not great. The estimates of the mean bracken
Environmental Sampling |
37 |
Table 2.4
Results of Stratified Random Sampling for Estimating the Density of Bracken along a Transect in the South Island of New Zealand
|
|
|
|
|
Stratum |
|
|
|
|
|
|
Case |
|
1 |
|
2 |
|
3 |
|
4 |
|
5 |
|
|
|
|
|
|
|
||||||
|
|
|
|
|
|
|
|
|
|
|
|
1 |
0 |
0 |
15 |
5 |
0 |
0 |
0 |
0 |
0 |
0 |
|
2 |
0 |
0 |
0 |
0 |
0 |
0 |
0 |
0 |
0 |
0 |
|
3 |
0 |
0 |
0 |
0 |
0 |
0 |
0 |
0 |
0 |
0 |
|
4 |
0 |
0 |
0 |
0 |
0 |
0 |
0 |
0 |
0 |
0 |
|
5 |
0 |
0 |
15 |
0 |
5 |
0 |
0 |
0 |
0 |
0 |
|
6 |
0 |
0 |
0 |
0 |
0 |
0 |
0 |
0 |
0 |
0 |
|
7 |
0 |
0 |
0 |
5 |
0 |
5 |
0 |
5 |
0 |
0 |
|
8 |
0 |
0 |
0 |
0 |
0 |
0 |
0 |
0 |
0 |
0 |
|
9 |
0 |
0 |
0 |
0 |
0 |
0 |
0 |
0 |
0 |
0 |
|
10 |
0 |
0 |
0 |
0 |
0 |
0 |
0 |
0 |
0 |
0 |
|
11 |
0 |
0 |
0 |
0 |
0 |
0 |
0 |
0 |
0 |
0 |
|
12 |
0 |
0 |
0 |
0 |
0 |
0 |
0 |
0 |
0 |
0 |
|
13 |
0 |
0 |
0 |
0 |
0 |
0 |
0 |
0 |
0 |
0 |
|
14 |
0 |
0 |
5 |
0 |
0 |
0 |
0 |
30 |
0 |
0 |
|
15 |
0 |
0 |
0 |
15 |
15 |
0 |
0 |
0 |
0 |
0 |
|
16 |
0 |
0 |
5 |
0 |
0 |
30 |
0 |
0 |
0 |
0 |
|
17 |
5 |
0 |
0 |
0 |
0 |
0 |
0 |
0 |
0 |
0 |
|
18 |
0 |
0 |
15 |
0 |
0 |
0 |
0 |
0 |
0 |
0 |
|
19 |
0 |
0 |
0 |
0 |
0 |
5 |
0 |
0 |
0 |
0 |
|
20 |
0 |
0 |
0 |
0 |
0 |
0 |
0 |
0 |
0 |
0 |
|
21 |
0 |
0 |
0 |
0 |
0 |
0 |
0 |
0 |
0 |
0 |
|
22 |
0 |
0 |
0 |
0 |
0 |
0 |
0 |
0 |
0 |
0 |
|
23 |
0 |
0 |
5 |
0 |
0 |
0 |
0 |
0 |
0 |
0 |
|
24 |
0 |
0 |
0 |
0 |
0 |
0 |
0 |
0 |
0 |
0 |
|
25 |
0 |
5 |
5 |
5 |
0 |
0 |
0 |
0 |
0 |
0 |
|
26 |
0 |
0 |
0 |
0 |
0 |
0 |
0 |
0 |
0 |
0 |
|
27 |
0 |
0 |
0 |
0 |
0 |
5 |
0 |
0 |
0 |
0 |
|
28 |
0 |
0 |
0 |
0 |
0 |
0 |
0 |
0 |
0 |
0 |
|
29 |
0 |
0 |
0 |
0 |
0 |
0 |
0 |
0 |
0 |
0 |
|
30 |
0 |
0 |
5 |
5 |
0 |
0 |
0 |
0 |
0 |
0 |
|
31 |
0 |
0 |
0 |
0 |
0 |
0 |
0 |
0 |
0 |
0 |
|
32 |
0 |
0 |
15 |
5 |
0 |
0 |
0 |
0 |
0 |
0 |
|
33 |
0 |
0 |
0 |
0 |
0 |
0 |
0 |
0 |
0 |
0 |
|
34 |
0 |
0 |
0 |
0 |
0 |
0 |
0 |
0 |
0 |
0 |
|
35 |
0 |
0 |
0 |
0 |
0 |
0 |
0 |
0 |
0 |
0 |
|
36 |
0 |
0 |
0 |
0 |
0 |
0 |
0 |
0 |
0 |
0 |
|
37 |
0 |
0 |
0 |
0 |
0 |
0 |
0 |
0 |
0 |
0 |
|
38 |
0 |
0 |
0 |
0 |
0 |
0 |
0 |
0 |
0 |
0 |
|
(continued on next page)

38 Statistics for Environmental Science and Management, Second Edition
Table 2.4 (continued)
Results of Stratified Random Sampling for Estimating the Density of Bracken along a Transect in the South Island of New Zealand
|
|
|
|
|
Stratum |
|
|
|
|
|
|
Case |
|
1 |
|
2 |
|
3 |
|
4 |
|
5 |
|
|
|
|
|
|
|
||||||
|
|
|
|
|
|
|
|
|
|
|
|
39 |
0 |
0 |
0 |
0 |
0 |
0 |
0 |
0 |
0 |
0 |
|
40 |
0 |
5 |
5 |
0 |
0 |
0 |
0 |
0 |
0 |
0 |
|
|
|
|
|
|
|
|
|
|
|
|
|
Mean |
|
0.1875 |
|
1.625 |
0.8125 |
|
0.4375 |
|
0.000 |
|
|
SD |
|
0.956 |
|
3.879 |
|
3.852 |
|
3.393 |
|
0.000 |
Total |
n |
|
80 |
|
80 |
|
80 |
|
80 |
|
80 |
400 |
N |
|
5,400 |
|
5,400 |
|
5,400 |
|
5,400 |
|
5,400 |
27,000 |
|
|
|
|
|
|
|
|||||
Contributions to the sum in equation (2.19) for the estimated mean |
|
||||||||||
|
|
0.0375 |
|
0.3250 |
|
0.1625 |
|
0.0875 |
|
0.0000 |
0.6125 |
Contributions to the sum in equation (2.21) for the estimated variance |
|||||||||||
|
|
0.0005 |
|
0.0074 |
|
0.0073 |
|
0.0057 |
|
0.0000 |
0.0208 |
|
|
|
|
|
|
|
|
|
|
|
|
density are quite similar, and the standard error from the stratified sample (0.144) is not much smaller than that for simple random sampling (0.162). Of course, if it had been known in advance that no bracken would be recorded in stratum 5, then the sample units in that stratum could have been allocated to the other strata, leading to some further reduction in the standard error. Methods for deciding on sample sizes for stratified and other sampling methods are discussed further in Section 2.13.
2.8 Post-Stratification
At times, there may be value in analyzing a simple random sample as if it were obtained by stratified random sampling. That is to say, a simple random sample is taken and the units are then placed into strata, possibly based on information obtained at the time of sampling. The sample is then analyzed as if it were a stratified random sample in the first place, using the equations given in the previous section. This procedure is called post-stratification. It requires that the strata sizes Ni be known so that equations (2.20) and (2.21) can be used.
A simple random sample is expected to place sample units in different strata according to the size of those strata. Therefore, post-stratification should be quite similar to stratified sampling with proportional allocation, providing that the total sample size is reasonably large. It therefore has some considerable potential merit as a method that permits the method of stratification to be changed after a sample has been selected. This may be particularly valuable in situations where the data may be used for a variety of purposes, some of which are not known at the time of sampling.
Environmental Sampling |
39 |
2.9 Systematic Sampling
Systematic sampling is often used as an alternative to simple random sampling or stratified random sampling for two reasons. First, the process of selecting sample units is simpler for systematic sampling. Second, under certain circumstances, estimates can be expected to be more precise for systematic sampling because the population is covered more evenly.
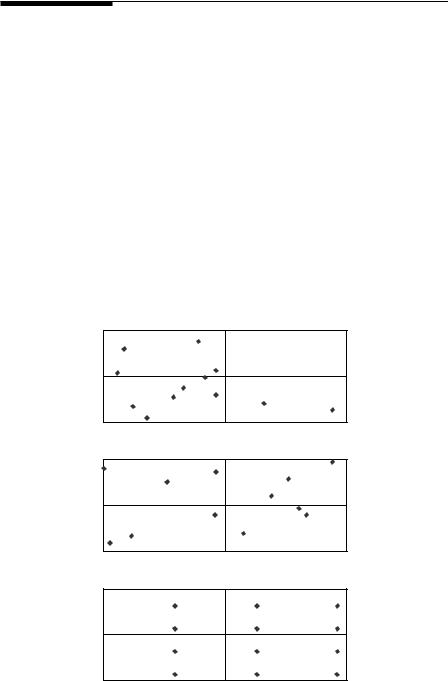
The basic idea with systematic sampling is to take every kth item in a list, or to sample points that are regularly placed in space. As an example, consider the situation that is shown in Figure 2.3. The top part of the figure shows the positions of 12 randomly placed sample points in a rectangular study area. The middle part shows a stratified sample where the study region is divided into four equal-sized strata, and three sample points are placed randomly within each. The lower part of the figure shows a systematic sample where the study area is divided into 12 equal-sized quadrats, each of which contains a point at the same randomly located position within the quadrat. Quite clearly, stratified sampling has produced better control than random
Simple Random Sampling
Stratified Random Sampling
Systematic Sampling
Figure 2.3
Comparison of simple random sampling, stratified random sampling, and systematic sampling for points in a rectangular study region.
40 Statistics for Environmental Science and Management, Second Edition
sampling in terms of the way that the sample points cover the region, but not as much control as systematic sampling.
It is common to analyze a systematic sample as if it were a simple random sample. In particular, population means, totals, and proportions are estimated using the equations in Sections 2.3 to 2.5, including the estimation of standard errors and the determination of confidence limits. The assumption is then made that, because of the way that the systematic sample covers the population, this will, if anything, result in standard errors that tend to be somewhat too large and confidence limits that tend to be somewhat too wide. That is to say, the assessment of the level of sampling errors is assumed to be conservative.
The only time that this procedure is liable to give a misleading impression about the true level of sampling errors is when the population being sampled has some cyclic variation in observations, so that the regularly spaced observations that are selected tend to all be either higher or lower than the population mean. Therefore, if there is a suspicion that regularly spaced sample points may follow some pattern in the population values, then systematic sampling should be avoided. Simple random sampling and stratified random sampling are not affected by any patterns in the population, and it is therefore safer to use these when patterns may be present.
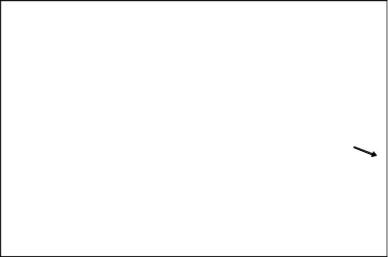
The U.S. Environmental Protection Agency (US EPA 1989a) manual on statistical methods for evaluating the attainment of site cleanup standards recommends two alternatives to treating a systematic sample as a simple random sample for the purpose of analysis. The first of these alternatives involves combining adjacent points into strata, as indicated in Figure 2.4. The population mean and standard error are then estimated using equations (2.26) and (2.27). The assumption being made is that the sample within each of the imposed strata is equivalent to a random sample. It is most important that the strata are defined without taking any notice of the values of observations, because otherwise bias will be introduced into the variance calculation.
If the number of sample points or the area is not the same within each of the strata, then the estimated mean from equation (2.26) will differ from the simple mean of all of the observations. This is to be avoided because it will be an effect that is introduced by a more-or-less arbitrary system of stratification. The estimated variance of the mean from equation (2.27) will inevitably depend on the stratification used, and under some circumstances it may be necessary to show that all reasonable stratifications give about the same result.
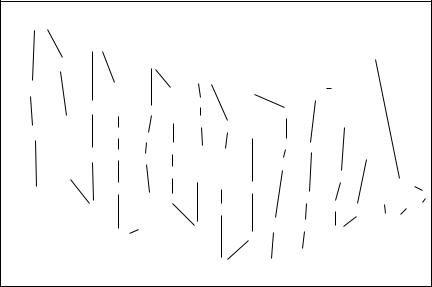
The second alternative to treating a systematic sample as a simple random sample involves joining the sample points with a serpentine line that joins neighboring points and passes only once through each point, as shown in Figure 2.5. Assuming that this has been done, and that yi is the ith observation along the line, it is assumed that yi−1 and yi are both measures of the variable of interest in approximately the same location. The difference squared (yi − yi−1)2 is then an estimate of twice the variance of what can be thought

Environmental Sampling |
41 |
Site Boundary
Figure 2.4
Grouping sample points from a systematic sample so that it can be analyzed as a stratified sample. The sample points (•) are grouped here into 10 strata, each containing six points.
Start of Line |
Site Boundary |
(point 1) |
|
End of Line
(point 60)
Figure 2.5
Defining a serpentine line connecting the points of a systematic sample so that the sampling variance can be estimated using squared differences between adjacent points on the line.
of as the local sampling errors. With a systematic sample of size n, there are n − 1 such squared differences, leading to a combined estimate of the variance of local sampling errors of
n |
|
sL2 = 1 2 ∑(yi −yi−1)2/(n −1) |
(2.28) |
i=1
On this basis, the estimate of the standard error of the mean of the systematic sample is
SÊ(y) = sL/√n |
(2.29) |
42 Statistics for Environmental Science and Management, Second Edition
No finite sampling correction is applied when estimating the standard error on the presumption that the number of potential sampling points in the study area is very large. Once the standard error is estimated using equation (2.29), approximate confidence limits can be determined using equation (2.7), and the population total can be estimated using the methods described in Section 2.4. This approach for assessing sampling errors was found to be as good or better than seven alternatives from a study that was carried out by Wolter (1984).
An alternative to adopting one of the methods described in this section for estimating the mean from a systematic sample involves using a geostatistical analysis, as briefly described in Sections 9.8 and 9.9 of this book. This approach is intended to properly account for the correlation between the observations at different distances apart in the study area.
Example 2.4: Total PCBs in Liverpool Bay Sediments
Camacho-Ibar and McEvoy (1996) describe a study that was aimed at determining the concentrations of 55 polychlorinated biphenyl (PCB) congeners in sediment samples from Liverpool Bay in the United Kingdom. For this purpose, the total PCB was defined as the summation of the concentrations of all the identifiable individual congeners that were present at detectable levels in each of 66 grab samples taken between 14 and 16 September 1988. The values for this variable and the approximate position of each sample are shown in Figure 2.6. Although the sample locations were not systematically placed over the bay, they are more regularly spaced than would be expected to occur with random sampling.
4069 |
|
|
|
|
|
|
|
|
|
|
|
|
|
|
|
2890 |
|
|
|
|
|
|
|
|
3108 |
|
|
|
|
|
2597 |
|
3153 |
|
|
|
|
|
|
|
|
|||
|
|
5990 |
|
|
|
|
|
|
|
|
|
|||
1114 |
1870 |
|
4486 |
|
2032 |
5218 2068 |
|
|
|
|
||||
|
3164 |
|
|
|
|
|
||||||||
|
4832 |
3621 |
5256 |
|
4136 |
|
|
|
|
|
|
|||
|
|
|
5314 |
|
|
|
|
|||||||
96 |
2599 |
6755 |
303 |
2384 |
315 28680 |
|
|
|
|
|
||||
|
|
|
|
5702 |
|
|
|
|
|
|
|
|||
|
86 |
1516 |
305 |
402 |
1980 223 |
8767 633 |
|
967 |
|
|
|
|
||
|
537 |
687 |
|
|
|
|
|
|
||||||
|
266 |
|
|
473 |
|
|
143 |
|
|
|
|
|
||
|
|
|
|
|
|
|
|
|
|
|
||||
|
133 |
454 |
421 |
401 |
2278 |
|
14339 |
|
||||||
1444 |
|
488 |
|
|
|
|
||||||||
1306 |
|
|
231 |
|
2204 |
37883 |
16143 |
|||||||
|
|
|
|
|
|
|
17688 |
13676 |
|
|||||
|
|
794 |
607 |
|
359 |
|
1084 321 |
305 |
4160 |
13882 |
|
|||
|
|
|
|
|
|
|
|
|
||||||
|
|
|
|
|
|
273 |
192 |
82 |
|
|
|
|
|
|
|
|
|
|
|
|
|
|
|
|
|
|
|
||
Figure 2.6
Concentration of total PCBs (pg g−1) in samples of sediment taken from Liverpool Bay. Observations are shown at their approximate position in the study area. The arrow points to the entrance to the River Mersey.
Environmental Sampling |
43 |
The mean and standard deviation of the 66 observations are y = 3937.7 and s = 6646.5, in units of pg g−1 (picograms per gram, i.e., parts per 1012). Therefore, if the sample is treated as being equivalent to a simple random sample, then the estimated standard error is SÊ(y) = 6646.5/√66 = 818.1, and the approximate 95% confidence limits for the mean over the sampled region are 3937.7 ± 1.96 × 818.1, or 2334.1 to 5541.2.
The second method for assessing the accuracy of the mean of a systematic sample, as described previously, entails dividing the samples into strata. This division was done arbitrarily using 11 strata of six observations each, as shown in Figure 2.7, and the calculations for the resulting stratified sample are shown in Table 2.5. The estimated mean level for total PCBs in the area is still 3937.7 pg g−1. However, the standard error calculated from the stratification is 674.2, which is lower than the value of 818.1 found by treating the data as coming from a simple random sample. The approximate 95% confidence limits from stratification are 3937.7 ± 1.96 × 674.2, or 2616.2 to 5259.1.
Finally, the standard error can be estimated using equations (2.28) and (2.29), with the sample points in the order shown in Figure 2.7, but with the closest points connected between the sets of six observations that formed the strata before. This produces an estimated standard deviation of sL = 5704.8 for small-scale sampling errors, and an estimated standard error for the mean in the study area of SÊ(y) = 5704.8/√66 = 702.2. By this method, the approximate 95% confidence limits for the area mean are 3937.7 ± 1.96 × 702.2, or 2561.3 to 5314.0 pg g−1. This is quite close to what was obtained using the stratification method.
4069 |
|
|
|
|
|
|
|
|
|
|
|
|
2890 |
|
|
|
|
|
|
|
|
|
|
3108 |
|
2597 |
|
3153 |
|
|
|
|
|
|
|
|
|
|
|
|
5990 |
|
|
|
|
|
|
|
|
||
1114 |
1870 |
|
|
|
|
2032 |
|
5218 2068 |
|
|||
4486 |
3164 |
|
|
|
|
|||||||
4832 3621 |
5256 |
2384 |
|
|
|
4136 |
|
|
|
|
||
315 |
28680 |
|
|
5314 |
|
|||||||
2599 |
6755 |
303 |
5702 |
|
|
|||||||
96 |
|
|
|
|
|
|
|
|
||||
86 |
1516 |
305 |
402 |
1980 |
223 |
|
|
8767 |
633 |
|
967 |
|
266 |
|
537 |
|
|
|
|
687 |
|
|
|
|
|
|
|
473 |
|
|
|
|
143 |
|
|
|||
133 |
|
421 |
|
401 |
|
|
14339 |
|||||
1444 |
454 |
488 |
|
|
|
2278 |
|
|||||
|
|
231 |
|
|
|
2204 |
37883 |
16143 |
||||
1306 |
|
|
|
|
|
|
|
|
17688 |
13676 |
||
|
|
607 |
|
359 |
|
|
|
321 |
305 |
4160 |
13882 |
|
|
794 |
|
|
1084 |
|
|
||||||
|
|
|
|
|
|
|
|
|||||
|
|
|
|
|
|
|
|
|
|
|||
|
|
|
|
|
273 |
|
|
192 |
82 |
|
|
|
|
|
|
|
|
|
|
|
|
|
|
||
Figure 2.7
Partitioning of samples in Liverpool Bay into 11 strata consisting of points that are connected by lines, so that stratum 1 contains the observations 1444, 96, 1114, 4069, 2597, and 2599.

44 Statistics for Environmental Science and Management, Second Edition
Table 2.5
Treating the Data on Total PCBs as Coming from a Stratified Sample
|
|
|
Total PCB (pg g−1) |
|
|
|
Contribution |
||
Stratum |
|
|
|
Mean |
SD |
to Variance |
|||
1 |
1,444 |
96 |
1,114 |
4,069 |
2,597 |
2,599 |
1,986.5 |
1,393.9 |
2,676.1 |
2 |
266 |
1,306 |
86 |
4,832 |
2,890 |
1,870 |
1,875.0 |
1,782.5 |
4,376.7 |
3 |
3,621 |
6,755 |
1,516 |
133 |
794 |
607 |
2,237.7 |
2,530.4 |
8,819.2 |
4 |
454 |
305 |
303 |
5,256 |
3,153 |
4,486 |
2,326.2 |
2,263.4 |
7,056.7 |
5 |
2,384 |
402 |
537 |
488 |
359 |
473 |
773.8 |
791.4 |
862.6 |
6 |
1,980 |
315 |
3,164 |
5,990 |
28,680 |
223 |
6,725.3 |
10,964.7 |
165,598.4 |
7 |
421 |
231 |
273 |
1,084 |
401 |
5,702 |
1,352.0 |
2,153.4 |
6,387.4 |
8 |
2,032 |
4,136 |
8,767 |
687 |
321 |
192 |
2,689.2 |
3,326.2 |
15,239.1 |
9 |
82 |
305 |
2,278 |
633 |
5,218 |
2,068 |
1,764.0 |
1,924.8 |
5,102.9 |
10 |
5,314 |
143 |
2,204 |
4,160 |
17,688 |
967 |
5,079.3 |
6,471.9 |
57,692.8 |
11 |
3,108 |
14,339 |
16,143 |
37,883 |
13,676 |
13,882 |
16,505.2 |
11,456.0 |
180,772.6 |
|
|
|
|
|
|
|
|
|
|
|
|
|
|
|
|
|
3,937.7 |
|
454,584.5 |
|
|
|
|
|
|
|
|
|
SE = 674.2 |
Note: The 66 sample points have been grouped into 11 strata with six points in each (Figure 2.7). The last column in the table shows the contributions from each of the strata to the summation on the right-hand side of equation (2.27) for the stratified sample variance. For this equation, all strata are treated as being of equal size, so that wi = 1/11 for all i. The standard error of the estimated mean (SE) is the square root of the sum of the last column.
2.10 Other Design Strategies
So far in this chapter the sample designs that have been considered are simple random sampling, stratified random sampling, and systematic sampling. There are also a number of other design strategies that are sometimes used. Here, some of the designs that may be useful in environmental studies are just briefly mentioned. For further details, see Scheaffer et al. (1990), Thompson (1992), or some other specialized text on sampling. Also, a very useful text on methods for sampling rare animals and plants is Thompson (2004).
With cluster sampling, groups of sample units that are close in some sense are randomly sampled together, and then all measured. The idea is that this will reduce the cost of sampling each unit, so that more units can be measured than would be possible if they were all sampled individually. This advantage is offset to some extent by the tendency of sample units that are close together to have similar measurements. Therefore, in general, a cluster sample of n units will give estimates that are less precise than a simple random sample of n units. Nevertheless, cluster sampling may give better value for money than the sampling of individual units.
With multistage sampling, the sample units are regarded as falling within a hierarchical structure. Random sampling is then conducted at the various levels within this structure. For example, suppose that there is interest in
Environmental Sampling |
45 |
estimating the mean of some water-quality variable in the lakes in a very large area such as a whole country. The country might then be divided into primary sampling units consisting of states or provinces; each primary unit might then consist of a number of counties, and each county might contain a certain number of lakes. A three-stage sample of lakes could then be obtained by first randomly selecting several primary sampling units, next randomly selecting one or more counties (second-stage units) within each sampled primary unit, and finally randomly selecting one or more lakes (third-stage units) from each sampled county. This type of sampling plan may be useful when a hierarchical structure already exists, or when it is simply convenient to sample at two or more levels.
The technique of composite sampling is valuable in situations where the cost of selecting and acquiring sample units is much less than the cost of analyzing them. What this involves is the mixing of several samples from approximately the same location and then analyzing the composite samples. For example, sets of four samples might be mixed so that the number of analyses is only one-quarter of the number of samples. This should have little effect on the estimated mean, provided that the samples are mixed sufficiently so that the observation from a composite sample is close to the mean for the samples that it contains. However, there is a loss of information about extreme values for individual sample units because of dilution effects. If there is a need to identify individual samples with extreme values, then methods are available to achieve this without the need to analyze every sample. These and other aspects of composite sampling are discussed by Gore and Patil (1994) and Patil (1995), while Gilbert (1987) considers the estimation of the mean when composite samples are used with more complicated sampling designs.
Ranked-set sampling is another method that can be used to reduce the cost of analysis in surveys. The technique was originally developed for the estimation of the biomass of vegetation (McIntyre 1952), but the potential uses are much wider. It relies on the existence of an inexpensive method of assessing the relative magnitude of a small set of observations to supplement expensive accurate measurements.
As an example, suppose that 90 uniformly spaced sample units are arranged in a rectangular grid over an intertidal study area, and that it is necessary to estimate the average barnacle density. A visual assessment is made of the density on the first three units, which are then on that basis ordered from the one with the lowest density to the one with the highest density. The density is then determined accurately for the highest ranked unit. The next three units are then visually ranked in the same way, and the density is then determined accurately for the unit with the middle of the three ranks. Next, sample units 7, 8, and 9 are ranked, and the density determined accurately for the unit with the lowest rank. The process of visually ranking sets of three units and measuring first the highest ranking unit, then the middle ranking unit, and finally the lowest ranking unit is then repeated using units 10 to 18, units 19 to 27, and so on. After the completion of this