

Global Economic Prospects -World Bank_watermark
.pdfvk.com/id446425943
G L O BAL E CO N O MI C P ROS PE C TS | J U NE 2 0 19 |
C H AP TE R 1 |
51 |
|
|
|
UNCTAD (United Nations Conference on Trade and Development). 2018. World Investment Report 2018: Investment and New Industrial Policies. Geneva: UNCTAD.
UNECA (United Nations Economic Commission for Africa). 2018. Assessing Regional Integration in Africa VIII. Addis Ababa, Ethiopia: UNECA.
World Bank. 2015. Global Economic Prospects Report: Having Fiscal Space and Using It. January. Washington, DC: World Bank.
———.2016. Global Economic Prospects: Spillovers and Weak Growth. January. Washington, DC: World Bank.
———.2017a. Global Economic Prospects: A Fragile Recovery. June. Washington, DC: World Bank.
———.2017b. Tax Revenue Mobilization: Lessons from World Bank Group Support for Tax Reform. January.
Washington, DC: World Bank.
———. 2017c. Global Economic Prospects: Weak Investment in Uncertain Times. January. Washington, DC: World Bank.
———.2017d. Climate and Disaster Resilient Transport in Small Island Developing States: A Call for Action. October. Washington, DC: World Bank.
———.2018a. “Debt Vulnerabilities in IDA Countries.” Paper prepared as a response to the interest expressed at the IDA Technical Briefing during the 2018 Spring Meetings, October 4, World Bank,
Washington, DC.
———. 2018b. Global Economic Prospects: The Turning of the Tide? June. Washington, DC: World Bank
———. 2018c. Global Economic Prospects: Broad-Based Upturn, but for How Long? January. Washington, DC: World Bank
———.2018d. Global Investment Competitiveness Report 2017/2018: Foreign Investor Perspectives and Policy Implications. Washington, DC: World Bank.
———.2018e. Commodity Markets Outlook. The Changing of the Guard: Shifts in Industrial Commodity Demand. October. Washington, DC: World Bank
———.2018f. Poverty and Shared Prosperity Report 2018: Piecing Together the Poverty Puzzle. Washington,
DC: World Bank.
———. 2018g. China—Systematic Country Diagnostic: Towards a More Inclusive and Sustainable Development. Washington, DC: World Bank.
———. 2018h. Africa’s Pulse: An Analysis of Issues Shaping Africa’s Economic Future. April. Washington, DC: World Bank.
———. 2018i. Connecting to Compete 2018. Trade Logistics in the Global Economy: The Logistics Performance Index and Its Indicators. Washington, DC: World Bank.
———.2019a. Global Economic Prospects: Darkening Skies. January. Washington, DC: World Bank.
———.2019b. Africa’s Pulse: An Analysis of Issues Shaping Africa’s Economic Future. April. Washington,
DC: World Bank.
———. 2019c. Europe and Central Asia Economic Update: Financial Inclusion. April. Washington, DC: World Bank.
———. 2019d. In Middle East and North Africa Economic Monitor: Reforms and External Imbalances: The Labor-Productivity Connection in the Middle East and North Africa. April. Washington, DC: World Bank.
———. 2019e. East Asia and Pacific Economic Update: Managing Headwinds. April. Washington, DC: World Bank.
———.2019f. South Asia Economic Focus: Exports Wanted. Spring. Washington, DC: World Bank.
———.2019g. The World Bank Group’s Action Plan
on |
Climate |
Change |
Adaptation |
and |
Resilience. Washington, DC: World Bank. |
|
|||
———. 2019h. World Development Report. The Changing Nature of Work. Washington, DC: World Bank.
———. Forthcoming. Harvesting Prosperity: Technological Progress and Productivity Growth in Agriculture. Washington, DC: World Bank.
World Bank and IMF (International Monetary Fund). 2001. Developing Government Bond Markets: A Handbook. Washington, DC: World Bank.
WTO (World Trade Organization). 2018. World Trade Report 2018: The Future of World Trade. Geneva: World Trade Organization.
Yared, P. 2019. “Rising Government Debt: Causes and Solutions for a Decades-Old Trend.” Journal of Economic Perspectives 33 (2): 115–140.
vk.com/id446425943

vk.com/id446425943
 FOCUS 1.1
Investment: Subdued Prospects,
Strong Needs
vk.com/id446425943

vk.com/id446425943
G L O BAL EC O NO M I C P ROS P EC T S | J U NE 2 0 1 9 |
S P EC I AL F O CU S 1 . 1 |
55 |
|
|
|
Investment: Subdued Prospects, Strong Needs
Investment growth in emerging market and developing economies (EMDEs) over the next three years is expected to be subdued and below historical averages. This continues a prolonged, broad-based slowdown after the global financial crisis, notwithstanding a modest recovery between 2016 and 2018. During the forecast period, EMDE investment growth is expected to be held back by weak global growth, limited fiscal space against the backdrop of elevated debt, and the presence of several structural constraints. Weak investment is a concern because it will further dampen potential growth, and make achieving the Sustainable Development Goals more difficult. Depending on country circumstances, the use of appropriate fiscal and structural reforms could generate upside potential for investment in the medium and long term. For EMDEs with limited fiscal space, institutional reforms to improve business conditions could help attract private investment. In light of elevated debt levels, policymakers should also ensure resources are allocated to high quality investment projects and improve the transparency and efficiency of public investment management systems where necessary.
Recent developments and prospects
Investment growth in emerging market and developing economies (EMDEs) is below historical averages and is expected to remain weak over the forecast horizon (Figure SF1.1.1.A).1 In absolute terms, EMDE investment amounted to $9.7 trillion (nearly one-third of GDP) in 2018. This Special Focus updates previous work analyzing the drivers and implications of post-crisis investment weakness in EMDEs (World Bank 2017; Kose et al. 2017; Vashakmadze et al. 2017).
EMDE investment growth reached a modest 4.7 percent in 2018 and is expected to slow (to 3.9 percent) in 2019, before advancing modestly in 2020 and 2021. A modest cyclical recovery in commodity exporters is expected to support the investment recovery in 2020-21. The outlook for EMDE investment has been downgraded since 2018, however, amid weaker-than-expected global activity and softening investor confidence. Moreover, EMDE investment growth is projected to remain below historical averages during the forecast period.
Note: This Special Focus was prepared by Dana Vorisek, Naotaka Sugawara, and Lei Sandy Ye. Research assistance was provided by Liu Cui and Mengyi Li.
1 Investment is defined as real gross fixed capital formation. Table SF1.1.1 lists the countries in the investment sample. Together, the 65 EMDEs and 34 advanced economies represent 96 percent of global GDP in 2018. The 65 EMDEs represent 92 percent of total EMDE GDP in 2018.
FIGURE SF1.1.1 Investment trends and prospects
Notwithstanding a modest recovery from its 2015 low, EMDE investment growth remains weak and below historical averages—in the aggregate as well as in the majority of countries. Investment growth in EMDEs is projected to advance modestly in the medium term, reflecting a pickup in commodity exporters, but to a rate still below historical averages. The sluggishness of investment is expected to persist in the long term.
A. EMDE investment growth |
B. Share of EMDEs with investment |
|
growth below 2000-18 average |
C. Investment growth |
D. Long-term investment growth |
|
forecasts |
Source: Consensus Economics, Haver Analytics, Oxford Economics, World Bank.
A.-C. Investment refers to real gross fixed capital formation (public and private combined). 2010 investment-weighted averages. Sample includes 65 EMDEs and 34 advanced economies (listed in Table SF1.1.1). Due to limited data availability, this special focus covers a smaller set of EMDEs than those for which the WBG projects GDP growth in Global Economic Prospects.
A. Shaded areas indicate forecasts.
B.C. Shaded areas indicate global recessions and slowdowns.
D. 10-year-ahead forecasts surveyed in indicated year. Constant 2010 U.S. dollar investmentweighted averages. Sample includes 23 advanced economies and 20 EMDEs (indicated by † in Table SF1.1.1). For 2010-18, the average of four projections during the year is shown; for 2019, the average of two projections during the first half of the year is shown.
Click here to download data and charts.

vk.com/id446425943
56 |
S P EC I AL F O CU S 1 . 1 |
G L O BAL EC O NO M I C P ROS P EC T S | J U NE 2 0 1 9 |
|
|
|
The recent modest recovery in EMDE investment growth follows a prolonged, broad-based slowdown following the global financial crisis. Investment growth in these economies fell from 11.8 percent in 2010 to a low of 2.8 percent in 2015. In well over half of EMDEs, investment growth has been below country-specific long-term averages since 2012 (Figure SF1.1.1.B). This differs from the experience in advanced economies, where investment growth recovered rapidly after the global financial crisis and has since been around its long-term average of 2.3 percent (Figure SF1.1.1.C). For the world, investment growth is expected to decelerate to 2.7 percent in 2019, from 3.7 percent in 2018, and to remain subdued through 2021, held back by persistent sluggishness in investment growth in advanced economies.
The long-term investment outlook is subdued. The private sector’s 10-year-ahead outlook for investment has steadily weakened over the past decade, for both EMDEs and the world (Figure SF1.1.1.D; Kose, Ohnsorge, and Sugawara, forthcoming).2 In early 2019, the 10-year-ahead outlook for EMDE investment growth was 3.2 percent, nearly 8 percentage points below the most recent high in 2010, and more than half a percentage point lower than projected in 2018. The long-term outlook for EMDEs excluding China has also been downgraded relative to 2018.
Against this backdrop, this Special Focus examines the following questions.
•What were the main drivers of weak postcrisis investment growth in EMDEs?
•What are the implications of weak investment growth in EMDEs and what policy responses are available?
This Special Focus extends previous analysis of investment in EMDEs in several dimensions (World Bank 2017; Kose et al. 2017). First, it updates the investment data and provides revised projections of investment growth. Second, the study examines how the drivers of investment
2 The world sample includes 23 advanced economies and 20 EMDEs that together represent 87 percent of global GDP in 2018. The 20 EMDEs represent 78 percent of total EMDE GDP in 2018.
growth have changed during the past decade— comparing the drivers in the immediate post-crisis years to the most recent years, when investment growth began to recover. Third, it discusses the mediumand long-term consequences of weak investment growth.
The Special Focus presents the following main findings. First, investment growth in EMDEs has risen modestly since bottoming out in 2015, reflecting a cyclical recovery among commodityexporting EMDEs and a fading of country-specific factors holding back investment in some large economies. In the medium term, investment growth is expected to continue to gain ground, although only modestly, and at a pace still below long-term historical averages. Second, empirical estimates suggest that during 2015-18, the main driver of the acceleration in EMDE investment growth was the terms of trade improvement in commodity-exporting economies. This contrasts with the multiple cyclical drivers depressing investment growth in a large number of EMDEs during 2011-15. Third, weak investment growth has contributed to weaker potential growth and will make meeting the Sustainable Development Goals (SDGs) more challenging. A sustained improvement in investment growth in EMDEs requires the use of fiscal, monetary, and structural policy tools, with specific priorities depending on country circumstances.
Drivers of investment growth
Post-crisis slowdown
The slowdown in EMDE investment growth from 2010 to 2015 reflected external and domestic factors.3 For commodity exporters, a steep drop in oil and metals prices between mid-2014 and early 2016 and associated adverse terms-of-trade shocks
3 Studying the trends in investment growth is relevant for shortterm analysis. Trends in investment ratios (i.e., investment relative to GDP) are an important complement to trends in investment growth, and are more relevant for long-term analysis on investment and savings. For the sample of 65 EMDEs used in this note, the investment ratio has moderated somewhat, from a post-2000 high of 34.8 percent in 2013 to 33.4 percent in 2018. Excluding China, the investment ratio in EMDEs is substantially lower, but it has also fallen, from a high of 25.4 percent in 2012 to 23.8 percent in 2018.
vk.com/id446425943
G L O BAL EC O NO M I C P ROS P EC T S | J U NE 2 0 1 9 |
S P EC I AL F O CU S 1 . 1 |
57 |
|
|
|
were key factors behind their investment slowdown (Islamaj et al. 2019; Kose et al. 2017; World Bank 2017; Stocker et al. 2018; Vashakmadze et al. 2017). Policy uncertainty, weak activity in advanced economies, and high corporate leverage also dampened investment in EMDEs during this period.
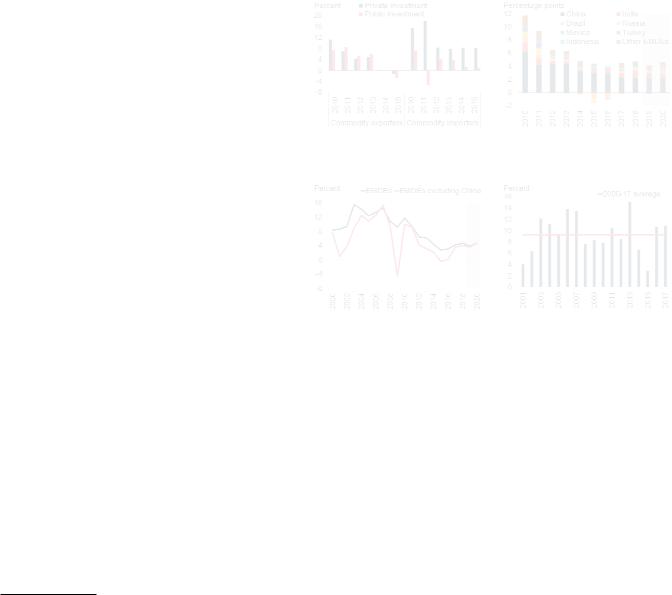
Slowing investment growth in EMDEs reflected decelerations in both public and private investment growth during the post-crisis period (Figure SF1.1.2.A).4 The two largest commodityexporting economies, Brazil and Russia, suffered double-digit investment contractions in 2015 amid deep economic recessions. Investment growth in commodity-importing economies has been less volatile, but also moderated after 2010. An economic policy shift in China toward more sustainable and balanced growth (i.e., more reliance on consumption and less reliance on investment) contributed significantly to the EMDE investment growth slowdown (Figure SF1.1.2.B). Slowing investment growth in China may also have dampened investment growth in other EMDEs (World Bank 2017). Yet even excluding China, investment growth in EMDEs has slowed since 2010 (Figure SF1.1.2.C).
Moderate recovery since 2016
The moderate recovery in investment growth since 2016 reflects in part a pickup in global manufacturing and trade that began in mid-2016 and peaked in late 2017. The recovery has been further supported by a rebound in oil and metals prices in 2017-18, which encouraged capital expenditures in the commodity-dependent regions of Latin America and Sub-Saharan Africa.
Commodity exporters. Investment growth in EMDE commodity exporters accelerated to 2.2 percent in 2017 and 3.2 percent in 2018, after two years of contraction. In Russia, investment
4 Among the 11 EMDEs that disaggregate private and public investment in their national accounts, private investment growth outpaced public investment growth in 2016-18 in some (Bahrain, Malaysia, Mexico, South Africa, Thailand), while public investment growth has been faster in others (Bangladesh, Peru). In still other countries, the trend is less clear. Private investment has accounted for about three-quarters of total investment, on average, since 2010, in the EMDEs that disaggregate the two components.
FIGURE SF1.1.2 Decomposition of EMDE investment trends
Slowing investment growth in EMDEs after 2010 reflected decelerations in both public and private investment growth. By country composition, China accounts for a large portion of the investment slowdown in EMDEs after 2010, but commodity-exporting economies also contributed. LICs for which data is available showed above-trend investment growth in 2016 and 2017, after a slowdown in 2014-15.
A. Public and private investment |
B. Country contributions to EMDE |
growth in EMDEs |
investment growth |
C. Investment growth |
D. Investment growth in LICs |
Source: Haver Analytics, International Monetary Fund, World Bank.
A.2010 investment-weighted averages. Investment refers to real gross fixed capital formation. EMDE sample includes 63 economies (listed in Table SF1.1.1, except Jamaica and West Bank and Gaza).
B.C. 2010 investment-weighted averages. Investment refers to real gross fixed capital formation. Shaded areas indicate forecasts. EMDE sample includes 65 economies (listed in Table SF1.1.1).
D. 2010 investment-weighted averages. Sample includes eight LICs: Benin, Burkina Faso, Mali, Mozambique, Nepal, Senegal, Tanzania, and Uganda.
Click here to download data and charts.
growth rebounded in 2016 and 2017 from a low associated with sharply declining oil prices and international sanctions in 2015. In Brazil, investment growth accelerated in 2018 as the economy slowly recovered from a multiyear recession. Large infrastructure projects are supporting solid investment in Indonesia. Improvements in these countries more than offset deteriorating investment growth in 2018 in other large economies, such as Argentina, where investment contracted due to financial turmoil, policy uncertainty, and a severe drought—and the Islamic Republic of Iran, where U.S. economic sanctions are inhibiting investment.

vk.com/id446425943
58 |
S P EC I AL F O CU S 1 . 1 |
G L O BAL EC O NO M I C P ROS P EC T S | J U NE 2 0 1 9 |
|
|
|
Commodity importers. Investment growth in commodity-importing EMDEs also picked up in 2018, to 5.5 percent. In China, private investment improved in response to policies, which offset weakness in public investment. In India, investment firmed as temporary disruptions, such as those related to the implementation of a goods and services tax in 2017, faded and credit growth picked up. Investment in Mexico recovered modestly in 2018 as trade uncertainty receded with the announcement of the United States- Mexico-Canada Agreement. In Turkey, however, investment slumped last year, as the country experienced high market volatility and economic stress.
Low-income countries. Low-income countries (LICs) with available data initially (during 201013) did not share the investment slowdown of the broader group of EMDEs (Figure SF1.1.2.D). However, investment appears to have fallen sharply, in line with other EMDEs, during the global financial crisis and the most recent commodity price bust starting in 2014. The 201415 slowdown was followed by two years of abovetrend growth. In Nepal and Tanzania, two of the largest LIC economies, investment expanded rapidly in 2016-17, on post-earthquake reconstruction and robust construction sector activity, respectively. All LICs with available data reported solid investment growth in 2017.
Modest medium-term acceleration
Investment growth in EMDEs is expected to dip slightly in 2019, to 3.9 percent, reflecting the resumption of a trend slowdown in investment growth in China as it rebalances its economy, as well as temporary factors in several other large commodity importers. These factors include policy uncertainty in Mexico (including for the domestic oil and gas sector) and a challenging post -crisis investment environment in Argentina and Turkey.
In 2020 and 2021, investment growth is projected to accelerate moderately, supported by faster growth in commodity exporters, but still fall short of trend rates. In Brazil, for instance, investment growth is expected to recover as confidence
improves and credit conditions become gradually less tight. In Russia, investment is expected to accelerate moderately as public spending on infrastructure picks up. The acceleration will not be universal among the largest economies, however. Through 2021, investment growth in China is expected to continue its gradual moderation, to rates well below those of recent decades. In India, it is expected to grow a slower pace than in 2018, although investment growth is expected to remain robust as benefits of recent policy reforms further materialize.
In addition to country-specific drivers of the EMDE investment outlook, several broad factors are expected to influence EMDE investment growth in the short and medium term.
Easier financing conditions. In the context of an increasingly dovish stance by the U.S. Federal Reserve and the European Central Bank, external financing conditions for EMDEs have improved since late 2018.5 Sovereign bond spreads have fallen, bond issuance has picked up, and recent data indicate that capital inflows to EMDEs are recovering. The easier financing environment may provide a boost to still sluggish investment, at least in the short term. However, additional financing must be channeled toward productive uses, so that it does not simply add to already high government and corporate leverage in many EMDEs.
Limited fiscal space and rising debt. Elevated and rising debt levels in EMDEs, including corporate debt, will weigh on investment growth, especially if global financing conditions tighten unexpectedly. Government finances in many EMDEs are in a fragile position, with deteriorating debt dynamics and limited fiscal space (Figure SF1.1.3.A). In some cases, reforms to improve fiscal space have stalled, while funding of new or increasing liabilities, such as public sector wage bills, has put further strain on domestic revenues
5 Many studies have found strong linkages between the U.S. monetary policy stance and credit cycles in EMDEs. A recent study finds that the spillovers between accommodative U.S. monetary policy and foreign bank lending to emerging markets is strongest for the most risky countries, and within countries, strongest for the most risky firms (Bräuning and Ivashina 2018).
vk.com/id446425943
G L O BAL EC O NO M I C P ROS P EC T S | J U NE 2 0 1 9 |
S P EC I AL F O CU S 1 . 1 |
59 |
|
|
|
(Brazil, South Africa). Oil exporters continue to face fiscal sustainability challenges. In metals and agricultural producers, weaker-than-envisaged commodity prices could put further pressure on already fragile public finances (South Africa, Zambia). The relationship between limited fiscal space and sluggish investment may be particularly strong for countries, including many LICs, where debt levels have increased in recent years and interest payments are absorbing a rising share of government revenues (World Bank 2019a). Inefficient management of public finances may also constrain investment growth in EMDEs.
Unfavorable external economic outlook. External conditions for EMDE investment are expected to become less favorable in the medium term (World Bank 2019a). Growth is projected to ease in major economies (China, the Euro Area, the United States) in 2019-21, which may slow investment and exports in closely-linked EMDEs. Commodity prices—both energy and non- energy—are projected to weaken somewhat in 2019 (World Bank 2019b). In addition, global policy uncertainty, including trade policy uncertainty, remains elevated. Persistent investor concerns about possible further protectionist trade actions could reduce the attractiveness of new investment projects. Generalized market-related uncertainty could also reduce capital flows to EMDEs, potentially hindering investment (Figure SF1.1.3.B).6
Structural factors. In addition to macroeconomic factors, institutional and structural factors play a role in determining investment growth and investment ratios in EMDEs. These factors include financial sector development and oversight, trade policy, demographic change, and economic diversification, among others (World Bank 2017).
The economic landscape described above suggests that drivers of investment growth in EMDEs are
6 FDI is a key channel through which fixed investment is financed in EMDEs. For the EMDEs included in this Special Focus, FDI inflows dropped from about 3.3 percent of GDP in 2011 to 1.7 percent of GDP in 2017. The trend is similar when China is excluded. FDI inflows to EMDEs are estimated to have picked up moderately in 2018, although to a level below historical averages.
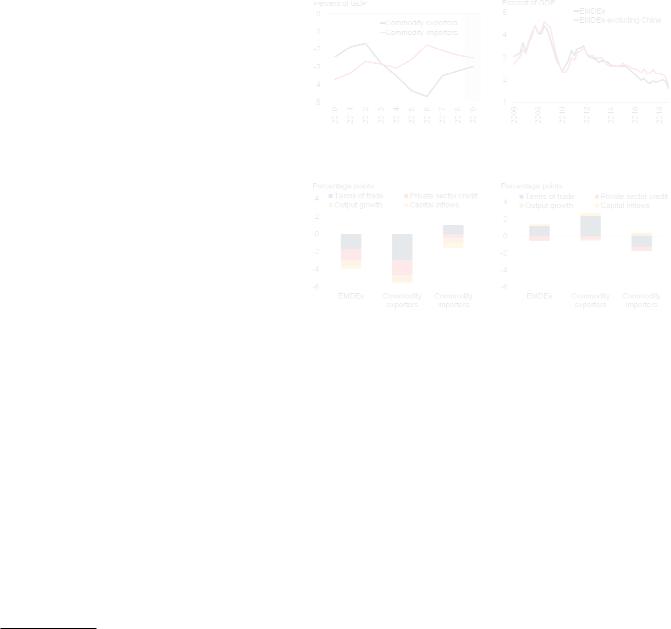
FIGURE SF1.1.3 Drivers of investment growth in EMDEs
Unfavorable external conditions and weak fiscal positions are expected to continue weighing on investment growth. Econometric estimates suggest that the pronounced investment growth slowdown in 2011-15 was, in almost equal measure, a reflection of weakening domestic output growth, a sharp deterioration in terms of trade for commodity exporters, and elevated private debt burdens. The subsequent moderate recovery largely reflected improving terms of trade for commodity exporters.
A. Fiscal balances in EMDEs |
B. FDI inflows to EMDEs |
C. Predicted change in EMDE |
D. Predicted change in EMDE |
investment growth, 2011-15 |
investment growth, 2015-18 |
Source: Haver Analytics, International Monetary Fund, International Country Risk Guide, World Bank.
A.Medians within groups. Shaded area indicates forecast. Sample includes 151 EMDEs.
B.Four-quarter (from t-3 to t) moving sum of FDI inflows, divided by annual GDP. Sample includes 54 EMDEs. Last observation is 2018Q4.
C.D. Unweighted averages for 56 EMDEs. Charts show change in contribution of each explanatory variable to predicted investment growth (defined as coefficient estimate times the realization of the variable), based on the regression specification in first column of Annex Table SF1.1.1.1. For presentational clarity, the charts show only the four explanatory variables with the largest contributions to the predicted change in investment growth.
Click here to download data and charts.
diverse. An econometric exercise using panel data for 57 EMDEs suggests that over the past two decades, higher EMDE investment growth was associated with macroeconomic factors including higher output growth, stronger capital inflows, high political stability, stronger terms of trade growth, and lower private sector debt burdens (Annex SF1.1.1, Annex Table SF1.1.1.1). The regression results suggest that the pronounced investment growth slowdown in 2011-15 was, in almost equal measure, a reflection of weakening domestic output growth, a sharp deterioration in terms of trade for commodity exporters, and elevated private debt burdens (Figure SF1.1.3.C).
vk.com/id446425943
60 |
S P EC I AL F O CU S 1 . 1 |
G L O BAL EC O NO M I C P ROS P EC T S | J U NE 2 0 1 9 |
|
|
|
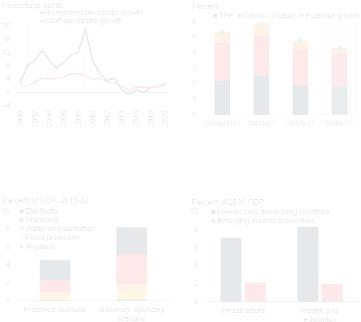
FIGURE SF1.1.4 Implications of weak investment growth in EMDEs
Decelerating investment growth during the post-crisis period has dampened the pace of convergence in per capita GDP between EMDEs and advanced economies and has slowed capital accumulation. Slowing capital accumulation, together with decelerating productivity and changing demographic conditions, has contributed to weaker potential growth in EMDEs. Continued weak investment growth will make filling large investment gaps in EMDEs more challenging.
A. Difference, EMDE and advanced- |
B. Contribution to potential growth, |
economy per capita growth |
EMDEs |
C. Spending needs in infrastructure |
D. Additional spending needs in |
sectors related to SDGs, World Bank |
sectors related to SDGs, IMF |
estimates |
estimates |
Source: Gaspar et al. (2019), Penn World Tables, Rozenberg and Fay (2019), UN Population Prospects, World Bank.
A.2010 investment-weighted averages. Investment refers to real gross fixed capital formation (public and private combined). Shaded areas indicate global recessions and slowdowns. Sample includes 65 EMDEs and 34 advanced economies (listed in Table SF.1.1.1).
B.GDP-weighted averages. TFP = total factor productivity. Shaded area indicates forecasts. Sample includes 50 EMDEs.
C.D. SDGs = Sustainable Development Goals.
C.Bars show average annual spending needs during 2015-30. “Preferred scenario” is constructed using ambitious goals and high spending efficiency, and “maximum spending scenario” using ambitious goals and low spending efficiency. Country sample includes lowand middle-income countries. Country sample includes lowand middle-income countries, as defined by the World Bank. The technical appendix of Rozenberg and Fay (2019) provides information on the lcountry sample.
D.For health and education, estimates are the difference between the share of GDP in spending consistent with high performance and the current level of spending as a share of GDP. For infrastructure, estimates show spending needed to close the infrastructure gap (roads, electricity, and water and sanitation) between 2019 and 2030. Gaspar et al. (2019) and IMF (2018) provide more information on the low-income developing country sample.
Click here to download data and charts.
Although commodity importers benefited from the decline in commodity prices, slowing capital inflows weighed on investment growth. The subsequent moderate recovery of investment growth in 2016-18 largely reflected improving terms of trade for commodity exporters (Figure SF1.1.3.D).
Implications and policy responses
Weak investment to weigh on potential growth
The prospect that weak investment growth will remain weak over the longer-term, on the heels of the sharp slowdown in the first half of this decade, raises fundamental concerns about the economic health of EMDEs. The earlier period of weak investment growth in EMDEs dampened the pace of convergence in per capita GDP with advanced economies (Figure SF1.1.4.A). Slowing capital accumulation also contributed to a deceleration in potential growth in EMDEs during the past five years, and capital is expected to continue detracting from potential growth during the next decade (Figure SF1.1.4.B; World Bank 2018). In addition, sluggish investment may have slowed potential growth indirectly, by eroding productivity gains embedded in new equipment and technologies, or in research and development.
Sustained investment pickup needed to meet the SDGs
Despite weak investment prospects, EMDEs have large investment needs. Recent analysis by the World Bank finds that achieving the SDGs related to infrastructure (electricity, transport, water supply and sanitation) and infrastructure-related climate change costs (flood protection, irrigation) in lowand middle-income countries will require an average of investment of $1.5–$2.7 trillion per year during 2015–30, or 4.5 to 8.2 percent of these countries’ combined GDP, depending on policy choices and the quality and quantity of infrastructure services (Figure SF1.1.4.C; Rozenberg and Fay 2019). The results highlight the importance of spending efficiency (i.e., the quality of spending) in achieving the infrastruc- ture-related SDGs. An IMF study of additional annual spending needed in sectors related to the SDGs (i.e., health, education, roads, electricity, and water and sanitation) arrives at estimate of approximately $2.5 trillion per year. This figure represents about 4 percent of emerging market economies’ 2030 GDP and more than 15 percent of low-income developing countries’ 2030 GDP