

Global Economic Prospects -World Bank_watermark
.pdfvk.com/id446425943
G L O BAL EC O NO M I C P ROS P EC T S | J U NE 2 0 1 9 |
C H AP T E R 1 |
21 |
|
|
|
Recent developments
EMDEs experienced broad-based weakness in manufacturing and exports at the start of the year, followed by some recent signs of stabilization (Figure 1.10.A). Activity in the services sector has remained resilient, reflecting continued growth in consumer spending.
Countries that experienced recent pressures related to varying degrees of financial market stress or idiosyncratic headwinds such as sanctions—a group that includes many commodity exporters— have faced a particularly sharp deceleration in activity this year (Figure 1.10.B).1 Private consumption growth appears stable, but it remains weak. Investment growth has moderated further as policy uncertainty persists, dampening imports (Figures 1.10.C and D). Economic slack remains elevated in many countries in this group.
In EMDEs that did not suffer recent pressures—a group that includes many commodity importers as well as the more diversified commodity exporters—growth is stable or moderating. Activity in these countries is being restrained by a combination of capacity constraints and softening external demand. As a result, exports and domestic demand are decelerating in tandem, with private consumption still resilient but investment growth remaining subdued (Special Focus 1.1). Import growth is slowing as well, partly due to the high import content of many capital goods. Economic slack in this group of countries is generally limited, and growth is near its potential in many cases (Figure 1.10.E).
Commodity-exporting EMDEs
Growth in commodity exporters has been weaker than expected and remains lackluster (Figure 1.10.F). Notwithstanding a modest recovery from its 2015 low, investment growth in commodity exporters remains weak and below its long-term
1 EMDEs under recent pressure include: a) countries that have had an increase in their J.P. Morgan EMBI credit spread of at least one standard deviation above the 2010-19 average at any time since April 2018 (Argentina, Brazil, Egypt, Gabon, Jordan, Lebanon, Mexico, Nigeria, South Africa, Sri Lanka, Tunisia, Turkey); or b) countries that have been subject to recent sanctions (Iran, Russia).
average. Notably, investment has deteriorated substantially in Argentina, where confidence and public spending retreated after severe financial stress, and Iran, where economic sanctions are weighing heavily on capital spending (Special Focus 1.1).
Slower-than-expected mining and oil production, combined with domestic policy uncertainties, has delayed the recovery in activity in some of the largest commodity exporters in Sub-Saharan Africa (Angola, Nigeria, South Africa; World Bank 2019b). Amid oil production cuts agreed by OPEC members and some key non-OPEC producers, growth in Saudi Arabia and Russia is moderating, while sanctions or political crises are expected to lead to sharp contractions in other oil exporters (Iran, Sudan; World Bank 2019c and 2019d).
Conditions are improving or stable elsewhere. Momentum in Brazil is gradually firming, although at a slower pace than previously expected. Rising commodity prices this year, along with improving business confidence, have helped lift investment and private consumption in some large economies. In several commodity exporters in East Asia and Pacific and Latin America, where earlier terms-of-trade shocks were less acute, growth is stable or only gradually decelerating from high levels (Chile, Malaysia, Peru; World Bank 2019e).
Commodity-importing EMDEs
Growth in commodity importers continues to decelerate, reflecting moderating external demand, increasing capacity constraints, and the lingering effects of financial stress in some countries—most notably Turkey. Among European EMDEs, slowing activity is particularly pronounced in economies with close ties to the Euro Area or facing ongoing domestic challenges (Belarus, Serbia, Turkey). In some countries, diminishing slack is putting a lid on growth (Hungary, Poland).
In Asia, activity is gradually decelerating but remains robust, with output in many countries expanding at a rate of 6-7 percent (Bangladesh, Cambodia, China, India, the Philippines,

vk.com/id446425943
22 |
C H AP T E R 1 |
G L O BAL EC O NO M I C P ROS P EC T S | J U NE 2 0 1 9 |
|
|
|
BOX 1.2 Short-term growth prospects for LICs
Growth in low-income countries (LICs) is projected to remain robust in 2019, at 5.4 percent. It is, however, more moderate than previously forecast, as weaker external demand has been accompanied by devastating extreme weather events and by a normalization of agricultural production in some large economies. Growth is projected to rise to 6.0 percent in 2020 and 6.1 percent in 2021, as domestic demand continues to strengthen and as increased oil and metals production supports activity among industrial-commodity exporters. These growth rates are, however, insufficient to markedly reduce poverty, particularly in LICs affected by fragility, conflict, and violence. Risks to the outlook include slower-than-expected growth in major trading partners, a resumption in the tightening of international financial conditions, adverse weather, and health crises.
Recent growth and prospects for 2019
Economic activity. Growth has remained robust in LICs, but lost some momentum. It is projected to decelerate to 5.4 percent in 2019—from 5.6 percent 2018—and is below previous forecasts (Figure 1.2.1.A). The downward revision reflects, in part, unexpectedly weak external demand from major trading partners, extreme weather events that dampened activity in several countries, as well as an earlier-than-expected normalization of agricultural production in some large LICs (Uganda, Tanzania) after strong recoveries from drought in previous years.
In non-resource-intensive LICs, growth has been supported by robust construction activity related to investment in infrastructure (Rwanda, Senegal) and rapidly growing services sectors amid continued urbanization (Ethiopia, Uganda). On the demand side, growth reflects strong household consumption supported by solid harvests (Benin, Burkina Faso) and expansionary monetary policy (The Gambia, Uganda), as well as sustained public investment (Comoros, The Gambia, Madagascar, Nepal, Uganda). Among some exporters of industrial commodities, growth has strengthened—despite weaker external demand—as oil and mining production has continued to benefit from investment in new capacity (Chad, Democratic Republic of Congo, Guinea).
However, several economies are facing severe strains. Output in Zimbabwe is expected to contract in 2019 with a sharp rise in inflation reducing real incomes and foreign exchange shortages constraining activity. The Southern and East African region was hit by two devastating tropical cyclones—Idai and Kenneth—in March and April 2019 that took a heavy human toll and caused severe damage to social and economic infrastructure in the Comoros, Malawi, Zimbabwe and, in particular, Mozambique. In this country, cyclone Idai in particular damaged a significant part of the port city of Beira and its surrounding area—affecting one of Mozambique’s key export terminals.
Note: This box was prepared by Rudi Steinbach. Research assistance was provided by Maria Hazel Macadangdang and Mengyi Li.
Progress in poverty reduction. Despite declines in poverty rates over the past decade, more than 40 percent of the population in LICs still live in extreme poverty, and continued progress in poverty reduction in these countries remains challenging. The poverty headcount is rising in economies affected by fragility, conflict, and violence. In countries where progress is being made in reducing poverty, economic growth is concentrated in urban areas, yielding little benefit to the rural poor.
External positions. Current account deficits are widening in almost half of LICs, with the average deficit expected to increase to 9.3 percent of GDP in 2019 from 8.4 percent in 2018 (Figure 1.2.1.B). In some LICs (Afghanistan, Burundi, Guinea, Guinea-Bissau), widening external deficits reflect weaker external demand and slower export growth. Elsewhere (Mozambique, Nepal, Niger, Uganda), imports of capital goods related to large infrastructure investment projects have been contributing to larger deficits. The deficit in Mozambique will rise further during the cyclones’ aftermath by weaker agricultural exports and with elevated imports of aid and reconstruction materials. In a few LICs (Benin, Ethiopia), current account deficits are narrowing despite weak external demand because past investments in export-oriented industries are supporting stronger export growth. While FDI inflows have been largely sufficient to finance current accounts deficits— especially in countries with large infrastructure investment programs—they have weakened somewhat amid last year’s tighter external financing environment. This has contributed to a decline in LICs’ international reserves relative to their imports. They now stand further below the commonly recommended minimum of three months’ cover (Figure 1.2.1.C).
Fiscal positions. Fiscal deficits are gradually narrowing in LICs, with the average deficit expected to decline from 4 percent of GDP in 2018 to 3.4 percent in 2019 (Figure 1.2.1.D). Narrower deficits among many fast-growing LICs reflect fiscal consolidation (Benin, Ethiopia, Togo), as well as greater public spending efficiency and improved revenue collections (Benin, Togo). Among industrial- commodity-exporting LICs, rising government revenues related to increased oil and metals production (Chad),
vk.com/id446425943
G L O BAL EC O NO M I C P ROS P EC T S | J U NE 2 0 1 9 |
C H AP T E R 1 |
23 |
|
|
|
BOX 1.2 Short-term growth prospects for LICs (CONTINUED)
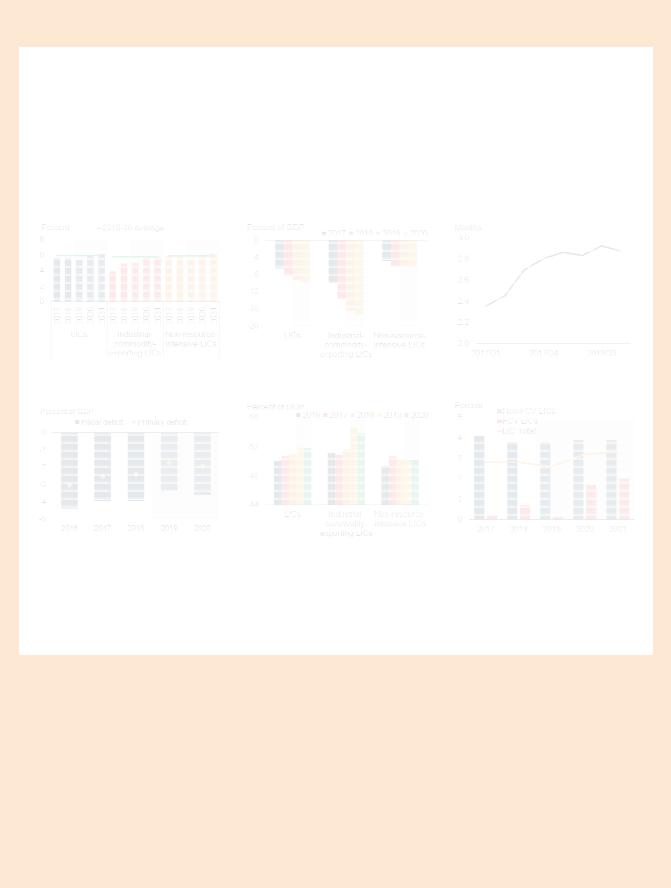
FIGURE 1.2.1 Short-term economic prospects for LICs
Growth in LICs is projected to remain robust in 2019, at 5.4 percent, albeit more moderate than previously forecast. It is expected to rise to 6.0 percent in 2020 and 6.1 percent in 2021. Growth is being spurred by new oil and mining production capacity coming on stream among some large industrial-commodity exporters; public investment and strong agriculture performances should support growth in non-resource-intensive LICs. Per capita income growth will not be sufficient to markedly reduce poverty. Current account deficits are widening, amid weaker external demand and strong capital goods imports, while financing of these deficits has been under pressure. Fiscal deficits remain large, contributing to elevated government debts.
A. GDP growth |
B. Current account deficits |
C. International reserves in months of |
|
|
imports |
D. Fiscal deficits |
E. Government debt |
F. Per capita GDP growth |
Source: Haver Analytics; International Monetary Fund, World Economic Outlook; World Bank; World Development Indicators.
Note: LICs = low-income countries. Industrial-commodity exporting countries include energyand metal-exporting economies, and the sample includes 8 countries. Non-resource-intensive countries include agricultural-exporting countries and commodity importers, and the sample includes 22 countries.
A. Aggregate growth rates calculated using 2010 U.S. dollar GDP weights. B.D.E. Simple averages of country groups.
C. Simple averages. Sample includes 23 countries.
F. FCV = fragility, conflict, and violence. FCV and Non-FCV LICs samples each include 14 countries. Weighted averages of country groups. Click here to download data and charts.
greater tax revenue mobilization (Sierra Leone), and fiscal consolidation (Tajikistan) are improving fiscal balances. However, in some LICs, fiscal deficits are widening, amid weak economic growth that weighs on government revenues (Liberia), election-related fiscal pressures (Mozambique), and scaled up public consumption and investment by a new government (Democratic Republic of Congo).
After increasing sharply in recent years, government debt ratios are elevated among LICs, with debt expected to reach 52 percent of GDP, on average, in 2019—a 15 percentage point increase since 2013 (Figure 1.2.1.E).
However, in some LICs, increased fiscal discipline and more effective revenue mobilization have begun to stabilize debt ratios. Among non-resource-intensive LICs, indebtedness has remained broadly unchanged, or even declined somewhat, in Benin, the Comoros, Ethiopia, Haiti, and The Gambia. Similarly, increases in debt appear to have come to a halt in some industrial-commodity exporters, where revenues have been lifted by increased resource production (Chad, Democratic Republic of Congo). Nevertheless, debt continues to rise in many countries, driven by strong public investment (Rwanda, Tanzania, Uganda) and larger current spending, in some cases related to elections (Burundi, Mozambique).

vk.com/id446425943
24 |
C H AP T E R 1 |
G L O BAL EC O NO M I C P ROS P EC T S | J U NE 2 0 1 9 |
|
|
|
BOX 1.2 Short-term growth prospects for LICs (CONTINUED)
In addition to elevated levels of debt, the composition of government debt has changed in recent years, as nonconcessional and foreign-currency-denominated borrowing has increased amid greater access to international capital markets and increased non-resident participation in domestic debt markets (World Bank 2019a, 2019b).
While international financial conditions have eased in recent months, they are still tighter than in 2017, keeping debt-servicing costs elevated and making fiscal consolidation in countries with large debt burdens more challenging.
Outlook for 2020-21
Economic growth. Growth in LICs is expected to strengthen to 6.0 percent in 2020 and 6.1 percent in 2021. This projected pickup assumes that the recovery among oil and metals exporters will be bolstered by higher production as new capacity comes on stream, while domestic demand continues to strengthen (Chad, Democratic Republic of Congo, Guinea). In the Democratic Republic of Congo—the largest industrial commodity-exporting LIC and the country estimated to have the most cobalt reserves in the world—mining production accounts for more than 80 percent of exports and 25 percent of government revenues. Mining production is expected to increase by around 10 percent a year over the forecast horizon, driven by strong growth in cobalt demand from the expanding global electric vehicle industry (Alves Dias et al. 2018; Campbell 2019).
Growth is also expected to remain robust in several non- resource-intensive LICs. In particularly fast-growing LICs (Rwanda, Uganda, and Tanzania), expansions will be supported by public investment in infrastructure and continued strong agricultural growth. Similarly, agricultural production in Malawi is assumed to recover as the Fall Armyworm infestation of recent years recedes. Reconstruction efforts in the cyclone-affected countries in Southern and East Africa—the Comoros, Malawi, Mozambique, and Zimbabwe—are also expected to support activity over the next two years. In Afghanistan, greater political stability following an assumed peaceful transition after the upcoming election in July is expected to improve the business environment and deliver a growth spurt. Improved political stability is also expected to support the outlook for Guinea-Bissau and Zimbabwe. While growth in Ethiopia is expected to remain strong, it will be held back by a tighter fiscal stance, as the government continues its efforts to stabilize public debt.
Prospects for per capita income convergence. The growth recovery will help lift per capita GDP growth in LICs from 2.6 percent in 2019 to 3.2 percent in 2020 and 3.3 percent in 2021 (Figure 1.2.1.F). However, among LICs affected by fragility, conflict, and violence—which host about 56 percent of the LIC poor and 43 percent of the LIC population—prospects for convergence to middleincome country income levels are limited, as per capita income growth is expected to be significantly lower, averaging 1.9 percent in 2020-21. For these economies, growth is thus expected to remain insufficient to significantly reduce poverty rates, and the number of people in LICs living in extreme poverty (below the international poverty line for income of $1.90 per day) is expected to remain elevated.
Risks. Risks to the economic outlook for LICs are predominantly on the downside. Slower-than-expected growth in major economies—China, the United States, and the Euro Area—could set back LIC growth. These three countries account for 31 percent of LIC exports, 41 percent of LIC FDI, and 23 percent of remittances to LICs, leaving LICs highly exposed to developments in their economies. A slowdown in China would hit industrial-commodity-exporting LICs particularly hard, as China accounts for more than one-half of global metals demand (World Bank 2016 and 2018b).
Unexpected shifts in investor sentiment, or in economic developments or policies in major economies, could lead to a re-tightening of financial conditions. The impact would be amplified in LICs with larger debt burdens, weaker macroeconomic fundamentals, or elevated political risks. The disruptions to capital inflows and sharp currency depreciations that could result from a sudden deterioration in market sentiment would raise debtservicing costs further—especially on debt denominated in foreign currency—and undermine fiscal consolidation efforts while constraining critical poverty-reducing expenditures.
Many LICs are vulnerable to weather-related shocks as climate change increases the frequency of extreme weather events such as tropical storms, floods, heatwaves, and severe and prolonged drought episodes. Crop damage events caused by a greater incidence of insect pests (e.g., the Fall Armyworm) could become more severe as warmer conditions fuel their population growth and metabolic rates (Deutsch et al 2018). In the average LIC, agriculture accounts for 29 percent of GDP. LICs that are most highly dependent on agricultural activity are most at risk

vk.com/id446425943
G L O BAL EC O NO M I C P ROS P EC T S | J U NE 2 0 1 9 |
C H AP T E R 1 |
25 |
|
|
|
BOX 1.2 Short-term growth prospects for LICs (CONTINUED)
TABLE 1.2.1 Low-income country forecastsa |
|
|
|
|
Percentage point differences |
|||||
(Real GDP growth at market prices in percent, unless indicated otherwise) |
|
|
|
from January 2019 projections |
||||||
|
|
|
|
|
|
|
|
|
|
|
|
2016 |
2017 |
2018e |
2019f |
2020f |
2021f |
|
2019e |
2020f |
2021f |
|
|
|
|
|
|
|
|
|
|
|
Low Income Country, GDPb |
4.8 |
5.6 |
5.6 |
5.4 |
6.0 |
6.1 |
|
-0.5 |
-0.2 |
-0.2 |
Afghanistan |
2.3 |
2.7 |
1.0 |
2.4 |
3.2 |
3.6 |
|
-0.3 |
0.0 |
0.4 |
Benin |
4.0 |
5.8 |
6.5 |
6.5 |
6.5 |
6.5 |
|
0.3 |
0.0 |
-0.1 |
Burkina Faso |
5.9 |
6.3 |
6.8 |
6.0 |
6.0 |
6.0 |
|
0.0 |
0.0 |
0.0 |
Burundi |
-0.6 |
0.5 |
1.6 |
1.8 |
2.1 |
2.0 |
|
-0.5 |
-0.4 |
-0.8 |
Chad |
-6.3 |
-3.0 |
2.6 |
3.4 |
5.6 |
4.8 |
|
-1.2 |
-0.5 |
-0.1 |
Comoros |
2.2 |
2.7 |
2.8 |
3.1 |
3.2 |
3.2 |
|
0.0 |
0.1 |
0.1 |
Congo, Dem. Rep. |
2.4 |
3.7 |
5.8 |
5.9 |
6.5 |
6.8 |
|
1.3 |
1.0 |
0.9 |
Ethiopiac |
7.6 |
10.2 |
7.9 |
7.9 |
8.2 |
8.2 |
|
-0.9 |
-0.7 |
-0.7 |
Gambia, The |
0.4 |
4.6 |
6.6 |
5.4 |
5.2 |
5.0 |
|
0.0 |
0.0 |
-0.2 |
Guinea |
10.5 |
10.6 |
5.8 |
5.9 |
6.0 |
6.0 |
|
0.0 |
0.0 |
0.0 |
Guinea-Bissau |
6.3 |
5.9 |
3.8 |
4.3 |
4.8 |
5.5 |
|
0.1 |
0.4 |
1.0 |
Haitic |
1.5 |
1.2 |
1.5 |
0.4 |
1.6 |
1.3 |
|
-1.9 |
-0.8 |
-1.2 |
Liberia |
-1.6 |
2.5 |
1.2 |
0.4 |
1.6 |
1.3 |
|
-4.1 |
-3.2 |
-3.5 |
Madagascar |
4.2 |
4.3 |
5.2 |
5.2 |
5.3 |
5.1 |
|
-0.2 |
0.0 |
-0.2 |
Malawi |
2.5 |
4.0 |
3.5 |
4.5 |
4.7 |
5.1 |
|
0.2 |
-0.6 |
-0.4 |
Mali |
5.8 |
5.3 |
4.9 |
5.0 |
4.9 |
4.8 |
|
0.0 |
0.0 |
0.0 |
Mozambique |
3.8 |
3.7 |
3.3 |
2.0 |
3.5 |
4.2 |
|
-1.5 |
-0.6 |
0.1 |
Nepalc |
0.6 |
8.2 |
6.7 |
7.1 |
6.4 |
6.5 |
|
1.2 |
0.4 |
0.5 |
Niger |
4.9 |
4.9 |
5.2 |
6.5 |
6.0 |
5.6 |
|
0.0 |
0.0 |
0.0 |
Rwanda |
6.0 |
6.1 |
8.6 |
7.8 |
8.0 |
7.5 |
|
0.0 |
0.0 |
-0.5 |
Senegal |
6.2 |
7.2 |
6.8 |
6.8 |
7.0 |
7.0 |
|
0.2 |
0.2 |
0.1 |
Sierra Leone |
6.4 |
3.8 |
3.7 |
5.4 |
5.4 |
5.2 |
|
0.3 |
-0.9 |
-1.1 |
Tajikistan |
6.9 |
7.1 |
7.3 |
6.0 |
6.0 |
6.0 |
|
0.0 |
0.0 |
0.0 |
Tanzania |
6.9 |
6.8 |
6.0 |
5.4 |
5.7 |
6.1 |
|
-1.4 |
-1.3 |
-0.9 |
Togo |
5.2 |
4.3 |
4.9 |
5.0 |
5.2 |
5.1 |
|
0.2 |
0.1 |
0.0 |
Ugandac |
4.6 |
3.9 |
5.9 |
6.1 |
6.5 |
5.8 |
|
0.1 |
0.1 |
-0.7 |
Zimbabwe |
0.8 |
4.7 |
3.5 |
-3.1 |
3.5 |
4.9 |
|
-6.8 |
-0.5 |
0.9 |
|
|
|
|
|
|
|
|
|
|
|
Source: World Bank.
World Bank forecasts are frequently updated based on new information and changing (global) circumstances. Consequently, projections presented here may differ from those contained in other World Bank documents, even if basic assessments of countries’ prospects do not significantly differ at any given moment in time.
a.Central African Republic, Democratic People’s Republic of Korea, Somalia, Syria, and Yemen are not forecast due to data limitations.
b.GDP at market prices and expenditure components are measured in constant 2010 U.S. dollars.
c.GDP growth based on fiscal year data. For Nepal, the year 2019 refers to FY2018/19.
Click here to download data.
of increases in poverty rates as a result of these factors (World Bank 2019a).
Health crises remain a constant concern among LICs. The latest Ebola epidemic in the northeastern Democratic
Republic of Congo has been ongoing since mid-2018 and could weigh heavily on activity in the country and the subregion, especially if it were to spread to major urban centers and to neighboring countries (Burundi, Rwanda, South Sudan, Tanzania, Uganda).
vk.com/id446425943
26 |
C H AP T E R 1 |
G L O BAL EC O NO M I C P ROS P EC T S | J U NE 2 0 1 9 |
|
|
|
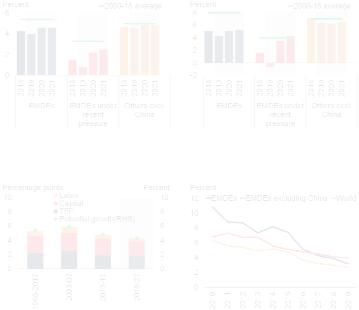
FIGURE 1.11 EMDE growth prospects
Following a further deceleration in 2019, growth in EMDEs is expected to recover in 2020-21, as headwinds are assumed to dissipate in a number of key economies. However, investment growth will remain subdued. In the longer run, productivity and demographic trends point to weakening growth potential across EMDEs, further weighing on investment prospects.
A. Growth |
B. Investment growth |
|
|
C. Contribution to potential growth |
D. 10-year ahead investment growth |
|
forecasts |
Source: Consensus Economics, J.P. Morgan, Penn World Tables, World Bank.
A.-C. Aggregate growth rates are calculated using constant 2010 U.S. dollar GDP weights. Shaded areas indicate forecasts.
A.B. EMDEs under recent pressure include: a) countries that have had an increase in their J.P. Morgan EMBI credit spread of at least one standard deviation above the 2010-19 average at any time since April 2018 (Argentina, Brazil, Egypt, Gabon, Jordan, Lebanon, Mexico, Nigeria, South Africa, Sri Lanka, Tunisia, Turkey); or b) countries that have been subject to recent sanctions (Iran, Russia).
C.TFP = total factor productivity. Sample includes 50 EMDEs. Potential growth estimates are based on production function approach. For further details on potential growth estimates, refer to the January 2018 edition of the Global Economic Prospects report.
D.10-year-ahead forecasts surveyed in indicated year. Constant 2010 U.S. dollar investmentweighted averages. Sample includes 23 advanced economies and 20 EMDEs (indicated by † in Table SF1.1.1). For 2010-18, the average of four projections during the year is shown; for 2019, the
average of two projections during the first half of the year is shown. Click here to download data and charts.
Vietnam), despite moderating export growth. In India, growth remains solid, supported by improved confidence, slowing inflation, and still robust investment (World Bank 2019e, 2019f). Other economies continue to benefit from panAsian infrastructure investments and expanding intra-regional trade (Bhutan, Cambodia, Vietnam). Activity is weaker in countries where policy uncertainty continues to discourage private investment (Mexico, Sri Lanka), and in countries that have tightened fiscal and monetary policies to reduce fiscal and current account deficits (Haiti, Pakistan, Tunisia).
Low-income countries
Growth remains robust in low-income countries (LICs; Box 1.2; Special Focus 2.1); however, it has lost some momentum amid weaker external demand from major trading partners and extreme weather events. Among non-resource-intensive countries, rising consumption growth and sustained public investment in infrastructure are supporting activity, offset by a modest slowdown in agricultural output (Uganda, Tanzania). Growth among exporters of industrial commodities has generally firmed due to investment in new resource production capacity (Chad, Democratic Republic of Congo, Guinea). In contrast, the Comoros, Malawi, Zimbabwe, and particularly Mozambique are facing severe strains after two devastating tropical cyclones— Idai and Kenneth—hit Southern and East Africa in March and April, taking a heavy human toll and causing severe economic damage. Current account deficits across LICs have widened, on average, due to strong capital goods imports related to public investment projects and slower export growth among some metals exporters (Guinea, Nepal, Niger). Strong public investment spending has, in part, kept fiscal deficits elevated; however, they have narrowed in some countries amid continued fiscal consolidation and improved revenue collection (Benin, Ethiopia, Sierra Leone).
Outlook
Growth outlook
EMDE growth is expected to slow from 4.3 percent in 2018 to 4 percent this year—0.3 percentage point lower than previously projected, with notable heterogeneity across regions (Box 1.3; Chapter 2). Almost 40 percent of EMDEs are expected to decelerate in 2019 relative to last year. Moreover, forecasts for 2019 growth have been downgraded for more than 40 percent of countries. For many countries, a substantial part of the forecast downgrade is attributable to continued weakness in investment, which remains well below historical averages.
Growth in EMDEs facing the lingering impact of earlier financial stress (Argentina, Brazil, Nigeria, South Africa, Turkey) and idiosyncratic head-

vk.com/id446425943
G L O BAL EC O NO M I C P ROS P EC T S | J U NE 2 0 1 9 |
C H AP T E R 1 |
27 |
|
|
|
BOX 1.3 Regional perspectives: Recent developments and outlook
Growth in all EMDE regions has been weaker than expected amid softening external demand and, in some countries, persistent domestic headwinds. Activity in the East Asia and Pacific and South Asia regions remains buoyant, while growth in other EMDE regions is expected to recover in 2020-21.
East Asia and Pacific. Growth in the region is projected to slow from 6.3 percent in 2018 to 5.9 percent in 2019-20, and to ease further to 5.8 percent in 2021. This will mark the first time since the 1997-98 Asian financial crisis that EAP growth dropped below 6 percent. In China, growth is expected to decelerate from 6.6 percent in 2018 to 6.2 percent in 2019, and gradually decline to 6.0 percent by 2021, reflecting softening manufacturing activity and trade amid domestic and external headwinds. In the rest of the region growth is also expected to moderate to 5.1 percent in 2019, before rebounding modestly to 5.2 percent in 2020-21, as global trade stabilizes. Risks to regional growth remain tilted to the downside and have intensified with the re-escalation of trade tensions. They include a sharper-than-expected slowdown in major economies, including China; an intensification of global trade tensions; and an abrupt change in global financing conditions and investor sentiment.
Europe and Central Asia. Growth in the region is projected to fall sharply from 3.1 percent in 2018 to 1.6 percent in 2019. The slowdown partly reflects a sharp weakening of activity in Turkey, which fell into recession in the wake of acute financial market stress in 2018. Regional growth is projected to pick up in 2020-21 as Turkey recovers and Russian strengthens. Excluding these economies, the rest of the region is expected to moderate. In particular, growth in Central Europe is projected to soften as economies grapple with the slowdown in the Euro Area and binding domestic capacity constraints. Key external risks to the region include spillovers from weaker- than-expected activity in the Euro Area and from escalation of global policy uncertainty, particularly in relation to trade tensions and the United Kingdom’s exit from the European Union. Renewed financial pressures in Turkey could also disrupt regional growth.
Latin America and the Caribbean. Growth in the region is expected to be subdued in 2019, at 1.7 percent, reflecting challenging conditions in several of the largest economies. Gradually building momentum in Brazil and a recovery in Argentina are projected to contribute to a pickup in
Note: This box was prepared by Patrick Kirby, with contributions from Rudi Steinbach, Temel Taskin, Ekaterine Vashakmadze, Dana Vorisek, Collette Wheeler, and Lei Ye. Research assistance was provided by Hazel Macadangdang.
FIGURE 1.3.1 Regional growth
Growth in all EMDE regions has been weaker than expected, hindered by a combination of policy uncertainties, weak external demand, and the lingering impact of past financial stress. Activity is expected to recover in 2020-21.
A. Regional growth, weighted average
B. Regional growth, unweighted average
Source: World Bank.
A.B. Bars denote latest forecast; diamonds correspond to January 2019 forecasts in the Global Economic Prospects report. Average for 1990-2018 is constructed depending on data availability. For Europe and Central Asia, the long-term average uses data for 1995-2018 to exclude the immediate aftermath of the collapse of the Soviet Union.
A.Aggregate growth rates calculated using constant 2010 U.S. dollar GDP weights. Since largest economies account for about 50 percent of GDP in some regions, weighted averages predominantly reflect the developments in the largest economies in each region.
B.Unweighted average regional growth is used to ensure broad reflection of regional trends across all countries in the region.
Click here to download data and charts.

vk.com/id446425943
28 |
C H AP T E R 1 |
G L O BAL EC O NO M I C P ROS P EC T S | J U NE 2 0 1 9 |
|
|
|
BOX 1.3 Regional perspectives: Recent developments and outlook (CONTINUED)
regional growth to 2.5 percent in 2020 and 2.7 percent in 2021. Financial conditions in the region have eased markedly since early 2019. Despite soft global trade, regional export growth has picked up, boosted by trade diversion in response to bilateral tariffs by the United States and China, and by solid growth in the United States. As these effects wane and global trade decelerates further, export growth in the region is projected to slow. Risks to the growth outlook remain tilted to the downside. Sharper-than-projected slowdowns in the United States and China could have negative spillovers on regional growth through trade, financial, and commodity market channels. Adverse market responses to weak fiscal conditions and disruptions from natural disasters are other important risks. The crisis in Venezuela also presents risks.
Middle East and North Africa. Growth in the region is projected to remain subdued in 2019, at 1.3 percent. Activity in oil exporters has slowed due to weak oil sector output and the effects of intensified U.S. sanctions on Iran, despite an easing of the fiscal stance and positive prospects for non-oil sectors in some countries. Many oil importers continue to benefit from business climate reforms and resilient tourism activity. Regional growth is projected to pick up to around 3 percent in 2020-21, supported by capital investment and policy reforms. Risks to the outlook are tilted to the downside, including geopolitical tensions, reform setbacks, and a further escalation of global trade tensions.
South Asia. The region continued to enjoy solid economic activity in 2018, posting 7 percent GDP growth due to robust domestic demand. Pakistan was a notable exception, with a broad-based weakening of domestic demand against the backdrop of tightening policies aimed at addressing the country’s macroeconomic imbalances. Regional growth is projected to remain close to 7 percent over the forecast horizon, as it benefits from strong private consumption and investment. The main risks to the outlook include a re-escalation of political uncertainty and regional tensions, financial sector weakness due to nonperforming assets, fiscal challenges, and a sharper- than-expected weakening of growth in major economies.
Sub-Saharan Africa. The recovery in the region has disappointed, with weakening external demand, supply disruptions, and elevated policy uncertainty weighing on activity in major economies. Growth in the region is projected to pick up from 2.5 percent in 2018 to 2.9 percent this year and an average of 3.4 percent in 2020-21, as domestic demand gathers pace and oil production recovers in large exporting economies. However, this expected recovery is significantly slower than previously projected, reflecting persistent headwinds in major economies, and it is largely insufficient to make progress in poverty reduction. Downside risks to the outlook include weaker-than-expected external demand, lower commodity prices, renewed stress in global financial markets, fiscal slippages, political uncertainty, armed conflicts, and adverse weather conditions.
winds such as sanctions (Iran, Russia) is expected to remain subdued this year (Figure 1.11.A). Projections for 2019 were revised down in most of these countries, with particularly sizable downgrades for Brazil, Mexico, and Turkey. Forecasts for countries facing oil production cuts this year (Bahrain, Russia, Saudi Arabia, and United Arab Emirates) were also downgraded. In contrast, growth in EMDEs that did not face recent pressures is expected to remain solid.
EMDE growth is projected to firm to 4.6 percent in 2020-21, in line with previous forecasts. This assumes a waning drag from earlier financial pressures in some large countries, that global financing conditions remain generally benign, and that global trade growth stabilizes. In Argentina
and Turkey, the impact of severe financial market turmoil is expected to diminish over the forecast horizon as investor confidence returns (World Bank 2019c). In Brazil, Russia, and South Africa, headwinds associated with elevated policy uncertainty are also expected to moderate. In Iran, the impact of U.S. sanctions is projected to peak this year, with growth resuming in 2020 (World Bank 2019d).
In EMDEs that did not suffer recent pressures, growth is expected to remain stable in 2020-21. Resilient domestic demand and still favorable global financing conditions should largely offset the negative impact of decelerating exports. However, there are some large divergences. Growth in India and Indonesia is expected to

vk.com/id446425943
G L O BAL EC O NO M I C P ROS P EC T S | J U NE 2 0 1 9 |
C H AP T E R 1 |
29 |
|
|
|
remain steady and above EMDE averages, while capacity constraints and the projected deceleration in the Euro Area will slow activity in Poland and Hungary.
EMDE investment growth is expected to decelerate in 2019, primarily because of contractions in countries affected by recent pressures (Figure 1.11.B). While investment growth is projected to recover somewhat in 2020-21, it is expected to remain below long-term averages, reflecting elevated debt levels, limited fiscal space, lack of clarity about policy direction, and inadequate business climates (Special Focus 1.1).
Growth in LICs is expected to recover to an average of 6.1 percent in 2020-21, from 5.4 percent in 2019 (Box 1.2). In non-resource- intensive countries, the pickup assumes stronger private investment amid improving business environments (Rwanda, Uganda), continued robust public infrastructure spending, solid agricultural output (The Gambia, Malawi, Tanzania), and greater political stability (Afghanistan, Guinea-Bissau, Zimbabwe). Among exporters of industrial commodities, the recovery is predicated on rising oil and mining production amid continued investment in new capacity (Chad, Democratic Republic of the Congo, Guinea), and on stronger domestic demand. Despite the pickup in growth, LICs’ prospects for progression to middle-income status will be challenged by a greater incidence of fragility; a heavy reliance on agriculture, which is vulnerable to climate change and extreme weather events; and the fact that many are land-locked, limiting the scope of involvement in global trade (Special Focus 2.1).
Over the medium term, challenges associated with demographics, productivity, and investment point to weakening growth potential in EMDEs (Figure 1.11.C; World Bank 2018c). Slowing labor force growth will be most pronounced in key economies in East Asia and Pacific and in Europe and Central Asia, while it is projected to be broadly neutral for growth in Latin America and the Caribbean, in the Middle East and North Africa, and in South Asia, and to remain supportive in Sub-Saharan Africa. Many of the drivers of the productivity
slowdown seen across EMDEs in the post-crisis period are likely to persist, notwithstanding the promise of new technologies. Over the next decade, investment is expected to remain subdued, which will exacerbate the decline in potential growth directly through slower capital deepening and indirectly through its dampening impact on productivity (Figure 1.11.D).
Per capita income growth and poverty
Sustained per capita income growth has historically been the main driver of global poverty reduction (World Bank 2018f). Softening growth in EMDEs since the global financial crisis has been associated with a slower pace of global poverty reduction, as well as an increased concentration of extreme poverty in Sub-Saharan Africa. While extreme poverty has fallen substantially in some regions, such as East Asia and Pacific, addressing broader measures of poverty still remains an acute challenge (World Bank 2019f).
Near-term growth prospects will be insufficient to result in significant progress toward global poverty alleviation, with per capita income growth this year remaining below its long-term average in more than half of EMDEs. In about a third of EMDEs, per capita growth in 2019 will be below that of advanced economies, resulting in widening income gaps.2 These EMDEs are mainly in commodity-reliant regions such as Sub-Saharan Africa, Latin America and the Caribbean, and the Middle East and North Africa (Figure 1.12.A).
There are significant differences within regions, however. In the case of Sub-Saharan Africa, per capita growth is weak in the largest three economies (Nigeria, South Africa, and Angola), in some metals exporters, and in countries affected by fragility, conflict, and violence. In contrast, some non-resource-intensive countries in the region are experiencing solid per capita income growth rates (Côte d’Ivoire, Ethiopia, Rwanda, Senegal).
2 Median per capita income growth is also expected to be weak, as the correlation between median household income growth and per capita GDP growth is 0.75 for those countries for which household income data are available.
vk.com/id446425943
30 |
C H AP T E R 1 |
G L O BAL EC O NO M I C P ROS P EC T S | J U NE 2 0 1 9 |
|
|
|
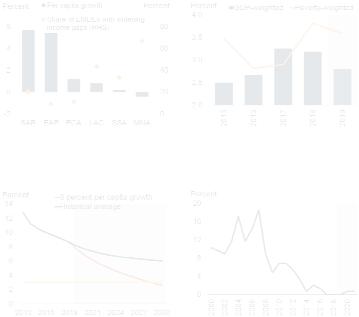
FIGURE 1.12 EMDE per capita income growth and poverty
Weakening growth this year suggests that, in many EMDEs, per capita income gaps with advanced economies will continue to widen. Per capita income in countries with the largest number of extreme poor is expected to grow at a somewhat faster clip than other EMDEs, but at less than half the pace needed to reduce global extreme poverty to 3 percent by 2030.
A. GDP per capita growth and share of B. Per capita growth in EMDEs EMDEs with widening income gaps,
2019
C. Extreme poverty scenarios |
D. Share of EMDEs with per capita |
|
growth at or above 8 percent per |
|
annum |
Source: World Bank.
A. EAP = East Asia and Pacific, ECA = Europe and Central Asia, LAC = Latin America and the Caribbean, MNA = Middle East and North Africa, SAR = South Asia, SSA = Sub-Saharan Africa. Aggregate growth rates calculated using constant 2010 U.S. dollar GDP weights. Countries with a widening income gap are those with per capita GDP growth of at least 0.1 percentage point lower than advanced-economy per capita GDP growth.
B.-D. Shaded areas indicate forecasts.
B.Aggregate growth rates calculated using constant 2010 U.S. dollar GDP weights (“GDP-weighted”) or number of extreme poor living at or below $1.90 a day (“poverty-weighted”). The poverty-weighted estimate of per capita GDP growth excludes countries for which poverty head counts are not available. Sample includes 104 EMDEs for poverty-weighted and 117 EMDEs for GDP-weighted per capita growth.
C.Data for 2016-18 are estimates. The blue line shows the poverty rate assuming that income per capita of the bottom 40 percent of the income distribution grows at the historical average from 2005-15; the red line shows this but assuming a rate of 8 percent per year. The yellow horizontal line indicates the 3 percent extreme poverty rate goal set for 2030. See World Bank (2018f) for details.
D.Share of EMDEs that reach or exceed 8 percent GDP per capita growth. Sample includes
146 EMDEs.
Click here to download data and charts.
Aggregate per capita income in countries with the largest numbers of extreme poor is expected to grow at a somewhat faster clip than that of other EMDEs over the forecast horizon (Figure 1.12.B). That pace will nevertheless remain well below what is needed to achieve poverty alleviation goals. To reduce global extreme poverty to 3 percent by 2030, income per capita growth in countries where extreme poverty concentrates would need to
be sustained at about 8 percent per year (Special Focus 2.1; Figure 1.12.C). This is more than twice the rates projected over the next two years—and only a small and declining proportion of EMDEs have achieved such growth in any given year since the global financial crisis (Figure 1.12.D).
Risks to the outlook
Risks continue to be tilted to the downside. A further escalation in trade tensions and rising policy uncertainties could weigh on investment and contribute to financial market volatility. New financial stress episodes in EMDEs could be amplified by rising debt levels, corporate sector vulnerabilities, and increasing refinancing pressures. Sharper-than-expected slowdowns in major economies could have substantial spillover effects for EMDEs. These risks are compounded in some regions by the possibility of intensifying conflict and by the increased frequency of extreme weather events.
Baseline forecasts point to a deceleration of global growth from 3 percent in 2018 to 2.6 percent this year—0.3 percentage point below previous projections, amid a more broad-based slowdown in manufacturing activity and trade than previously anticipated. More accommodative monetary policy stances in major advanced economies, new fiscal stimulus measures in China, and the diminishing effect of financial pressures in some major EMDEs are assumed to help stabilize activity and prevent a further deterioration in global growth. On balance, global growth is predicted to edge up to a slightly weaker-than-expected 2.7 percent in 2020 and to 2.8 percent in 2021.
There is considerable uncertainty surrounding global growth projections, and risks to the global outlook continue to be firmly tilted to the downside (Figure 1.13.A). Intensifying policy and political uncertainty, including a further escalation of trade disputes between major economies, could weigh on sentiment and dampen investment and trade. Relative to the baseline assumption of no additional escalation going forward, a renewed deterioration in trade relations could therefore result in substantially lower global growth. The potentially large adverse effects associated with