

Global Economic Prospects -World Bank_watermark
.pdfvk.com/id446425943
 FOCUS 2.1
in Low-Income Countries:
Evolution, Prospects, and Policies
vk.com/id446425943

vk.com/id446425943
G L O BAL EC O NO M I C P ROS P EC T S | J U NE 2 0 1 9 |
S P EC I AL F O CU S 2 . 1 |
133 |
|
|
|
Growth in Low-Income Countries:
Evolution, Prospects, and Policies
There are currently 34 countries classified as low-income, about half the number in 2001. Rapid growth in low-income countries from 2001-18 allowed many to progress to middle-income status, supported by a pre-crisis commodity price boom, the MDRI and HIPC debt relief initiatives, increased investment in human and physical capital, improved economic policy frameworks, and recoveries from the deep recessions in transition economies during the 1990s. However, the prospects for today’s LICs appear much more challenging. Compared to the LICs in 2001 that became middle-income countries, today’s LICs are further below the middle-income threshold and more often fragile than were LICs in 2001. Their heavy reliance on agriculture makes them vulnerable to climate change and extreme weather events, and their scope to boost external trade is limited by geography. Coordinated and multi-pronged policy efforts are required to address these challenges.
Introduction
Since 2001, the number of low-income countries (LICs) has almost halved, to 34 in 2019 from 64 in 2001 (Figure SF2.1.1.A).1 During this period, their number rose to a peak of 66 in 2003 before falling to a trough of 31 in 2016. Since then, however, the decline has stalled, if not reversed, with four countries—Senegal, the Syrian Arab Republic, Tajikistan, and the Republic of Yemen—relapsing into LIC status amid armed conflict and terms of trade shocks, while only one country (Cambodia) reached middle-income status. The countries classified as LICs in 2001 that have converged to middle-income (MIC) status experienced average growth of 5.8 percent a year during 2001-2018—about one-half faster than non-LIC EMDEs over the same period and one-quarter faster than those 2001 LICs that have remained in the group (4.5 percent), although with wide heterogeneity (Figure SF2.1.1.B).
Several factors have contributed to the rapid economic growth of the 2001 LICs. Twelve 2001 LICs were transition economies, of which nine rebounded sharply during the 2000s from their
Note: This Special Focus was prepared by Rudi Steinbach. Research assistance was provided by Mengyi Li.
1 LICs in 2019 reflect the country classification of the 2018/19 World Bank fiscal year and are defined as countries with GNI per capita (World Bank Atlas method) of $995 or less in 2017; 2001 LICs reflect the country classification of the 2000/01 fiscal year and had GNI per capita of $755 or less in 1999. New thresholds are determined at the start of each World Bank fiscal year. Of the 64 2001 LICs, 32 moved to middle-income country status while 32 remained classified as LICs in 2019.
deep recessions in the 1990s.2 Among nontransition 2001 LICs, rapid investment growth boosted overall economic growth, on average contributing more than one-third to output growth during 2001-18. In six of these countries (Cameroon, the Democratic Republic of Congo, Guinea, Indonesia, Mauritania, Mozambique), investment booms followed new resource discoveries. Debt relief in the early 2000s, and the fiscal space created by it, supported government spending on non-interest expenditure.3 In addition, business climates and policy frameworks improved in most of the 2001 LICs.
Rapid economic growth in LICs has contributed to poverty reduction. The share of extreme poor in the population of 2001 LICs has fallen by 16 percentage points, on average, and this has contributed 20 percentage points—about one third—to the decline in the global poverty headcount between 2001 and 2015. This contribution, however, mostly reflects sharp declines in the poverty headcount of the 2001 LICs that reached middle-income levels, while masking broadly unchanged poverty headcounts among the countries that have remained, or became, LICs (Figure SF2.1.1.C). Today’s LICs
2 Transition economies are economies that changed from centrallyplanned to market-oriented economic systems. Those that were LICs in 2001 include Armenia, Azerbaijan, Georgia, the Kyrgyz Republic, Cambodia, Lao People’s Democratic Republic, Moldova, Tajikistan, Turkmenistan, Ukraine, Uzbekistan, and Vietnam. On average, their economies contracted by an estimated 30 percent during 1990-1996.
3 Government non-interest expenditure rose by 2 percentage points of GDP, on average, between the year of debt relief and 2018.
vk.com/id446425943
134 S P EC I AL F O CU S 2 . 1 |
G L O BAL EC O NO M I C P ROS P EC T S | J U NE 2 0 1 9 |
|
|
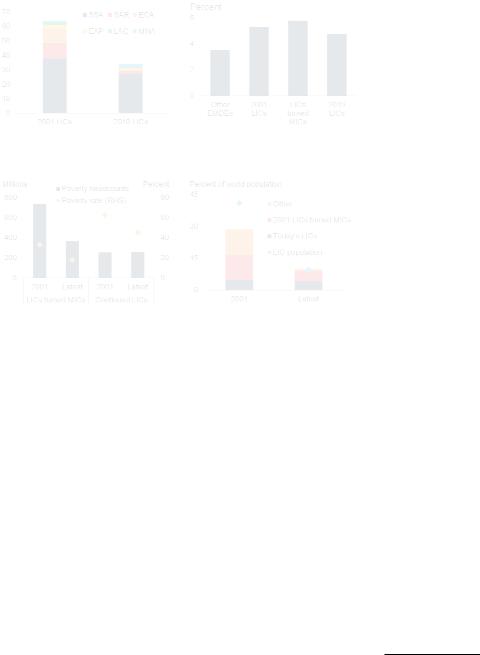
FIGURE SF2.1.1 LIC growth since 2001
The number of LICs has declined from 64 in 2001 to 34 in 2019. Growth in LICs benefited from several factors and has allowed 32 countries to progress to middle-income status. Sharp declines in LIC poverty rates have contributed one-third to the decline in the global poverty headcount since 2001. However, these declines mask broadly unchanged headcounts among countries that have remained LICs. While the share of LICs in the global population has declined by three-quarters—from 41 percent in 2001 to 10 percent in 2015—they are home to more than 40 percent of the world’s poor.
A. Number of LICs by region |
B. Average annual GDP growth, |
|
2001-18 |
C. LIC poverty rates and headcounts |
D. World poverty and LIC share of |
|
world population |
Source: United Nations, World Bank.
A.LICs = low-income countries. LICs in 2001 had per capita GNI (US$, current) at $755 or below, while LICs in 2019 have per capita GNI at $995 or below in 2017.
B.Other EMDEs exclude 2001 LICs.
C.Latest reflects 2015 data. Due to data limitations, poverty share for “LICs turned MICs” includes 26 of 32 countries and reflects 94.1 percent of the sample population in 2015; “Continued LICs” includes 25 of 32 countries and reflects 79.8 percent of the sample population.
D.Latest reflects 2015 data. Due to data limitations, poverty share for “LICs turned MICs” includes 26 of 32 countries and reflects 94.1 percent of the sample population in 2015; “Today’s LICs” includes 34 of 34 countries.
Click here to download data and charts.
account for less than one-tenth of the global population (one-quarter their share in 2001). However, they are home to around 40 percent of the world’s extreme poor (Figure SF2.1.1.D). This share is expected to remain elevated amid continued fragility in many of these economies, while the poverty headcount is expected to continue to decline elsewhere.
Today’s LICs face severe challenges that threaten to hold back convergence of their per capita incomes with those in MICs. Today’s LICs also face significantly larger spending needs than non-
LIC EMDEs to meet the Sustainable Development Goals by the end of next decade, underscoring the need for sustained and robust growth (Gaspar et al. 2019).
Against this backdrop, this Special Focus examines the following questions.
•What has driven and supported growth in LICs since 2001?
•How have these factors affected LIC progression to MIC status?
•What are the prospects for future progression among today’s LICs?
This Special Focus presents the following findings. First, growth in low-income countries—and, especially those that have progressed to middleincome status—has benefited from a confluence of favorable developments since 2001. Second, prospects for further progress by today’s LICs toward middle-income status are challenging. Compared to the LICs of 2001 that became MICs, today’s LICs have per capita incomes that are even further below the middle-income threshold, more likely to be fragile, more often landlocked and clustered with other LICs, heavily reliant on agriculture, and face weaker prospects for long-term commodity demand.4 Third, since today’s LICs account for 40 percent of the global extreme poor, challenging prospects for LIC growth will set back progress towards eliminating extreme poverty globally.
This Special Focus extends previous analysis of LIC growth (World Bank 2015a). First, a broader set of factors that have contributed to LIC growth since 2001 is considered—in particular, the roles of investment in human and physical capital, greater trade integration, and improved business climates and policy frameworks. Since threequarters of LICs rely heavily on commodity exports and revenues, the impact of the 2014-16 commodity price plunges is examined. Second, and in contrast to the earlier work which examined the fates of the 64 LICs of 2001,
4 Fragile LICs are those affected by fragility, conflict, and violence, according to the World Bank’s Harmonized List of Fragile Situations.
vk.com/id446425943
G L O BAL EC O NO M I C P ROS P EC T S | J U NE 2 0 1 9 |
S P EC I AL F O CU S 2 . 1 |
135 |
|
|
|
the study here zooms in on the drivers of growth in the smaller group of 34 LICs of 2019, including the four countries that have become LICs in recent years amid weaker commodity prices and increased fragility. Third, this Special Focus highlights the implications for global poverty goals.
What has supported growth in LICs since 2001?
The 64 countries classified as LICs in 2001 experienced growth of 5.3 percent a year, on average, during 2001-18—considerably faster than the 3.6 percent growth in non-LIC EMDEs (Figure SF2.1.2.A). For those LICs, this was a sharp improvement from their tepid growth of 1.6 percent annually during the 1990s.
Growth in the 64 2001 LICs was supported by several cyclical and structural factors. The 2001-11 commodity price boom lifted growth in the onethird of LICs that were—or became—industrial commodity exporters. In the nine LICs transitioning into market-oriented economies, the deep recessions of the 1990s were followed by cyclical rebounds. In five countries, armed conflicts eased in the 2000s after inflicting heavy human and economic losses during the 1990s. Debt relief for about half of the 2001 LICs helped put these economies on a more sustainable financial footing. Business climates and governance, especially the rule of law, improved significantly in more than half of the 2001 LICs.
Cyclical factors
Commodity price boom. Around three-quarters of 2001 LICs benefited from the commodity price boom of 2001-11. During the commodity price boom, energy and industrial metals prices more than tripled and agricultural prices rose by around 150 percent (Figure SF2.1.2.B). The boom, along with a decline in easily accessible mineral and gas deposits in advanced economies and more costeffective transport through advances in bulk shipping fueled unprecedented investment in commodity exploration and production in the 2001 LICs (Figure SF2.1.2.C; Lusty and Gunn 2015). In 2008, commodity prices—particularly
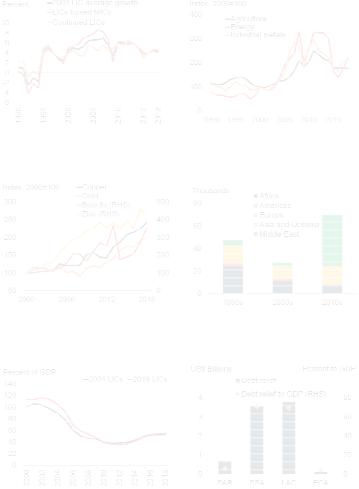
FIGURE SF2.1.2 Cyclical and structural factors supporting LIC growth
Growth in the LICs of 2001 was supported over the next decade by booming commodity prices, increased resource production amid large investments in mineral exploration, debt relief under the MDRI and HIPC initiatives, and receding conflicts, particularly in Africa. Conflict-related casualties have, however, risen sharply in the Middle East where several countries have tipped into the low-income bracket.
A. Annual GDP growth in LICs of 2001 |
B. Agricultural, energy, and industrial |
|
metals prices |
C. Resource production in LICs of 2001
E. Gross government debt in LICs of 2001 and LICs of 2019
D. Annual average conflict-related deaths
F. MDRI and HIPC relief in LICs of 2001
Source: Haver Analytics; International Monetary Fund, World Economic Outlook; Peace Research Institute of Oslo (PRIO), Roser (2019); World Bank Pink Sheet; World Bank staff calculations; World Bureau of Metal Statistics.
B. Agriculture includes 23 commodities, industrial metals includes 7 metals, and Energy includes coal, crude oil, and natural gas. Index 100=2000.
D.Only conflicts in which at least one party was the government of a state and which generated more than 25 battle-related deaths are included. The data refer to direct violent deaths only and exclude outbreaks of disease or famine. Data up to 2016. Country-level data unavailable.
E.Unweighted averages. 2001 LICs includes 61 countries and the 2019 LICs includes 31 countries.
F.Committed debt relief under the assumption of full participation of creditors. Bars represent average debt relief per region in US$ billions for all HIPC and MDRI LICs. Diamonds reflect average debt relief per region relative to countries’ GDP.
Click here to download data and charts.
metals and oil prices—declined sharply with the onset of the global financial crisis, but recovered to pre-crisis levels within about a year. However, by

vk.com/id446425943
136 S P EC I AL F O CU S 2 . 1 |
G L O BAL EC O NO M I C P ROS P EC T S | J U NE 2 0 1 9 |
|
|
2011, commodity prices began to slide again, and they fell by 30-60 percent to a low in 2016 before gradually and only partially recovering. By 2018, industrial metals and energy prices were at their 2005-06 levels in real terms while agricultural prices remained near their 2016 lows.
Two-thirds of the 2001 LICs were already heavily reliant on commodity exports and revenues in 2001—the majority of them on metals and energy exports, and the rest on agricultural commodity exports. Another one-tenth of the 2001 LICs subsequently became reliant on commodity exports, specifically metals and energy, after discoveries and exploitation of major commodity deposits. Several “giant” oil and gas fields— conventional fields with recoverable reserves of 500 million barrels or more—have been discovered offshore of East, West, and Central Africa, to the benefit of many 2001 LICs in these regions (Côte d’Ivoire, Cameroon, Ghana, Mozambique, Tanzania). During the 2000s, major new commodity deposits were also discovered in Indonesia (oil and gas), Lao PDR (copper, gold), Mauritania (copper, gold, and oil), Republic of Congo (oil), and Zambia (copper). From 2003-12, new commodity discoveries in Sub-Saharan Africa accounted for 22 percent of global discoveries and 15 percent of global exploration expenditures (Schodde 2013).
The commodity boom of 2001-11 supported above-average growth in those 2001 LICs that were, or became, commodity exporters. Exports of primary commodities in these countries rose by one-half of GDP between 2001 and 2011. Higher export earnings helped improve fiscal positions, with government revenues of commodityexporting LICs rising by close to 4 percentage points of GDP, on average, and fiscal deficits narrowing by around 1 percentage point of GDP, between 2001 and 2011. This, as well as debt relief, allowed a doubling of social expenditures between the 2000s and 2010s. The commoditydriven growth surge was accompanied by a decline in inflation to single digits and an annual 3 percent real exchange rate appreciation between 2001 and 2011, on average, in commodityexporting LICs (Trevino 2011; Guillaumont, Jeanneny, and Hua 2015).
Rebounds in transition economies. Nine of the 2001 LICs were, in the early 2000s, rebounding from the deep recessions into which their economies had plunged as they made the transition from centrally planned to market-based economies. By the time their economies had bottomed out in the midto late-1990s, their output had declined from its pre-recession levels by one fifth in Uzbekistan, by more than a third in Kazakhstan, and by at least one half in Armenia, Azerbaijan, Georgia, the Kyrgyz Republic, Moldova, Tajikistan, and Ukraine (Iradian 2007).5 As a result, per capita incomes had fallen below the low-income threshold.
However, despite the drop in output these economies continued to have a foundation of solid human and physical capital, with near-universal literacy rates, triple the average secondary enrollment ratio of the average 2001 LIC, and power-generating capacity similar to those of advanced economies. Governments in many of these countries were implementing growthenhancing structural reforms to accelerate the transition, including privatization of state-owned assets (for example, agricultural land reform in Azerbaijan); establishment of legal systems and property rights (the Kyrgyz Republic); the design of more efficient social safety nets (Armenia); strengthening of financial systems; greater openness to international trade, including through accession to the WTO (Georgia); and the improvement of business environments through substantive regulatory simplification (Moldova). These reforms helped boost productivity growth, including by promoting investment and exports (Loukoianova and Unigovskaya 2004). Growth since 2001 was further supported by the commodity boom, as seven of these nine transition economies were also heavily reliant on commodity exports.6
5 It is likely that the real GDP declines in these transition economies were overstated in the official data of the early 1990s, as the private sectors that were emerging at that time were typically not fully included in the statistical base during the early days of the transition (Iradian 2007).
6 The commodity-exporting transition-economy LICs of 2001 were Armenia, Azerbaijan, the Kyrgyz Republic, Tajikistan, Turkmenistan, Ukraine, and Uzbekistan.

vk.com/id446425943
G L O BAL EC O NO M I C P ROS P EC T S | J U NE 2 0 1 9 |
S P EC I AL F O CU S 2 . 1 |
137 |
|
|
|
Structural factors
Receding conflicts. Five of the LICs of 2001—all of which remain LICs today—emerged from severe conflicts in the 1990s and early 2000s (Burundi, the Democratic Republic of Congo, Liberia, Rwanda, and Sierra Leone). The conflict in the Democratic Republic of Congo is estimated to have cost 2.5 million lives when deaths related to conflict-induced disease and famine are included—equivalent to 3 percent of today’s population (Lacina and Gleditsch 2004; Roberts et al. 2001). Conflicts in Burundi, Liberia, Rwanda, and Sierra Leone inflicted losses of human life equivalent to between 1 and 10 percent of their populations. While most of these economies are still considered fragile, conflictrelated casualties in Africa have been on a declining trend since the 1990s (Figure SF2.1.2.D). This has provided a more favorable setting for a growth rebound.
Debt relief. Thirty-five of the 2001 LICs (of which 26 remain LICs today) received debt relief during the early 2000s in the context of the Multilateral Debt Relief Initiative (MDRI) and Highly-Indebted Poor Country (HIPC) initiative. Between the year preceding debt relief and two years after it, government debt in these countries declined by 53 percentage points of GDP, on average, to 31 percent of GDP (Figures SF2.1.2.E and SF2.1.2.F). Rapid growth from 2001, more broadly, also supported the reduction of debt ratios. In the median 2001 LIC, government debt declined by 35 percentage points of GDP, from 84 percent of GDP in 2001 to 49 percent of GDP in 2018.
This reduction of debt burdens has helped put public finances on a sounder footing. While government deficits increased slightly (by about 1 percentage point of GDP), non-interest government expenditures rose by 5 percentage points of GDP, and combined health and education expenditures rose by one-fifth between the five years preceding debt relief and the five years following it (Figure SF2.1.3.A). More sustainable public finances supported macroeconomic stability (Bayraktar and Fofack 2011; Marcelino and Hakobyan 2014).
FIGURE SF2.1.3 Domestic factors supporting LIC growth
The reduction of debt burdens has helped put public finances in the LICs of 2001 on a sounder footing. Policy frameworks have also improved, and governments have become more effective. Investments in human and physical capital have contributed to higher secondary school enrollment ratios and greater access to electricity. In addition, more effective health care interventions have raised average life expectancy in these countries.
A. Public finances before and after |
B. Share of population with access to |
debt relief |
electricity in 2001 LICs |
C. Average secondary school enrollment rates in 2001 LICs
E. Share of 2001 LICs with flexible exchange rate arrangements
D. Average life expectancy in 2001 LICs
F. Government effectiveness in 2001 LICs
Source: International Monetary Fund, World Economic Outlook; Reinhart and Rogoff (2004); Worldwide Governance Indicators; World Development Indicators.
Note. “LICs turned MICs” are those LICs in 2001 that have achieved MIC per capita incomes by 2019; “Continued LICs” are LICs that have remained LICs since 2001.
A. Poverty-reducing expenditure represents public spending on health and education. Unweighted average for 26 LICs that received MDRI or HIPC debt relief.
B.-F. Unweighted averages.
B.2010s includes data up to 2016. 2001 LICs, “LICs turned MICs”, and “Continued LICs”, include 62, 32, and 30 countries, respectively.
C.2010s includes data up to 2017. 2001 LICs, “LICs turned MICs”, and “Continued LICs”, include 55, 26, and 29 countries, respectively.
D.2010s includes data up to 2017. 2001 LICs, “LICs turned MICs”, and “Continued LICs”, include 64, 32, and 32 countries, respectively.
E.Following the coarse exchange rate regime classification of Reinhart and Rogoff (2004), where categories 1-2 represents fixed, and 3-6 represent more flexible arrangements. 2010s includes data up to 2016. 2001 LICs, “LICs turned MICs”, and “Continued LICs”, include 63, 32, and 31 countries, respectively.
F.2001 LICs, “LICs turned MICs”, and “Continued LICs”, include 64, 32, and 32 countries, respectively.
Click here to download data and charts.

vk.com/id446425943
138 S P EC I AL F O CU S 2 . 1 |
G L O BAL EC O NO M I C P ROS P EC T S | J U NE 2 0 1 9 |
|
|
Since 2013, the downward trend in 2001 LICs’ debt has reversed, with government debt rising in the median 2001 LIC by 14 percentage points of GDP to 49 percent of GDP in 2018. That said, only two of the 2001 LICs—Benin and Chad— have returned to debt ratios near those before debt relief. The composition of this debt has become increasingly non-concessional as countries have accessed capital markets and borrowed from nonParis Club creditors (World Bank 2019a). In 2018, 44 percent of the external debt of the median LIC of 2001 was on non-concessional terms, compared with 30 percent in 2001.
Trade integration. Many of the 2001 LICs have reaped benefits from greater trade integration by entering into free trade agreements. Moldova’s trade agreement with the European Union has supported export growth and is encouraging reforms, in particular related to governance, the financial sector, and the business environment (European Commission 2018). In Sub-Saharan Africa, membership in free trade areas has boosted intra-regional trade (Burundi, Kenya, Rwanda, Tanzania, Uganda), and supported FDI inflows, industrialization, and integration into global value chains (e.g., Lesotho; Buigut 2016, Morris and Staritz 2017). Similarly, Nicaragua reaped growth dividends and attracted stronger FDI inflows between 2005 and 2011 as a result of the Central America-Dominican Republic Free Trade Agreement (Hornbeck 2012). The India-ASEAN agreement that went into effect in 2009-10 has benefited the 2001 LICs that became members (Bhutan, Bangladesh, India; Bhattacharyya and Mandal 2016).
Investment in human and physical capital. Most 2001 LICs boosted their investment in human and physical capital during the period of rapid growth from 2001. Between 2001 and 2017, the ratio of total investment to GDP in these countries increased by 5 percentage points, of which one-third represented increased public investment.
•Infrastructure. Infrastructure in sectors such as electricity and communications has improved significantly among LICs (Calderón and Servén 2010; Kumar and Rauniyar 2018).
From 2001 to 2016, access to electricity in the median 2001 LIC increased from 30 to 53 percent of the population and, in one-quarter of LICs, from 52 to 84 percent (Figure SF2.1.3.B).7 Communications infrastructure has improved rapidly, helped in part by the spread of mobile phone networks (Aker and Mbiti 2010; World Bank 2016b). The use of mobile phones has reduced information inefficiencies and transaction costs, benefitting particularly businesses and small-scale farmers in rural areas where distances from markets are large (Aker 2011). Transaction costs could be lowered even further if broad-band internet network infrastructure was increased from its current low coverage of 1 percent of the population in the median LIC in 2016 (World Bank 2019b).
•Human capital. In the median 2001 LIC, secondary education net enrollment ratios rose from 24 to 47 percent of the school-age population between 2001 and 2016, supported by a 25 percent increase in government spending on education (Figure SF2.1.3.C). This, combined with improvements in average life expectancy in LICs—in part due to the improved prevention and more effective treatment of widely-prevalent conditions such as malaria, HIV, and AIDS— is creating the preconditions for an increasingly productive future workforce (Figure SF2.1.3.D; Asiki et al. 2016; Barofski, Anekwe, and Chase 2015).
Improved business climates and policy frameworks. The business climate has improved in the majority of the 2001 LICs between the 1990s and the 2010s. More specifically, the ease of starting a business, obtaining credit, and trading across borders has, on average, increased by 20-30 index points since 2006 (World Bank 2019c). Similarly, the Worldwide Governance Indicator scores for the rule of law have strengthened by about 20 percent, and there have been more moderate improvements in regulatory quality and political stability.
7 That said, access to electricity in some countries still remains below 10 percent of the population (Burundi, Chad, South Sudan).
vk.com/id446425943
G L O BAL EC O NO M I C P ROS P EC T S | J U NE 2 0 1 9 |
S P EC I AL F O CU S 2 . 1 |
139 |
|
|
|
A growing number of LICs have strengthened their fiscal management through medium-term debt management strategies (World Bank 2019a). Some have strengthened their monetary policy frameworks and their buffers against shocks by adopting flexible exchange rate arrangements and using their policy instruments to target low domestic inflation; more than one-quarter of 2001 LICs had flexible exchange rate regimes in 2016, compared to fewer than one-fifth during 2001-10, on average (Figure SF2.1.3.E).8 Improved policy frameworks and increased resilience to external shocks among the 2001 LICs have also been supported by increases in foreign exchange reserves from 8 percent of GDP in 2001 to 14 percent of GDP, on average, in 2017.
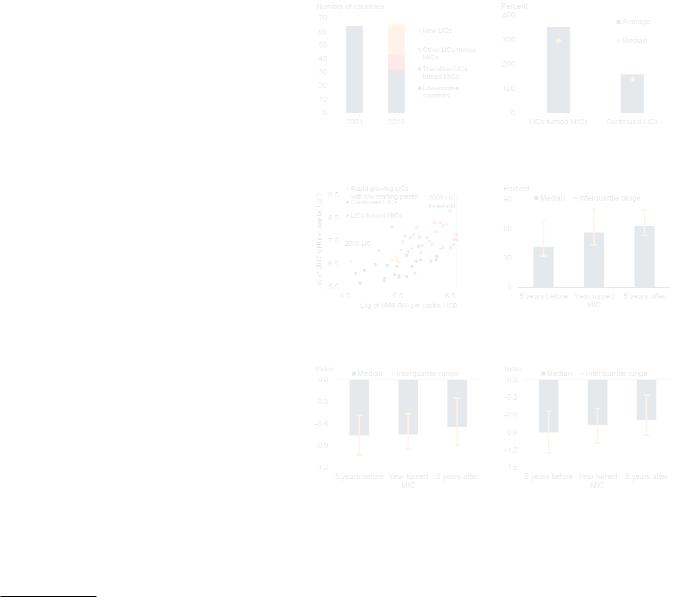
FIGURE SF2.1.4 Factors supporting LIC progression to MIC income levels
A quarter of the 2001 LICs that have become MICs were transition economies that recovered from deep recessions after the end of socialism throughout much of the world. Improvements in per capita income were more pronounced in the LICs that have reached MIC status. A few rapidgrowing LICs have not been able to reach MIC status, partly due to very low starting positions in 2001. In countries that have reached MIC status, school enrollment ratios, government effectiveness, and the rule of law improved as they neared the year of moving to MIC status, as well as in the years thereafter. At the point of becoming a MIC, these measures were consistently better than the LIC median.
A. Low-income countries, 2001 and |
B. Growth in 2001 LIC per capita |
2019 |
incomes between 2001 and 2019 |
How have these factors affected LIC progression to MIC income levels?
The 2001 LICs that became MICs benefited somewhat more from the factors discussed above than those that remained (Figures SF2.1.3.B- 2.1.3.F). On average, the 2001 LICs that became MICs had stronger policy frameworks, better governance and business environments, betterdeveloped infrastructure, larger improvements in human capital, and more fiscal resources due to revenue bases being significantly larger—by at least one fifth of GDP. The 2001 LICs that became MICs also had a geographical advantage, as less than one-third were landlocked compared to almost half of today’s LICs. Furthermore, the 2001 LICs that were landlocked but became MICs had, on average, neighbors with per capita incomes that were 36 percent higher than current incomes among the neighbors of today’s landlocked LICs.
LICs that achieved MIC per capita income levels. Between 2001 and 2019, 32 LICs achieved middle-income status (Figure SF2.1.4.A). The progress made by LICs that have become MICs
8 Exchange rate regimes are grouped according to the classification in Ilzetski, Reinhart and Rogoff (2017), with the only exception that freely falling currencies are also regarded as flexible exchange rate arrangements.
C. Progression of 2001 LIC per capita incomes
E. Government effectiveness in LICs turned MICs
D. Secondary school enrollment in LICs turned MICs
F. Rule of law in LICs turned MICs
Source: Worldwide Governance Indicators (WGI), World Bank staff calculations, World Development Indicators.
C.Sample includes 59 2001 LICs. GNI per capita according to the World Bank Atlas method. GNI per capita for 1999 was published in August 2000 and reflects the original data used for country income classification in the 2001 World Bank fiscal year, while GNI per capita for 2017 was published in October 2018 and reflects the data used for the 2019 World Bank fiscal year. Exceptions are Liberia and Myanmar, for which GNI per capita in 2002 is used as a proxy for 1999. Rapid-growing LICs with low starting points are defined as LICs that had per capita incomes below one-third of the $755 LIC threshold in 2001, and these incomes have increased to above two-thirds of the $995 LIC threshold in 2019.
D.Sample includes 13 LICs that became MICs, due to data limitations. Year turned MIC reflects the World Bank fiscal year.
E.-F. WGI index scores are standard normal units that range between -2.5 and 2.5, with zero mean. A negative score implies government effectiveness or rule-of-law below the global average. Sample includes all 32 LICs that became MICs. Year turned MIC reflects the World Bank fiscal year.
Click here to download data and charts.

vk.com/id446425943
140 S P EC I AL F O CU S 2 . 1 |
G L O BAL EC O NO M I C P ROS P EC T S | J U NE 2 0 1 9 |
|
|
has helped lift 20 percent of the global poor in 2001 out of poverty by 2016, more than offsetting the increasing poverty headcount among the countries that remained LICs.9
•Favorable initial conditions. The 2001 LICs that have become MICs were some of those countries closest to the middle-income threshold to begin with: their average per capita income in 2001 was about 80 percent higher than that of the LICs that have remained LICs (Table SF2.1.1). LICs that achieved MIC status also grew somewhat more rapidly during 2001-18 (Figure SF2.1.4.B; Johnson and Papageorgiou, forthcoming).10 However, the growth differential between these two LIC groups masks substantial dispersion within each group. Despite exceptionally fast and sustained growth—more than tripling per capita incomes between 2001 and 2018—several 2001 LICs remain LICs today (Figure SF2.1.4.C; Ethiopia, Rwanda, Tanzania). This mostly reflects their low 2001 per capita incomes (70 percent below the 2001 threshold LIC income). In these countries, robust growth was supported by improving macroeconomic environments, institutional and business climate reforms, and strong public investment (Government of Rwanda and World Bank 2019; Möller and Wacker 2017).
•Commodity discoveries and exploitation. Of the 32 LICs that became MICs, about one half benefited from discoveries of commodity deposits or expanded exploitation of metals, oil, or gas resources. Today, many former 2001 LICs—such as Angola, the Republic of Congo, Equatorial Guinea, Ghana, Lesotho, Indonesia, Lao PDR, Mauritania, Nigeria, Sudan, Timor-Leste, Uzbekistan, and Zambia—have achieved middle-income status
9 Due to data limitations, poverty headcount data excludes the following 11 LICs of 2001: Afghanistan, Azerbaijan, Haiti, Cambodia, Myanmar, Democratic People’s Republic of Korea, Somalia, Sudan, Turkmenistan, Uzbekistan, and Zimbabwe. In 2001, their combined population accounted for 8 percent of the total 2001 LICs population.
10 In terms of per capita growth, the difference was more pronounced (Figure 2.1.4B).
partly as a result of new commodity discoveries or the exploitation of commodity resources. Large investments in the resource sectors of Azerbaijan, Cameroon, and Mongolia facilitated their progression to middle-income status (World Bank 2015a). The countries that became MICs amid the commodity price boom often had stronger institutional quality and governance than those that remained LICs, and were therefore less likely to fall victim to the resource curse that erodes non-resource competitiveness (Dauvin and Guerreiro 2017).
•Rebounding transition economies. Another onequarter of the LICs that have progressed to MIC status since 2001 were the remaining transition-economy LICs. All but one (Tajikistan) have returned to middle-income per capita income levels.
•Trade integration, peace, and reforms. Of the
27 LICs of 2001 that have subsequently signed trade agreements, 20 achieved MIC status as entry into large free trade areas catalyzed export spurts (Moldova, Nicaragua).11 Others reached MIC status after emerging from conflict (Côte d’Ivoire, Solomon Islands), or undertaking substantial public infrastructure investment (Bhutan).12 The 2001 LICs that reached MIC status have steadily strengthened human capital development, the effectiveness of their governments, business climates, and the quality of their institutions in the years before progression and thereafter. In fact, these countries have consistently outperformed the median LIC on measures of these factors (Figures SF2.1.4.D-2.1.4.F).
11Excludes “region-region” agreements such as the Cotonou agreement between the European Union and the 78 economies in the African, Caribbean and Pacific Group of States.
12During the 2000s, the government of Bhutan transformed the economy’s growth prospects by investing heavily in hydropower infrastructure, taking advantage of the country’s mountainous terrain and high average annual rainfall. Electricity capacity in Bhutan tripled and the share of the population with access to it rose from 39 percent in 2001 to 100 percent by 2016. Surplus electricity is exported and accounts for a third of exports and almost half of government revenue, while overall power generation is estimated to contribute 1 percent of GDP annually (World Bank 2015b).