

Global Economic Prospects -World Bank_watermark
.pdfvk.com/id446425943
The recovery in Sub-Saharan Africa has disappointed, with weakening external demand, supply disruptions, and elevated policy uncertainty weighing on activity in major economies. Growth in the region is projected to pick up from 2.5 percent in 2018 to 2.9 percent this year and an average of 3.4 percent in 2020-21, as domestic demand gathers pace and oil production recovers in large exporting economies. However, this expected recovery is significantly slower than previously projected, reflecting persistent headwinds in major economies, and it is largely insufficient to make progress in poverty reduction. Downside risks to the outlook include weaker-than-expected external demand, lower commodity prices, renewed stress in global financial markets, fiscal slippages, political uncertainty, armed conflicts, and adverse weather conditions.
Recent developments
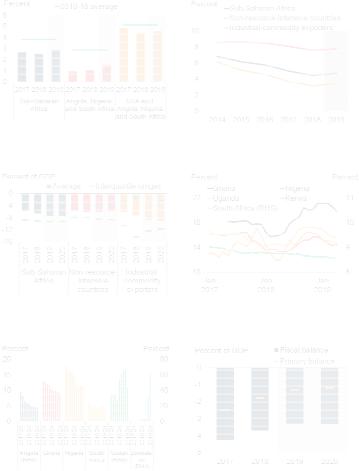
The economic environment in Sub-Saharan Africa (SSA) remains challenging, with external and domestic headwinds that caused the slowdown in 2018 dissipating more slowly than previously envisaged (Figure 2.6.1.A). Weakening external demand from major economies, persistent policy uncertainty, and domestic growth bottlenecks have been only partly offset by an easing of external financing conditions and recovering commodity prices.
In Angola, Nigeria, and South Africa—the three largest economies in the region—growth has remained subdued in 2019. In Nigeria, the anticipated recovery in the oil sector—the main source of government revenue—has been weaker than expected as policy uncertainty continues to constrain investment in new capacity. Weak domestic demand amid high unemployment and a challenging business environment has dampened growth in the non-oil sector. In South Africa, continued policy uncertainty and rolling power blackouts have slowed economic activity in the first half of 2019; however, it is expected to strengthen aided by somewhat easier external financing conditions and as the new
Note: This section was prepared by Rudi Steinbach. Research assistance was provided by Mengyi Li.
administration’s fast-tracking of long-delayed reforms gradually improves the business environment. Angola is expected to emerge from three years of contraction, with the recent growth momentum in the non-oil sector partly reflecting reforms to bolster the business environment. However, a faster-than-expected decline in production from decaying oil fields and lower production from marginal oil fields have led to significantly weaker-than-expected growth in 2019.
Elsewhere in the region, growth has been robust among non-resource-rich countries, supported by sustained public investment (Rwanda, Uganda; Figure 2.6.1.B). In some countries, consecutive years of good harvests have boosted agricultural exports (Benin, Côte d’Ivoire, Rwanda), and supported robust consumption growth (Burkina Faso, Kenya). In Ethiopia, however, weaker agricultural commodity prices, particularly coffee, and persistent foreign exchange shortages have weighed on activity.
Southern and East Africa was hit by two devastating cyclones—Idai and Kenneth—in March and April 2019, which took a heavy human toll and severely affected economic activity in the Comoros, Malawi, Zimbabwe, and in particular, Mozambique. Among industrialcommodity exporters, growth has generally strengthened—despite decelerating external
vk.com/id446425943
122 C H AP T E R 2 . 6 |
G L O BAL EC O NO M I C P ROS P EC T S | J U NE 2 0 1 9 |
|
|
FIGURE 2.6.1. SSA: Recent developments
The recovery in Sub-Saharan Africa has lost momentum, reflecting subdued activity in Angola, Nigeria, and South Africa—the region’s largest economies. More robust growth among non-resource-intensive economies has been supported by sustained public investment, although the related capital goods imports have contributed to widening current account deficits. External financing conditions have become more benign, and inflation has moderated across most of the region, but remains elevated in a number of countries. Interest burdens are exacerbating fiscal deficits.
A. GDP growth |
B. Public sector investment, share of |
|
GDP |
year as high inflation, chronic food and fuel shortages, and elevated political uncertainty present significant headwinds to activity. Growth is also expected to contract in Zimbabwe in 2019, as sharply higher inflation curtails real income and private consumption. In contrast, growth in the Democratic Republic of Congo continues to firm, with mining production rising sharply due to investment in new capacity.
C. Current account balances |
D. Financing conditions: 10-year |
|
government bond yields |
E. Inflation, annual rate |
F. Fiscal balances |
Source: Haver Analytics; International Monetary Fund, World Economic Outlook; World Bank. Note: Non-resource-intensive countries represent agricultural commodity-exporting and commodityimporting countries. Industrial commodity exporters represent oiland metal-exporting countries.
A.Aggregate growth rates calculated using 2010 U.S. dollar GDP weights.
B.GDP-weighted averages. Sample includes 22 non-resource-intensive countries and 15 industrialcommodity exporters.
C.Simple averages of country groupings.
F. Simple averages.
Click here to download data and charts.
demand—as oil and mining production continued to benefit from investment in new capacity (Chad, Democratic Republic of the Congo, Mauritania). However, in Sudan—the fourth largest economy in the region—economic activity contracted in 2018 and is expected to continue doing so in this
Current account deficits have widened across the region, partly reflecting weaker exports (Guinea, The Gambia), and sizable capital goods imports related to large investment projects (Côte d’Ivoire, Mozambique, Niger; Figure 2.6.1.C). In non- resource-rich countries, sustained public investment spending is contributing to elevated deficits (Kenya, Tanzania, Uganda). International bond issuance activity has been slow to recover after weakening in the second half of last year, and FDI inflows in the region remain mixed—despite easier financing conditions and a partial recovery in commodity prices. Capital inflows are nevertheless expected to sufficiently finance current account deficits—especially in countries with large infrastructure investment programs.
Exchange rates have been broadly stable this year, or have strengthened somewhat, amid improved external financing conditions (Botswana, Kenya, South Africa; Figure 2.6.1.D). This has, in part, supported moderating inflation in many countries in early 2019 (Angola, South Africa, Tanzania, Uganda; Figure 2.6.1.E). Reduced inflationary pressures have allowed authorities to pause monetary policy tightening in some countries (Lesotho, South Africa, Uganda), and ease their stance in others (Angola, Ghana, Nigeria). In Zambia, however, monetary policy was tightened as renewed currency weakness is expected to lift inflation above the central bank’s target. In Sudan, repeated devaluations as well as monetization of the fiscal deficit have fueled inflation rates in excess of 40 percent, while the removal of subsidies and foreign-currency shortages have led to comparable double-digit inflation rates in Zimbabwe. Recent oil price increases are expected to put renewed upward pressure on inflation in many countries during 2019.
vk.com/id446425943
G L O BAL EC O NO M I C P ROS P EC T S | J U NE 2 0 1 9 |
S U B - S AH ARAN AF RI C A |
123 |
|
|
|
Public debt vulnerabilities in the region remain a concern. While primary deficits are expected to continue gradually narrowing to 1.2 percent of GDP in 2019, overall deficits are expected to remain in excess of 3 percent, reflecting the increases in interest burdens arising from the growth in government debt (Figure 2.6.1.F). Higher interest burdens also reflect the shifting composition of debt toward more expensive nonconcessional financing, which has increased to about 60 percent of total external debt—about one-third higher than in the 2000s (World Bank 2019j). These higher debt-servicing costs tend to constrain non-interest expenditures and raise concerns about debt sustainability. In non- resource-intensive economies, increased indebtedness has largely reflected continued strong public investment (Burkina Faso, Rwanda, Uganda). Among industrial-commodity exporters, rising government debt has been more acute, reflecting persistently large deficits amid expenditure overruns and revenues weighed down by softer export earnings and slower growth (Namibia, Nigeria, South Africa, Zambia; World Bank 2019k).
FIGURE 2.6.2 SSA: Outlook and risks
The recovery in the region is projected to strengthen moderately, as oil production improves in Angola and Nigeria and investor confidence firms in South Africa. However, per capita growth is expected to remain low, and downside risks dominate, including the possibility of a sharper-than- expected slowdown in key partner economies. Rising public debt burdens are an increasing source of vulnerability across the region. Banking sectors have become more vulnerable in some countries. A return to El Niño conditions in 2019 could weigh on agricultural production.
A. GDP growth |
B. GDP growth per capita |
C. Shares of SSA exports to large |
D. Government debt |
economies |
|
Outlook
Growth in the region is projected at 2.9 percent this year, up from 2.5 percent in 2018, but half a percentage point lower than previously forecast, reflecting more pronounced domestic headwinds and weaker-than-expected external demand. This translates into per capita growth of a mere 0.2 percent for 2019, following three consecutive years of contraction.
Growth in the region is expected to improve gradually over the forecast horizon, reaching 3.3 percent in 2020 and 3.5 percent in 2021 (Figure 2.6.2.A). This cyclical recovery is weaker than previously envisioned—despite some increase in commodity prices—reflecting in part weaker demand growth in major trading partners and, in particular, an increasingly challenging business environment in Sudan amid heightened political uncertainty. The forecast assumes that investor sentiment will improve in some of the large economies in the region, that oil production in large oil exporters will recover, and that robust
E. Nonperforming loans |
F. Agricultural production growth |
|
and El Niño |
Source: International Monetary Fund, World Economic Outlook; NOAA/National Weather Service Climate Prediction Center; World Bank.
A.-B. Aggregate growth rates calculated using 2010 U.S. dollar GDP weights. Non-resource-intensive countries represent agricultural commodity-exporting and commodity-importing countries. Industrialcommodity exporters represent oiland metal-exporting countries.
D.Simple averages of country groupings.
E.Nonperforming loans are expressed relative to total gross loans. 2019Q1 for South Africa reflects data for January 2019.
F.ONI is the Oceanic Niño Index that measures sea surface temperature anomalies in degrees Celsius within the Niño 3.4 region of the eastern Pacific Ocean. Sustained ONI values outside of the +/- 0.5 threshold indicate El Niño or La Niña events.
Click here to download data and charts.
growth in non-resource-intensive economies will be underpinned by continued strong agricultural production and sustained public investment.
vk.com/id446425943
124 C H AP T E R 2 . 6 |
G L O BAL EC O NO M I C P ROS P EC T S | J U NE 2 0 1 9 |
|
|
While per capita GDP growth is expected to improve somewhat, rising to 0.7 percent in 2020 and 0.9 percent in 2021, it will remain insufficient to significantly reduce poverty in the region (Figure 2.6.2.B). In countries where progress is being made in poverty reduction, increased prosperity is not always shared, as economic growth is often concentrated in urban areas with little benefit to the rural poor.
In South Africa, growth is expected to pick up from 1.1 percent in 2019, to 1.5 percent in 2020 and 1.7 percent in 2021. This forecast is predicated on fading policy uncertainty and on a gradual growth dividend from reforms to improve the business environment. Slower growth in the Euro Area—South Africa’s main export destination—is expected to be counterbalanced, in part, by more benign external financing conditions and rising investment spending, reflecting the government’s commitment to accelerate public investment projects in cooperation with the private sector.
Similarly, growth in Angola is expected to strengthen from 1 percent in 2019 to around 2.9 percent in both 2020 and 2021. The improved outlook, particularly for 2020, reflects an increasingly favorable business environment along with a boost from the oil sector as new capacity comes on stream.
In Nigeria, growth is expected at 2.1 percent this year—a weaker-than-expected pace reflecting the continued constraints from foreign exchange restrictions, supply disruptions in the oil sector, and a lack of much-needed reforms to spur new capacity. Growth is projected to remain broadly stable in 2020, before strengthening to 2.4 percent in 2021.
Excluding Angola, Nigeria, and South Africa, regional growth is expected to be more robust, rising from 4.6 percent in 2019 to an average of 5 percent in 2020-21. The cyclical recovery among industrial-commodity exporters will be supported over the forecast period by investment in new oil and natural gas capacity in several oil exporters (Cameroon, Ghana), and increased mining production in some metal-exporting countries, as
new capacity comes on stream (Democratic Republic of the Congo, Guinea). In Sierra Leone, however, mine closures will remain a drag on metals production. Among non-resource-intensive economies, sustained strong public infrastructure spending, combined with increased private sector participation, will continue to support economic activity (Ethiopia, Rwanda, Tanzania, Uganda). In the West African Economic and Monetary Union, these factors will contribute to growth remaining above 6 percent over the next two years.
Risks
The outlook is subject to several downside risks. On the external front, a sharper-than-expected deceleration in activity in key trading partners, including China, the Euro Area, and the United States, could weigh on growth. These three economies together account for more than onethird of the region’s exports and one-fifth of FDI inflows (Figure 2.6.2.C). The slowdown in the Euro Area could be aggravated by a disorderly exit of the United Kingdom from the European Union, while a further escalation of trade tensions between the United States and China could adversely impact activity in both economies. A sharper-than-projected slowdown in China would hit metal exporting countries particularly hard as it accounts for more than one-half of global metals demand (World Bank 2016, 2018i). Lower-than- expected commodity prices pose an additional risk to the outlook, as the region remains highly reliant on commodity export revenues.
Domestically, various developments could weaken fiscal positions. First, while external financing conditions have recently become more benign, they could tighten again if investor sentiment were to deteriorate. This could pose a significant risk to the outlook for countries with elevated debt burdens or where a large share of debt is denominated in foreign currency, as higher interest rates and weaker currencies would raise debt-servicing and refinancing costs, absorb revenues, and constrain poverty-reducing expenditures (Figure 2.6.2.D). Second, stateowned enterprises in some countries (Angola, Ethiopia, Ghana, Mozambique, South Africa),
vk.com/id446425943
G L O BAL EC O NO M I C P ROS P EC T S | J U NE 2 0 1 9 |
S U B - S AH ARAN AF RI C A |
125 |
|
|
|
particularly in the energy sector, have sizable debts that pose an additional contingent liability risk to already indebted governments (Bova et al. 2019). Third, countries holding elections during the next two-and-a-half years together account for onequarter of the region’s GDP, and the risk of fiscal slippages is particularly high, as domestic political considerations could undermine fiscal consolidation efforts (Ethiopia, Ghana, Tanzania, Zambia; Neumann and Ssozi 2015). Fourth, in countries where continued public investment is expected to support growth, the sustainability thereof could weaken if not accompanied by strong public investment management.
Regarding banking sector vulnerabilities, nonperforming loan (NPL) ratios have risen, or remain elevated, among some industrialcommodity exporters (Cameroon, Namibia, Nigeria, South Africa), as weaker growth and softer export revenues have translated into increasingly impaired private sector balance sheets (Figure 2.6.2.E). In Ghana, the large stocks of NPLs are mostly related to state-owned enterprises, and the authorities’ continued measures to help clear them have been contributing to improved credit extension.
Nevertheless, if slower-than-expected growth were to materialize, banking sectors could become even more vulnerable and likely amplify the growth slowdown (Mpofu and Nikolaidou 2018).
Risks that political instability, armed conflicts, or insurgencies may weigh on economic activity are particularly elevated in some economies (Cameroon, Nigeria, Sudan, Zimbabwe). Conflicts and insurgencies, in particular, could lead to forced displacements and hit agricultural production especially hard, reducing incomes and heightening food insecurity in many areas (Adelaja and George 2019). In some countries, a continuation of disappointing growth could become self-perpetuating. As slower growth stifles social progress and poverty reduction efforts, discontent and populist policies could become more widespread. This could further elevate policy uncertainty and undermine investor confidence. The extreme weather events that have afflicted agricultural sectors in Southern and East Africa during the first half of this year include the return of El Niño conditions (Figure 2.6.2.F). More severe droughts than assumed could further suppress agricultural output and exacerbate poverty.

vk.com/id446425943
126 C H AP T E R 2 . 6 G L O BAL EC O NO M I C P ROS P EC T S | J U NE 2 0 1 9
TABLE 2.6.1 Sub-Saharan Africa forecast summary |
|
|
|
|
Percentage point differences |
|||||
|
|
|
|
|
|
|
|
|||
(Real GDP growth at market prices in percent, unless indicated otherwise) |
|
|
|
|
from January 2019 projections |
|||||
|
|
|
|
|
|
|
|
|
|
|
|
2016 |
2017 |
2018e |
2019f |
2020f |
2021f |
|
2019f |
2020f |
2021f |
|
|
|
|
|
|
|
|
|
|
|
EMDE SSA, GDP1 |
1.3 |
2.6 |
2.5 |
2.9 |
3.3 |
3.5 |
|
-0.5 |
-0.3 |
-0.2 |
(Average including countries with full national accounts and balance of payments data only)2 |
|
|
||||||||
EMDE SSA, GDP2,3 |
1.3 |
2.6 |
2.5 |
2.9 |
3.3 |
3.5 |
|
-0.5 |
-0.3 |
-0.2 |
GDP per capita (U.S. dollars) |
-1.4 |
-0.1 |
-0.2 |
0.2 |
0.7 |
0.9 |
|
-0.6 |
-0.2 |
-0.1 |
PPP GDP |
1.6 |
2.9 |
2.8 |
3.1 |
3.5 |
3.7 |
|
-0.6 |
-0.3 |
-0.2 |
Private consumption |
0.0 |
2.2 |
2.0 |
2.2 |
2.7 |
2.8 |
|
-0.6 |
-0.2 |
0.3 |
Public consumption |
-0.4 |
1.1 |
2.6 |
2.6 |
2.5 |
2.7 |
|
-0.3 |
-0.5 |
-0.1 |
Fixed investment |
-0.6 |
4.7 |
5.8 |
5.9 |
6.1 |
6.7 |
|
-1.0 |
-0.9 |
-0.8 |
Exports, GNFS4 |
2.3 |
6.7 |
2.1 |
2.3 |
3.1 |
3.0 |
|
-0.8 |
-0.3 |
-0.1 |
Imports, GNFS4 |
-3.0 |
2.7 |
4.2 |
3.0 |
3.4 |
3.7 |
|
-0.5 |
-0.2 |
-0.1 |
Net exports, contribution to growth |
1.6 |
1.2 |
-0.6 |
-0.2 |
-0.1 |
-0.2 |
|
-0.1 |
0.0 |
0.1 |
Memo items: GDP |
|
|
|
|
|
|
|
|
|
|
|
|
|
|
|
|
|
|
|
|
|
SSA excluding Nigeria, South Africa, |
4.2 |
4.8 |
|
|
|
|
|
|
|
|
4.4 |
4.6 |
4.9 |
5.0 |
|
-0.8 |
-0.5 |
-0.4 |
|||
and Angola |
|
|||||||||
|
|
|
|
|
|
|
|
|
|
|
Oil exporters5 |
-0.7 |
1.5 |
1.4 |
2.1 |
2.5 |
2.6 |
|
-0.8 |
-0.3 |
-0.2 |
CFA countries6 |
2.9 |
3.4 |
4.3 |
5.0 |
5.0 |
5.1 |
|
0.1 |
0.3 |
0.5 |
CEMAC |
-0.8 |
-0.2 |
1.7 |
3.1 |
3.1 |
3.3 |
|
0.1 |
0.5 |
1.0 |
WAEMU |
6.4 |
6.6 |
6.5 |
6.6 |
6.5 |
6.5 |
|
0.2 |
0.1 |
0.2 |
SSA3 |
-0.8 |
0.9 |
1.0 |
1.6 |
2.0 |
2.2 |
|
-0.3 |
-0.1 |
0.1 |
Nigeria |
-1.6 |
0.8 |
1.9 |
2.1 |
2.2 |
2.4 |
|
-0.1 |
-0.2 |
0.0 |
South Africa |
0.6 |
1.4 |
0.8 |
1.1 |
1.5 |
1.7 |
|
-0.2 |
-0.2 |
-0.1 |
Angola |
-2.6 |
-0.1 |
-1.7 |
1.0 |
2.9 |
2.8 |
|
-1.9 |
0.3 |
0.0 |
|
|
|
|
|
|
|
|
|
|
|
Source: World Bank.
Note: e = estimate; f = forecast. EMDE = emerging market and developing economies. World Bank forecasts are frequently updated based on new information and changing (global) circumstances. Consequently, projections presented here may differ from those contained in other Bank documents, even if basic assessments of countries’ prospects do not differ at any given moment in time.
1.GDP at market prices and expenditure components are measured in constant 2010 U.S. dollars. Excludes Central African Republic, São Tomé and Príncipe, Somalia, and South Sudan.
2.Sub-region aggregate excludes Central African Republic, São Tomé and Príncipe, Somalia, and South Sudan, for which data limitations prevent the forecasting of GDP components.
3.Sub-region growth rates may differ from the most recent edition of Africa's Pulse (https://www.worldbank.org/en/region/afr/publication/africas-pulse) due to data revisions and the inclusion of the Central African Republic and São Tomé and Principe in the sub-region aggregate of that publication.
4.Exports and imports of goods and non-factor services (GNFS).
5.Includes Angola, Cameroon, Chad, Republic of Congo, Gabon, Ghana, Nigeria, and Sudan.
6.Includes Benin, Burkina Faso, Cameroon, Central African Republic, Chad, Republic of Congo, Côte d’Ivoire, Equatorial Guinea, Gabon, Mali, Niger, Senegal, and Togo.
Click here to download data.

vk.com/id446425943
G L O BAL EC O NO M I C P ROS P EC T S | J U NE 2 0 1 9 S U B - S AH ARAN AF RI C A 127
TABLE 2.6.2 Sub-Saharan Africa country forecasts1 |
|
|
|
Percentage point differences |
||||||
(Real GDP growth at market prices in percent, unless indicated otherwise) |
|
|
|
from January 2019 projections |
||||||
|
|
|
|
|
|
|
|
|
|
|
|
2016 |
2017 |
2018e |
2019f |
2020f |
2021f |
|
2019f |
2020f |
2021f |
Angola |
-2.6 |
-0.1 |
-1.7 |
1.0 |
2.9 |
2.8 |
|
-1.9 |
0.3 |
0.0 |
Benin |
4.0 |
5.8 |
6.5 |
6.5 |
6.5 |
6.5 |
|
0.3 |
0.0 |
-0.1 |
Botswana |
4.3 |
2.9 |
4.5 |
4.2 |
3.9 |
4.0 |
|
0.3 |
-0.2 |
-0.1 |
Burkina Faso |
5.9 |
6.3 |
6.8 |
6.0 |
6.0 |
6.0 |
|
0.0 |
0.0 |
0.0 |
Burundi |
-0.6 |
0.5 |
1.6 |
1.8 |
2.1 |
2.0 |
|
-0.5 |
-0.4 |
-0.8 |
Cabo Verde |
4.7 |
4.0 |
4.5 |
4.4 |
4.6 |
4.7 |
|
-0.3 |
-0.3 |
-0.2 |
Cameroon |
4.6 |
3.5 |
4.0 |
4.2 |
4.4 |
4.6 |
|
0.0 |
-0.1 |
0.1 |
Chad |
-6.3 |
-3.0 |
2.6 |
3.4 |
5.6 |
4.8 |
|
-1.2 |
-0.5 |
-0.1 |
Comoros |
2.2 |
2.7 |
2.8 |
3.1 |
3.2 |
3.2 |
|
0.0 |
0.1 |
0.1 |
Congo, Dem. Rep. |
2.4 |
3.7 |
5.8 |
5.9 |
6.5 |
6.8 |
|
1.3 |
1.0 |
0.9 |
Congo, Rep. |
-2.8 |
-3.1 |
0.8 |
5.4 |
1.5 |
1.9 |
|
2.2 |
1.6 |
3.4 |
Côte d’Ivoire |
8.0 |
7.7 |
7.4 |
7.4 |
7.3 |
7.3 |
|
0.1 |
-0.1 |
0.5 |
Equatorial Guinea |
-8.8 |
-4.7 |
-2.9 |
-2.2 |
-1.9 |
-1.8 |
|
-0.1 |
3.9 |
4.0 |
Eswatini |
3.2 |
1.9 |
0.5 |
1.1 |
1.6 |
1.7 |
|
-0.6 |
-0.2 |
-0.1 |
Ethiopia2 |
7.6 |
10.2 |
7.9 |
7.9 |
8.2 |
8.2 |
|
-0.9 |
-0.7 |
-0.7 |
Gabon |
2.1 |
0.5 |
0.8 |
2.8 |
3.7 |
3.9 |
|
-0.2 |
0.0 |
0.2 |
Gambia, The |
0.4 |
4.6 |
6.6 |
5.4 |
5.2 |
5.0 |
|
0.0 |
0.0 |
-0.2 |
Ghana |
3.4 |
8.1 |
6.3 |
7.6 |
7.0 |
5.8 |
|
0.3 |
1.0 |
-0.2 |
Guinea |
10.5 |
10.6 |
5.8 |
5.9 |
6.0 |
6.0 |
|
0.0 |
0.0 |
0.0 |
Guinea-Bissau |
6.3 |
5.9 |
3.8 |
4.3 |
4.8 |
5.5 |
|
0.1 |
0.4 |
1.0 |
Kenya |
5.9 |
4.9 |
6.3 |
5.7 |
5.9 |
6.0 |
|
-0.1 |
-0.1 |
0.0 |
Lesotho |
3.1 |
-0.4 |
1.7 |
1.5 |
0.4 |
4.1 |
|
0.3 |
0.2 |
2.3 |
Liberia |
-1.6 |
2.5 |
1.2 |
0.4 |
1.6 |
1.3 |
|
-4.1 |
-3.2 |
-3.5 |
Madagascar |
4.2 |
4.3 |
5.2 |
5.2 |
5.3 |
5.1 |
|
-0.2 |
0.0 |
-0.2 |
Malawi |
2.5 |
4.0 |
3.5 |
4.5 |
4.7 |
5.1 |
|
0.2 |
-0.6 |
-0.4 |
Mali |
5.8 |
5.3 |
4.9 |
5.0 |
4.9 |
4.8 |
|
0.0 |
0.0 |
0.0 |
Mauritania |
2.0 |
3.0 |
3.6 |
6.7 |
5.8 |
6.0 |
|
1.8 |
-1.1 |
-0.9 |
Mauritius |
3.8 |
3.8 |
3.8 |
3.9 |
3.9 |
3.5 |
|
-0.1 |
0.3 |
-0.1 |
Mozambique |
3.8 |
3.7 |
3.3 |
2.0 |
3.5 |
4.2 |
|
-1.5 |
-0.6 |
0.1 |
Namibia |
1.1 |
-0.9 |
-0.1 |
0.9 |
1.5 |
1.9 |
|
-0.9 |
-0.6 |
-0.2 |
Niger |
4.9 |
4.9 |
5.2 |
6.5 |
6.0 |
5.6 |
|
0.0 |
0.0 |
0.0 |
Nigeria |
-1.6 |
0.8 |
1.9 |
2.1 |
2.2 |
2.4 |
|
-0.1 |
-0.2 |
0.0 |
Rwanda |
6.0 |
6.1 |
8.6 |
7.8 |
8.0 |
7.5 |
|
0.0 |
0.0 |
-0.5 |
Senegal |
6.2 |
7.2 |
6.8 |
6.8 |
7.0 |
7.0 |
|
0.2 |
0.2 |
0.1 |
Seychelles |
4.5 |
5.3 |
3.6 |
3.4 |
3.0 |
3.2 |
|
0.0 |
-0.3 |
0.3 |
Sierra Leone |
6.4 |
3.8 |
3.7 |
5.4 |
5.4 |
5.2 |
|
0.3 |
-0.9 |
-1.1 |
South Africa |
0.6 |
1.4 |
0.8 |
1.1 |
1.5 |
1.7 |
|
-0.2 |
-0.2 |
-0.1 |
Sudan |
4.7 |
4.3 |
-2.3 |
-1.9 |
-1.3 |
-0.8 |
|
-5.5 |
-5.1 |
-4.6 |
Tanzania |
6.9 |
6.8 |
6.0 |
5.4 |
5.7 |
6.1 |
|
-1.4 |
-1.3 |
-0.9 |
Togo |
5.2 |
4.3 |
4.9 |
5.0 |
5.2 |
5.1 |
|
0.2 |
0.1 |
0.0 |
Uganda2 |
4.6 |
3.9 |
5.9 |
6.1 |
6.5 |
5.8 |
|
0.1 |
0.1 |
-0.7 |
Zambia |
3.6 |
3.4 |
3.5 |
2.5 |
2.8 |
2.8 |
|
-1.1 |
-1.0 |
-1.0 |
Zimbabwe |
0.8 |
4.7 |
3.5 |
-3.1 |
3.5 |
4.9 |
|
-6.8 |
-0.5 |
0.9 |
|
|
|
|
|
|
|
|
|
|
|
Source: World Bank.
Note: e = estimate; f = forecast. World Bank forecasts are frequently updated based on new information and changing (global) circumstances. Consequently, projections presented here may differ from those contained in other Bank documents, even if basic assessments of countries’ prospects do not significantly differ at any given moment in time.
1.GDP at market prices and expenditure components are measured in constant 2010 U.S. dollars. Excludes Central African Republic, São Tomé and Príncipe, Somalia, and South Sudan.
2.Fiscal-year based numbers.
Click here to download data.
vk.com/id446425943
128 C H AP TE R 2 |
G L O BAL E CO N O MI C P ROS PE C TS | J U NE 2 0 19 |
|
|
REFERENCES
Adelaja, A., and J. George. 2019. “Effects of Conflict on Agriculture: Evidence from the Boko Haram insurgency.” World Development 117: 184-195.
Aretzki, R., D. Lederman, A. Abou Harb, Y. Fan, H. M. Nguyen, L. Mottaghi, and C. Wood. 2019. MENA Economic Update. Reforms and External Imbalances: The Labor-Productivity Connection in the Middle East and North Africa. April. Washington, DC.
Aritua, B., Havenga, J., Simpson, Z. P., John, E. and L. Woon. 2018. “Unlocking India’s Logistics Potential: the Value of Disaggregated Macroscopic Freight Flow Analysis.” Policy Research Working Paper 8337, World Bank, Washington DC.
Bahar, D., and D. Barrios. 2018. “How Many More Migrants Can We Expect Out of Venezuela?” Up Front (blog), Brookings, December 10. https:// www.brookings.edu/blog/up-front/2018/12/10/how- many-more-migrants-and-refugees-can-we-expect-out- of-venezuela/.
Beyer, R. C, M. and M. Lazar. 2019. “Fiscal Policy and Economic Activity in South Asia.” Policy Research Working Paper 8792, World Bank, Washington DC.
Bova, E., M. Ruiz-Arranz, F. G. Toscani, and H. E. Ture. 2016. “The Fiscal Costs of Contingent Liabilities: A New Dataset.” IMF Working Paper 16/14, International Monetary Fund, Washington, DC.
———. 2019. “The Impact of Contingent Liability Realizations on Public Finances.” International Tax and Public Finance 26 (2): 381-417.
Bussolo, M., J. Koettl, and E. Sinnott. 2015. Golden Aging: Prospects for Healthy, Active, and Prosperous Aging in Europe and Central Asia. Washington, DC: World Bank.
Central Bank of Brazil. 2019. “Inflation Report.”
Volume 21, Number 1. Central Bank of Brazil,
Brasília.
EBRD (European Bank for Reconstruction and Development). 2015. Transition Report 2015-16: Rebalancing Finance. London: European Bank for Reconstruction and Development .
———. 2017. Transition Report 2017-18: Sustaining Growth. London: European Bank for Reconstruction and Development.
———. 2018. Transition Report 2018-19: Work in Transition. London: European Bank for Reconstruction and Development.
Freund, C., M. J. Ferrantino, M. Maliszewska, and M. Ruta. 2018. “Impacts on Global Trade and Income of Current Trade Disputes.” MTI Practice Note, Number 2, World Bank, Washington, DC.
Funke, N., A. Isakova, and M. Ivanyna. 2017. “Identifying Structural Reform Gaps in Emerging Europe, the Caucasus, and Central Asia.” IMF Working Paper WP/17/82, International Monetary Fund, Washington, DC.
Grainger, C. A. and F. Zhang. 2017. “The Impact of Electricity Shortages on Firm Productivity: Evidence from Pakistan.” Policy Research Working Paper 8130, World Bank, Washington DC.
Gould, D. 2018. Critical Connections: Promoting Economic Growth and Resilience in Europe and Central Asia. Europe and Central Asia Studies. Washington, DC: World Bank.
Kose, M. A., S. Kurlat, F. L. Ohnsorge, and N. Sugawara. 2017. “A Cross-Country Database of Fiscal Space.” Policy Research Working Paper 8157, World Bank, Washington, DC.
Kunzel, P., P. de Imus, E. Gemayel, R. Herrala, A. Kireyev, and F. Talishli. 2019. “Opening Up in the Caucasus and Central Asia: Policy Frameworks to Support Regional and Global Integration.” IMF Departmental Paper No. 18/07, International Monetary Fund, Washington, DC.
Mpofu, T.R., and E. Nikolaidou. 2018. “Determinants of Credit Risk in the Banking System in Sub-Saharan Africa.” Review of Development Finance 8 (2): 141-153.
Neumann, R., and J. Ssozi. 2015. “Political Influence on Fiscal and Monetary Policy in Sub-Saharan Africa.” Journal of African Economies 25 (1): 55-109.
SCPRC (The State Council of the People’s Republic of China). 2019. “Report on the Work of the Government.” Speech at the Second Session of the 13th National People’s Congress of the People’s Republic of China. http://english.gov.cn/premier/ speeches/2019/03/16/content_281476565265580.htm
UNHCR (United Nations High Commissioner for Refugees). 2019. “Guidance Note on International Protection Considerations for Venezuelans – Update I.” UNHCR, Geneva.
vk.com/id446425943
G L O BAL E CO N O MI C P ROS PE C TS | J U NE 2 0 19 |
C H AP TE R 2 |
129 |
|
|
|
World Bank. 2016. Global Economic Prospects: Spillovers amid Weak Growth. January. Washington, DC: World Bank.
———. 2018a. Global Economic Prospects: Broad-Based Upturn, but for How Long? January. Washington, DC: World Bank.
———. 2018b. East Asia and Pacific Economic Update: Enhancing Potential. April. Washington, DC: World Bank.
———.2018c. Global Economic Prospects: The Turning of the Tide? June. Washington, DC: World Bank.
———.2018d. “Migración desde Venezuela a Colombia: Impactos y Estrategia de Respuesta en el Corto y Mediano Plazo.” World Bank, Washington,
DC.
———.2018e. Pakistan Development Update 2018: At a Crossroad. Fall. World Bank, Washington DC.
———.2018f. Bangladesh Development Update: Powering the Economy Efficiently. Fall. World Bank,
Washington DC.
———. 2018g. Nepal Development Update: Maximizing Finance for Development. Fall. World Bank, Washington DC.
———.2018h. South Asia Economic Focus: Budget Crunch. Fall. World Bank, Washington DC.
———.2018i. Commodity Market Outlook. The Changing of the Guard: Shifts in Commodity Demand.
October. Washington, DC: World Bank.
———. 2019c. Western Balkans Regular Economic Report: Reform Momentum Needed. Spring. Washington, DC: World Bank.
———. 2019d. “Migration and Remittances: Recent Developments and Outlook.” Migration and Development Brief 31, World Bank, Washington, DC.
———. 2019e. The Middle East and North Africa: From Transition to Transformation. Washington, DC: World Bank.
———. 2019f. Gulf Economic Monitor. Building the Foundations for Economic Sustainability. May. World Bank, Washington, DC.
———. 2019g. The Mobility of Displaced Syrians: An Economic and Social Analysis. Washington, DC: World Bank.
———.2019h. South Asia Economic Focus: Exports Wanted. Spring. World Bank, Washington DC.
———.2019i. Sri Lanka Development Update: Navigating Sri Lanka’s Demographic Change. Spring.
World Bank, Washington DC.
———.2019j. Global Economic Prospects: Darkening Skies. January. Washington, DC: World Bank.
———.2019k. Africa’s Pulse: An Analysis of Issues Shaping Africa’s Economic Future. April. Washington,
DC: World Bank.
———. 2019. Forthcoming. India Development Update. World Bank, Washington DC.
———.2019a. East Asia and Pacific Economic Update.
April. Washington, DC: World Bank.
———.2019b. Europe and Central Asia Economic Update: Financial Inclusion. April. Washington, DC:
World Bank.
Youssef, H., and C. Zaki. 2019. “From Currency Depreciation to Trade Reform: How to Take Egyptian Exports to New Levels?” Policy Research Working Paper 8809, World Bank, Washington, DC.
vk.com/id446425943