

Global Economic Prospects -World Bank_watermark
.pdfvk.com/id446425943
G L O BAL EC O NO M I C P ROS P EC T S | J U NE 2 0 1 9 |
S P EC I AL F O CU S 2 . 1 |
141 |
|
|
|
New LICs: 2016-19. Countries that have reached MIC status often face structural challenges that constrain their prospects for continued strong growth, while those MICs with incomes near the LIC threshold risk falling back into the LIC bracket (EBRD 2019). Four countries were classified as LICs between 2016 and 2019 from middle-income levels: Senegal, Syria, Tajikistan, and Yemen. While Syria was classified as a LIC for the first time, Senegal, Tajikistan, and Yemen relapsed into LIC status after some of the growth-enhancing factors discussed above had helped them move to middle-income status in earlier years.
•Senegal suffered a series of adverse shocks in the years leading up to its relapse, which weighed heavily on per capita incomes. The decline in commodity prices from 2011 was aggravated by two consecutive droughts that severely disrupted agricultural production between 2011 and 2014 and also led to widespread famine, while a long-lasting domestic energy crisis repeatedly disrupted economic activity until the mid-2010s.
•In Tajikistan, robust growth was accompanied by a halving of its currency’s value stemming from the 2014-16 commodity price slump and by rapid population growth; as a result, per capita incomes declined.
•Armed conflicts in Syria and Yemen caused sharp declines in per capita incomes in both countries by severely disrupting activity, destroying physical infrastructure, and forcibly displacing more than one-half of Syria’s population and almost a tenth of the population in Yemen (World Bank 2017a, 2019d). In both countries, oil production has fallen by 90 percent from pre-war levels, sharply constraining fiscal positions.
Prospects for further LIC progression
Challenges for future progression towards MIC per capita income levels. Prospects for most of today’s LICs to progress to MIC levels in the near future are dim, as the factors that may hold back
FIGURE SF2.1.5 Features of today’s LICs
For today’s LICs, prospects of becoming MICs are dim. More than half of them are affected by fragility, conflict, and violence, their governments are less effective than those of the 2001 LICs that became MICs, and public spending on health care is lower. Many countries are landlocked, and their neighbors are mostly low-income or lower-middle-income countries. LICs are heavily dependent on agriculture, which faces severe challenges as extreme weather events become more frequent.
A. LICs affected by fragility, conflict, |
B. Distribution of LICs per capita |
and violence |
incomes as percent of non-LIC |
|
EMDEs average |
C. Average share of public healthcare spending in LIC GDP
E. Share of agriculture in the economy
D. Per capita incomes in LICs’ neighbors
F. Extreme weather events in LICs
Source: The Emergency Events Database—Universite Catholique de Louvain, World Bank, World Bank Doing Business, World Bank staff calculations, World Development Indicators.
Note: “LICs turned MICs” are those LICs in 2001 that have achieved MIC per capita incomes by 2019; “Continued LICs” are LICs that have remained LICs since 2001. FCV = fragility, conflict, and violence. UMIC = upper-middle-income country.
A.Bars for 2001 “LICs turned MICs” reflect shares in 2001, bars for 2019 LICs reflect latest shares. Due to data limitations, official FCV country classifications for 2001 are not available. This share is based on the World Bank FCV country classification of the 2005/06 fiscal year that has been amended to include countries that had the presence of UN peace-keeping missions between 1999 and 2001.
B.Blue bars represent share of 2001 LICs in 2001, red bars represent share of 2019 LICs in 2017. X-axis reflects ranges of LIC per capita incomes relative to that of the US, in percent. 2001 LICs includes 58 countries, 2019 LICs includes 28 countries.
C.Unweighted averages. 2001 LICs, “LICs turned MICs” and “Continued LICs” include 60, 32,
and 28 countries, respectively. 2019 LICs, non-FCV and FCV LICs include 31, 14, and 17 countries, respectively.
D.Unweighted averages. Neighbors of LICs only include countries with shared land borders. Sample includes 16 landlocked 2001 “LICs turned MICs”, 15 2019 landlocked LICs and 8 2019 landlocked non-FCV LICs.
E.Unweighted averages.
F.Data reflect annual averages of extreme weather events in the LICs of 2019.
Click here to download data and charts.

vk.com/id446425943
142 S P EC I AL F O CU S 2 . 1 |
G L O BAL EC O NO M I C P ROS P EC T S | J U NE 2 0 1 9 |
|
|
progression are more pervasive today than they were in the 2001 LICs (Figure SF2.1.5.A).
•Weaker starting positions. The gaps between per capita incomes in today’s LICs and in middle-income countries are larger than the corresponding gaps faced by the LICs of 2001 that subsequently became MICs (Figure SF2.1.5.B). Comparing today’s LICs with those that have become MICs, public spending on health care relative to GDP is lower by one-quarter, the share of their populations with access to electricity is lower by one-third, and measures of financial inclusion are lower by one-half to onequarter (Figure SF2.1.5.C).13
•Fragile or in conflict. 56 percent of today’s LICs are countries affected by fragility, conflict, and violence (FCV)—about onethird more than the share of countries in conflict among the 2001 LICs that became MICs.14 In these FCVs, weak governments and poor institutions are endemic. Government revenues in these countries are often lower than in other LICs, leaving them heavily dependent on foreign aid to finance critical government spending (IMF 2014). Their economies are volatile and prone to collapses (World Bank 2017b). Since 1990, chronic FCVs—countries that have been FCVs for at least five years—have faced annual output contractions of 3 percent or more at least once every decade.
•Clustered. More than half of the LICs that are not FCVs are landlocked, and their neighbors are mostly other LICs or countries with per capita incomes just above middle-income thresholds (Figure SF2.1.5.D). This geographical disadvantage—often exacerbated
13While mobile payment systems have improved financial inclusion in LICs, limited access to electricity, particularly in rural areas, severely constrains the charging of mobile phones (Max and Berman 2018; Riley and Kulathunga 2017, World Bank Group and China Development Bank 2017).
14Due to data limitations, official FCV country classifications for 2001 are not available. This share is based on the World Bank FCV country classification of the 2005/06 fiscal year that has been amended to include countries with UN peace-keeping missions between 1999 and 2001.
by high trade costs and behind-the-border non-tariff barriers—limits LICs’ ability to unleash a growth burst by encouraging trade with large trading partner economies (Arvis, Raballand, and Marteau 2010; Arvis et al. 2013; Paudel and Cooray 2018).
•Heavily reliant on agriculture. All but two (Yemen, Zimbabwe) of today’s LICs are heavily dependent on the agricultural sectors which accounts for almost 30 percent of GDP on average compared with 9 percent of GDP in the average non-LIC EMDE (Figure SF2.1.5.E). In 70 percent of today’s LICs (considerably more than the 40 percent of 2001 LICs that became MICs) agriculture accounts for more than one-quarter of the economy. Climate change is presenting many of these agricultural sectors with severe challenges as mean temperatures continue to rise and extreme weather events such as droughts, floods, and heatwaves occur more frequently and with greater intensity than in the 1980s and 1990s (Figure SF2.1.5.F; World Bank 2017b; IPCC 2014; Chaney et al. 2014; Hoeppe 2014). Recoveries from droughts appear to be taking longer, resulting in less time for livelihoods to be restored between droughts and thereby rendering countries even more vulnerable to the adverse impacts of climate change (Schwalm 2017). Climate-related destruction of crops and livelihoods could push many LIC populations further into poverty and this is aggravated by the limited capacity and resources of LICs to counter the adverse effects of climate change (Hallegatte et al. 2016).
•Weaker prospects for commodity demand. To transform recent resource discoveries in LICs into strong, sustained economic growth will require continued robust commodity demand
growth, as well as strong governance and
15 Mozambique’s deep-water gas fields are estimated to hold more oil-equivalent reserves than are held by Angola or Nigeria—Sub- Saharan Africa’s two largest oil producers—and production is set to start by 2022/23 (World Bank 2015a). Oil reserves in Uganda are estimated to be the fourth-largest in Sub-Saharan Africa, and production could start within the next three years (Alkadiri and Tesfay 2014). Large off-shore gas fields were recently discovered in Tanzania.
vk.com/id446425943
G L O BAL EC O NO M I C P ROS P EC T S | J U NE 2 0 1 9 |
S P EC I AL F O CU S 2 . 1 |
143 |
|
|
|
institutions to manage the associated revenue windfalls (Addison and Roe 2018).15 However, long-term prospects for commodity demand are weakening as growth in China— the largest source of commodity demand— slows and shifts towards less resource-intensive sectors (World Bank 2018a).
•Debt vulnerabilities on the rise. While government debt ratios in most of today’s LICs are significantly lower than in 2001—helped largely by debt relief initiatives—their general rise since 2013 has contributed to increased vulnerabilities (World Bank 2019a). The interest burden brought about by greater indebtedness could constrain povertyreducing expenditures, particularly on health and education.
Conclusion
Growth in low-income countries has benefited from a confluence of favorable cyclical and structural developments since 2001 that have reduced the number of LICs by almost one-half. These factors have, at various points, included a commodity price boom, cyclical rebounds from the collapse of centrally-planned regimes in the early-1990s, debt relief, fewer armed conflicts (especially in Africa), trade integration, and improved business climates and policy frameworks. However, the cyclical factors that contributed to LICs reaching MIC status were either unique events (transition rebounds) or are unlikely to be repeated over the foreseeable future (commodity boom), while structural factors that could support growth present lasting policy challenges that will require various policy reform efforts. Prospects for progression of today’s LICs to middle-income status are, therefore, more challenging. Compared to the LICs of 2001 that became MICs, today’s LICs have per capita incomes that are further below the middle-income threshold, are more likely to be fragile, are more often landlocked and clustered with other LICs, are heavily reliant on agriculture, and face weaker prospects for long-term commodity demand.
Poverty implications. Today’s LICs account for about 40 percent of the global poor and have
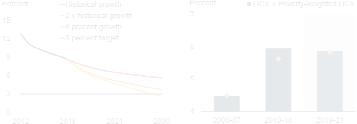
FIGURE SF2.1.6 Challenges LICs face in reducing poverty
For the world to reach the Sustainable Development Goal of reducing extreme poverty to 3 percent, per capita incomes will need to grow by 6 percent per year until 2030, but with the condition that incomes in the bottom 40 percent of the income distribution grow by 8 percent per year. Growth is expected to fall well short of this requirement.
A. Projections of global extreme |
B. LIC growth |
poverty |
|
Source: World Bank, World Bank (2018b).
A.Data based on global real per capita growth. 8 percent growth assumes average annual growth in per capita incomes of 6 percent for all countries, but that incomes of the bottom 40 percent of the distribution grow at 8 percent, while those in the top 60 percent grow at 4.7 percent.
B.Bars represented GDP-weighted aggregates. Diamonds represent GDP aggregates weighted according to each country’s share in total poverty.
Click here to download data and charts.
average poverty rates in excess of 40 percent. Subdued prospects for lifting average per capita incomes in most of today’s 34 LICs to middleincome levels pose a challenge for achieving the Sustainable Development Goals and reducing global extreme poverty to 3 percent by 2030. To reach this goal, per capita GDP would need to grow by 6 percent per year up to 2030 and per capita incomes of the bottom 40 percent of the income distribution would need to grow at 8 percent per year (Figure SF2.1.6.A; World Bank 2018b). Even during the global economic expansion that preceded the global financial crisis, per capita growth in LICs fell well below such rates (1.9 percent during 2001-07). Overall growth in LICs since the global financial crisis has been lower when growth is weighted according to the share of the world’s extreme poor as opposed to output shares, implying that growth has been slower where it is needed most: in countries with the largest numbers of extreme poor (Figure SF2.1.6.B).
Policy implications. Coordinated and multipronged policy efforts are needed to boost both domestic and external drivers of LICs growth. Efforts to harness external drivers of growth include integrating LICs into global trade,
vk.com/id446425943
144 S P EC I AL F O CU S 2 . 1 |
G L O BAL EC O NO M I C P ROS P EC T S | J U NE 2 0 1 9 |
|
|
diversifying exports, and encouraging foreign direct investment (Lee and Zhang 2019). Domestically, this can help embody upgrades to skills and technologies, but needs to be supported by continued investment in human and physical capital, while maintaining sustainable government debt profiles. Further efforts to foster domestic sources of growth include developing stronger and deeper financial systems, ensuring greater financial inclusiveness, and strengthening governance and business climates to help the private sector to thrive while overcoming some of the challenges of
informality (EBRD 2019; World Bank 2017c; 2018c; 2019a). Enhanced competition policies, including the liberalization of unwarranted price controls, can encourage innovation, boost productivity and improve international competitiveness (World Bank 2016c; 2017d). Growth could further be supported by measures aimed at ending conflicts and reducing social tensions, mobilizing domestic resources more effectively for sustainable government finances, and managing and adapting to growing climate risks.
TABLE SF2.1.1 Low-income countries
|
GNI per capita used for |
Latest GNI per |
GNI per capita used for 2001 |
Share of agriculture in |
Share of primary |
|
2019 income classification |
capita |
income classification |
GDP (percent) |
commodity exports |
|
(2017, USD) |
(2017, USD) |
(1999, USD) |
|
in GDP (percent) |
2001 LICs turned MICs |
|
|
|
|
|
|
|
|
|
|
|
Turkmenistan |
6,650 |
6,380 |
660 |
… |
… |
|
|
|
|
|
|
Azerbaijan |
4,080 |
4,080 |
550 |
5.6 |
30.2 |
|
|
|
|
|
|
Armenia |
4,000 |
3,990 |
490 |
14.9 |
8.3 |
|
|
|
|
|
|
Georgia |
3,790 |
3,780 |
620 |
6.9 |
6.2 |
|
|
|
|
|
|
Indonesia |
3,540 |
3,540 |
580 |
13.1 |
5.9 |
|
|
|
|
|
|
Angola |
3,330 |
3,570 |
220 |
10.0 |
28.4 |
|
|
|
|
|
|
Mongolia |
3,290 |
3,270 |
350 |
10.3 |
46.7 |
|
|
|
|
|
|
Bhutan |
2,720 |
2,660 |
510 |
17.4 |
… |
|
|
|
|
|
|
Ukraine |
2,390 |
2,390 |
750 |
10.2 |
13.8 |
|
|
|
|
|
|
Sudan* |
2,380 |
2,380 |
330 |
30.5 |
11.2 |
|
|
|
|
|
|
Lao PDR |
2,270 |
2,270 |
280 |
16.2 |
8.0 |
|
|
|
|
|
|
Moldova, Rep. |
2,180 |
2,200 |
370 |
… |
3.5 |
|
|
|
|
|
|
Vietnam |
2,170 |
2,160 |
370 |
15.3 |
5.1 |
|
|
|
|
|
|
Nicaragua |
2,130 |
2,130 |
430 |
15.5 |
1.5 |
|
|
|
|
|
|
Nigeria |
2,080 |
2,100 |
310 |
20.8 |
11.4 |
|
|
|
|
|
|
Uzbekistan |
1,980 |
2,000 |
720 |
… |
… |
|
|
|
|
|
|
Solomon |
1,920 |
1,920 |
750 |
… |
27.8 |
Islands* |
|
|
|
|
|
India |
1,820 |
1,800 |
450 |
15.5 |
1.2 |
|
|
|
|
|
|
São Tomé and |
1,770 |
1,770 |
270 |
11.5 |
… |
Príncipe |
|
|
|
|
|
Pakistan |
1,580 |
1,580 |
470 |
22.9 |
0.3 |
|
|
|
|
|
|
Côte d’Ivoire* |
1,540 |
1,580 |
710 |
21.6 |
5.7 |
|
|
|
|
|
|
Ghana |
1,490 |
1,880 |
390 |
19.7 |
7.1 |
|
|
|
|
|
|
Bangladesh |
1,470 |
1,470 |
370 |
13.4 |
0.1 |
|
|
|
|
|
|
Kenya |
1,440 |
1,460 |
360 |
34.6 |
1.4 |
|
|
|
|
|
|
Cameroon |
1,360 |
1,370 |
580 |
14.4 |
12.7 |
|
|
|
|
|
|
Congo, Rep.* |
1,360 |
1,430 |
670 |
6.4 |
44.0 |
|
|
|
|
|
|
Zambia |
1,300 |
1,290 |
320 |
6.7 |
25.4 |
|
|
|
|
|
|
Lesotho |
1,280 |
1,210 |
550 |
6.1 |
… |
|
|
|
|
|
|
Cambodia |
1,230 |
1,230 |
260 |
23.4 |
1.1 |
|
|
|
|
|
|
vk.com/id446425943
G L O BAL EC O NO M I C P ROS P EC T S | J U NE 2 0 1 9 |
S P EC I AL F O CU S 2 . 1 |
145 |
|
|
|
TABLE SF2.1.1 Low-income countries (CONTINUED)
|
GNI per capita used for |
Latest GNI per |
GNI per capita used for 2001 |
Share of agriculture in |
Share of primary |
|
2019 income classification |
capita |
income classification |
GDP (percent) |
commodity exports |
|
(2017, USD) |
(2017, USD) |
(1999, USD) |
|
in GDP (percent) |
|
|
|
|
|
|
2001 LICs turned MICs |
|
|
|
|
|
|
|
|
|
|
|
Myanmar* |
1,190 |
1,210 |
… |
23.3 |
… |
|
|
|
|
|
|
Kyrgyz Republic |
1,130 |
1,130 |
300 |
12.3 |
4.1 |
|
|
|
|
|
|
Mauritania |
1,100 |
1,100 |
380 |
23.1 |
16.3 |
2001 Continued LICs |
|
|
|
|
|
|
|
|
|
|
|
Tajikistan |
990 |
990 |
290 |
… |
… |
|
|
|
|
|
|
Senegal |
950 |
1,240 |
510 |
16.0 |
2.3 |
|
|
|
|
|
|
Tanzania |
910 |
910 |
240 |
… |
0.7 |
|
|
|
|
|
|
Zimbabwe* |
910 |
1,170 |
520 |
8.3 |
3.8 |
|
|
|
|
|
|
Benin |
800 |
800 |
380 |
23.0 |
4.3 |
|
|
|
|
|
|
Guinea |
800 |
790 |
510 |
16.4 |
6.9 |
|
|
|
|
|
|
Nepal |
790 |
800 |
220 |
26.2 |
0.3 |
|
|
|
|
|
|
Mali* |
770 |
770 |
240 |
38.3 |
1.1 |
|
|
|
|
|
|
Comoros* |
760 |
1,280 |
350 |
29.9 |
0.0 |
|
|
|
|
|
|
Haiti* |
760 |
760 |
460 |
17.6 |
… |
|
|
|
|
|
|
Ethiopia |
740 |
740 |
100 |
34.0 |
0.0 |
|
|
|
|
|
|
Rwanda |
720 |
720 |
250 |
31.0 |
1.3 |
|
|
|
|
|
|
Guinea-Bissau* |
660 |
660 |
160 |
49.0 |
0.0 |
|
|
|
|
|
|
Chad* |
630 |
640 |
200 |
49.1 |
… |
|
|
|
|
|
|
Burkina Faso |
610 |
590 |
240 |
28.7 |
5.4 |
|
|
|
|
|
|
Togo* |
610 |
610 |
320 |
41.8 |
3.9 |
|
|
|
|
|
|
Uganda |
600 |
600 |
320 |
24.6 |
0.8 |
|
|
|
|
|
|
Afghanistan* |
570 |
560 |
… |
20.5 |
… |
|
|
|
|
|
|
Sierra Leone |
510 |
510 |
130 |
60.3 |
0.7 |
|
|
|
|
|
|
Congo, Dem. |
450 |
460 |
110 |
19.9 |
… |
Rep.* |
|
|
|
|
|
|
|
|
|
|
|
Gambia, The* |
450 |
680 |
340 |
23.0 |
0.5 |
|
|
|
|
|
|
Mozambique* |
420 |
420 |
230 |
21.3 |
31.1 |
|
|
|
|
|
|
Madagascar |
400 |
400 |
250 |
20.0 |
6.0 |
|
|
|
|
|
|
Central African |
390 |
390 |
290 |
39.6 |
… |
Republic* |
|
|
|
|
|
|
|
|
|
|
|
Liberia* |
380 |
620 |
… |
37.1 |
… |
|
|
|
|
|
|
Niger |
360 |
360 |
190 |
39.7 |
4.1 |
|
|
|
|
|
|
Malawi |
320 |
320 |
190 |
26.1 |
0.9 |
|
|
|
|
|
|
Burundi* |
290 |
280 |
120 |
… |
0.3 |
|
|
|
|
|
|
Eritrea* |
… |
… |
200 |
… |
… |
|
|
|
|
|
|
Korea, Dem. |
… |
… |
… |
… |
… |
People’s Rep. |
|
|
|
|
|
|
|
|
|
|
|
Somalia* |
… |
… |
… |
… |
… |
Yemen* |
… |
… |
350 |
6.0 |
… |
|
|
|
|
|
|
New LICs |
|
|
|
|
|
|
|
|
|
|
|
Syria* |
… |
… |
970 |
… |
… |
|
|
|
|
|
|
Source: World Bank World Development Indicators, World Integrated Trade Statistics.
Notes: Asterisks indicate economies affected by fragility, conflict, and violence (FCV). Ellipses indicate data unavailability. GNI per capita according to the World Bank Atlas method. GNI per capita for 1999 was published in August 2000 and reflects the original data used for country income classification in the 2001 World Bank fiscal year, while GNI per capita for 2017 was published in October 2018 and reflects the data used for the 2019 World Bank fiscal year. Latest GNI per capita incorporates data revisions that have occurred since the release of original GNI per capita data that was used for income classifications. South Sudan is also a new LIC, but not included in the table because it only gained independence in 2011; data not available.
vk.com/id446425943
146 S P EC I AL F O CU S 2 . 1 |
G L O BAL EC O NO M I C P ROS P EC T S | J U NE 2 0 1 9 |
|
|
References
Addison, T., and A. Roe, eds. 2018. Extractive Industries: The Management of Resources as a Driver of Sustainable Development. New York: Oxford University Press.
Aker J. C. 2011. “Dial ‘A’ for Agriculture: Using ICTs for Agricultural Extension in Developing Countries.”
Agricultural Economics 42 (6): 631-47.
Aker, J. C., and I. M. Mbiti. 2010. “Mobile Phones and Economic Development in Africa.” Journal of Economic Perspectives 24 (3): 207-32.
Alkadiri, R., and N. Tesfay. 2014. “Africa’s New Energy Frontier: The Promise and the Peril.” IHS Markit, London. http://www.ihs.com/tl/quarterly/ features/promise-and-the-peril.aspx.
Arvis, J. F., Y. Duval, B. Shepherd, and C. Utoktham. 2013. “Trade Costs in the Developing World: 1995– 2010.” Policy Research Paper 6309, World Bank, Washington, DC.
Arvis, J. F., G. Raballand, and J. F. Marteau. 2010. The Cost of Being Landlocked: Logistics Costs and Supply Chain Reliability. Washington, DC: World Bank.
Asiki, G., G. Reniers, R. Newton, K. Baisley, J. Nakiyingi-Miiro, E. Slaymaker, I. Kasamba et al. 2016. “Adult Life Expectancy Trends in the Era of Antiretroviral Treatment in Rural Uganda (1991– 2012).” Aids 30 (3): 487-493.
Barofsky, J., T. D. Anekwe, and C. Chase. 2015. “Malaria Eradication and Economic Outcomes in SubSaharan Africa: Evidence from Uganda.” Journal of Health Economics 44 (December): 118-136.
Bayraktar, N., and H. Fofack. 2011. “Capital Accumulation in Sub-Saharan Africa: Income-Group and Sector Differences.” Journal of African Economies
20 (4): 531-561.
Bhattacharyya, R., and A. Mandal. 2016. “India– ASEAN Free Trade Agreement: An Ex Post Evaluation.” Journal of Policy Modeling 38 (2): 340-352.
Buigut, S. 2016. “Trade Effects of the East African Community Customs Union: Hype versus Reality."
South African Journal of Economics 84 (3): 422-439.
Calderón, C., and L. Servén. 2010. “Infrastructure and Economic Development in Sub-Saharan Africa.”
Journal of African Economies 19 (Supplement 1): i13−i87.
Chaney, N. W., J. Sheffield, G. Villarini, and E. F. Wood. 2014. “Development of a High-Resolution Gridded Daily Meteorological Dataset over SubSaharan Africa: Spatial Analysis of Trends in Climate Extremes.” Journal of Climate 27 (15): 5815-5835.
Dauvin, M, and D. Guerreiro. 2017. “The Paradox of Plenty: A Meta-Analysis.” World Development 94 (June): 212-231.
EBRD (European Bank for Reconstruction and Development). 2019. Eight Things You Should Know About Middle-Income Transitions. April. London: European Bank for Reconstruction and Development.
European Commission. 2018. “Association Implementation Report on Moldova.” Joint Staff Working Document. European Commission: Brussels.
Gaspar, V, D. Amaglobeli, M. Garcia-Escribano, D. Prady, and M. Soto. 2019. “Fiscal Policy and Development: Human, Social, and Physical Investments for the SDGs.” Staff Discussion Note 19/03, International Monetary Fund, Washington, DC.
Government of Rwanda and World Bank. 2019. Future Drivers of Growth in Rwanda: Innovation, Integration, Agglomeration, and Competition. Washington, DC: World Bank.
Guillaumont Jeanneney, S., and P. Hua. 2015. “China’s African Financial Engagement, Real Exchange Rates and Trade between China and Africa.” Journal of African Economies 24 (1): 1-25.
Hallegatte, S., M. Bangalore, L. Bonzanigo, M. Fay, T. Kane, U. Narloch, J. Rozenberg, D. Treguer, and A. Vogt-Schilb. 2016. Shock Waves: Managing the Impacts of Climate Change on Poverty. Washington, DC: World Bank.
Hoeppe, P. 2016. “Trends in Weather Related Disasters–Consequences for Insurers and Society.”
Weather and Climate Extremes 11 (March): 70-79.
Hornbeck, J. F. 2012. “The Dominican RepublicCentral America-United States Free Trade Agreement (DR-CAFTA): Developments in Trade and Investment.” Current Politics and Economics of South and Central America 5 (3): 275.
Ilzetzki, E., C. Reinhart, and K. S. Rogoff. 2017. “Exchange Arrangements Entering the 21st Century: Which Anchor Will Hold?” NBER Working Paper 23134, National Bureau of Economic Research, Cambridge.
vk.com/id446425943
G L O BAL EC O NO M I C P ROS P EC T S | J U NE 2 0 1 9 |
S P EC I AL F O CU S 2 . 1 |
147 |
|
|
|
IMF (International Monetary Fund). 2014.
“Macroeconomic Developments in Low-Income
Developing Countries.” IMF Policy Paper.
International Monetary Fund, Washington, DC.
IPCC (Intergovernmental Panel on Climate Change). 2014. “Climate Change 2014: Impacts, Adaptation, and Vulnerability.” IPCC Working Group II.
Iradian, G. 2007. “Rapid Growth in Transition
Economies: Growth-Accounting Approach.” Working
Paper 07/164, International Monetary Fund,
Washington, DC.
Johnson, P., and C. Papageorgiou. Forthcoming.
“What Remains of Cross-Country Convergence?”
Journal of Economic Literature.
Kumar, S., and G. Rauniyar. 2018. “The Impact of Rural Electrification on Income and Education: Evidence from Bhutan.” Review of Development Economics 22 (3): 1146-1165.
Lacina, B., and N. P. Gleditsch 2005. “Monitoring Trends in Global Combat: A New Dataset of Battle Deaths.” European Journal of Population 21 (2-3): 145166.
Lee, D., and H. Zhang. 2019. “Export Diversification in Low-Income Countries and Small States: Do Country Size and Income Level Matter?” IMF Working Paper 19/118, International Monetary Fund, Washington, DC.
Loukoianova, E., and A. Unigovskaya. 2004. “Analysis of Recent Growth in Low-Income CIS Countries.” IMF Working Paper 04/151, International Monetary Fund, Washington, DC.
Lusty, P. A. J., and A. G. Gunn. 2015. “Challenges to Global Mineral Resource Security and Options for Future Supply.” Geological Society, Special Publications
393 (1): 265-276.
Marcelino, S., and M. I. Hakobyan. 2014. “Does Lower Debt Buy Higher Growth? We Impact of Debt Relief Initiatives on Growth.” IMF Working Paper 14/230, International Monetary Fund, Washington, DC.
Max, E., and J. Berman. 2018. “Bridging the MobileElectrification Gap: The Potential for Privately Subsidized Phone Charging in Rural Africa.” IEEE Technology and Society Magazine 37 (3): 74-86.
Möller, L. C., and K. M. Wacker. 2017. “Explaining Ethiopia’s Growth Acceleration—The Role of
Infrastructure and Macroeconomic Policy.” World
Development 96: 198-215.
Morris, M., and C. Staritz. 2017. “Industrial Upgrading and Development in Lesotho’s Apparel Industry: Global Value Chains, Foreign Direct Investment, and Market Diversification.” Oxford Development Studies 45 (3): 303-320.
Paudel, R. C., and A. Cooray. 2018. “Export Performance of Developing Countries: Does Landlockedness Matter?” Review of Development Economics 22 (3): e36-e62.
Reinhart, C. M., and K. S. Rogoff. 2004. "The Modern History of Exchange Rate Arrangements: A Reinterpretation." Quarterly Journal of Economics 119 (1): 1-48.
Riley, T. A., and A. Kulathunga. 2017. Bringing E- money to the Poor: Successes and Failures. Washington, DC: World Bank.
Roberts, L., C. Hale, F. Belyakdoumi, L. Cobey, R. Ondeko, M. Despines and J. Keys. 2001. “Mortality in Eastern Democratic Republic of Congo.” International Rescue Committee 14: 992-996.
Roser, M. 2019. ”War and Peace.” Our World in Data. https://ourworldindata.org/war-and-peace.
Schodde, R. 2013. “The Impact of Commodity Prices and Other Factors on the Level of Exploration.” MinEx Consulting Presentation.
Schwalm, C. R., W. R. L. Anderegg, A. M. Michalak, J. B. Fisher, F. Biondi, G. Koch, M. Litvak, et al. 2017. “Global Patterns of Drought Recovery.” Nature 548 (7666): 202.
Trevino, J. 2011. “Oil-Price Boom and Real Exchange Rate Appreciation: Is There Dutch Disease in the CEMAC.” IMF Working Paper. 11/268, International Monetary Fund, Washington, DC.
World Bank. 2015a. Global Economics Prospects: Having Fiscal Space and Using it. January. Washington, DC: World Bank.
———.2015b. “Hydropower Impact and Public Finance Reforms Towards Economic Self-Reliance.” Bhutan – Macroeconomic and Public Finance Policy Note. World Bank, Washington, DC.
———.2016a. Global Economic Prospects, Spillovers amid Weak Growth. January. Washington, DC: World Bank.
vk.com/id446425943
148 S P EC I AL F O CU S 2 . 1 |
G L O BAL EC O NO M I C P ROS P EC T S | J U NE 2 0 1 9 |
|
|
———. 2016b. World Development Report 2016: Digital Dividends. Washington, DC: World Bank.
———.2016c. Breaking Down Barriers: Unlocking Africa’s Potential through Vigorous Competition Policy. Washington, D.C: World Bank.
———.2017a. Forcibly Displaced: Toward a Development Approach Supporting Refugees, the Internally Displaced, and Their Hosts. Washington, DC: World Bank.
———.2017b. Report from the Executive Directors of the International Development Association to the Board of Governors: Additions to IDA Resources - Eighteenth Replenishment. Washington, DC: World Bank.
———.2017c. Global Economic Prospects: Weak Investments in Uncertain Times. January. Washington, DC: World Bank.
———.2017d. A Step Ahead: Competition Policy for Shared Prosperity and Inclusive Growth. Washington, D.C: World Bank.
———.2018a. Global Economic Prospects: The Turning of the Tide. June. Washington, DC: World Bank.
———. 2018b. Poverty and Shared Prosperity: Piecing Together the Poverty Puzzle. Washington, DC: World Bank.
———.2018c. Global Economic Prospects: Broad-based Upturn, but for How Long? January. Washington, DC: World Bank.
———.2019a. Global Economic Prospects: Darkening Skies. January. Washington, DC: World Bank.
———.2019b. World Development Report 2019: The Changing Nature of Work. Washington, DC: World Bank.
———.2019c. Doing Business 2019: Training for Reform. Washington, DC: World Bank.
———.2019d. The Mobility of Displaced Syrians An Economic and Social Analysis. Washington, DC: World Bank.
World Bank Group and China Development Bank. 2017. Leapfrogging: The Key to Africa's Development?
Washington, DC: World Bank.
vk.com/id446425943
 STATISTICAL
APPENDIX
vk.com/id446425943