

Global Economic Prospects -World Bank_watermark
.pdfvk.com/id446425943
G L O BAL EC O NO M I C P ROS P EC T S | J U NE 2 0 1 9 |
E AS T AS I A AN D P AC I F I C |
91 |
|
|
|
Outlook
After moderating from 6.3 percent in 2018 to 5.9 percent a year in 2019-20, regional growth is projected to ease further to 5.8 percent in 2021 (Tables 2.1.1 and 2.1.2; Figure 2.1.3.A). Growth in China is projected to slow to 6.2 percent in 2019 amid continued domestic and external headwinds. The recent increase in tariffs on trade with the United States is projected to weigh on growth in 2020, which has been revised down to 6.1 percent.
This outlook is predicated on a deceleration in global trade, no further escalation of trade tensions between China and the United States, broadly stable commodity prices, and supportive global financing conditions, especially in the near term. The baseline also assumes that authorities in China continue to calibrate supportive monetary and fiscal policies to address the challenging external environment and any other headwinds to activity (SCPRC 2019).
Regional growth excluding China is projected to decline to 5.1 percent in 2019 before inching up to 5.2 percent in 2020-21 as global trade rebounds. Growth among commodity importers is expected to moderate in 2020-21, reflecting capacity constraints and subdued external demand. Domestic demand will continue benefiting from favorable financing conditions amid low inflation and rising capital flows (Cambodia, the Philippines, Thailand, Vietnam). Regional economies will continue to benefit from pan-Asian infrastructure investments and expanding intra-regional trade, despite weaker- than-expected global growth and investment. The investment outlook is favorable in commodityimporting economies. Some countries will benefit from large public infrastructure projects coming onstream in 2020-21 (Thailand, the Philippines).
Growth in commodity exporters is expected to remain stable at about 5.1 percent a year in 201921, in line with potential, but with significant cross-country differences. In particular, growth is projected to diverge slightly between the two largest commodity exporters in the region. In Indonesia, which is less open to trade, growth is
FIGURE 2.1.2 China: Recent developments
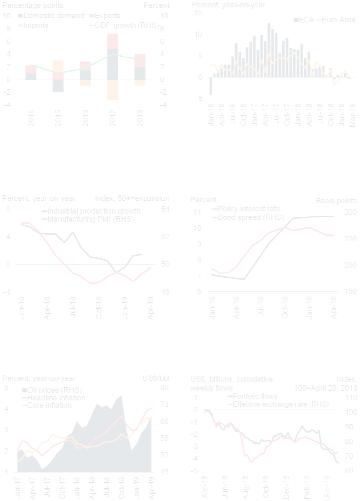
China’s growth continues to slow, reflecting a deceleration in manufacturing activity and trade. The current account surplus widened in 2019Q1. Recent high-frequency indicators point to a continuing broadbased weakness in trade. Equities and the renminbi have largely recovered from losses incurred in 2018, but have come under renewed pressure recently. Growth of bank lending has remained strong, bond issuance has accelerated, but growth of other debt instruments has slowed.
A. Manufacturing and |
B. Balance of payments |
nonmanufacturing PMI |
|
|
|
C. Export and import volumes |
D. Bond spreads and equity prices |
|
|
E. Exchange rate |
F. Aggregate financing |
Source: Haver Analytics, National Bureau of Statistics of China, World Bank.
A.Manufacturing and nonmanufacturing are measured by Purchasing Managers’ Index (PMI). PMI readings above 50 indicate expansion in economic activity; readings below 50 indicate contraction. Horizontal line indicates expansionary threshold. Last observation is April 2019.
B.e=estimate. Net capital flows and change in reserves are estimates. Net capital inflows include net capital and financial account balance, errors and omissions.
C.Data include only goods. 12-month moving average. Export and import volumes are calculated as export and import values deflated by export and import price deflators. Export and import indices for some missing values and for April 2019 are estimates. Last observation is April 2019.
D.Bond spread denotes the average spread of China’s sovereign debt (measured by J.P. Morgan’s Emerging Markets Bond Index) over its equivalent maturity U.S. Treasury bond. Equity index is represented by the Shanghai Stock Exchange Composite. Last observation is May 21, 2019.
E.Nominal=exchange rate vis-à-vis U.S. dollar. NEER=Nominal Effective Exchange Rate. REER=Real Effective Exchange Rate. Increase denotes appreciation. Last observation is May 20, 2019.
F.Bonds include local government special bonds and net financing of corporate bonds. Other instruments include entrusted loans, trust loans and other instruments. Last observation is March 2019.
Click here to download data and charts.

vk.com/id446425943
92 |
C H AP T E R 2 . 1 |
G L O BAL EC O NO M I C P ROS P EC T S | J U NE 2 0 1 9 |
|
|
|
FIGURE 2.1.3 EAP region: Outlook and risks
EAP growth is projected to gradually decline, mainly reflecting the continuing structural slowdown in China. Excluding China, is also slowing, albeit with notable heterogeneity. The region is characterized by deep global integration, which makes countries vulnerable to external trade or financial shocks. Domestic and external vulnerabilities would amplify the impact of such shocks, especially where policy buffers are limited.
A. GDP growth |
B. Exports and openness to foreign |
|
inflows, 2013-18 |
C. Total domestic and external debt |
D. Total public and non-public debt |
projected to accelerate marginally in 2020-21, reflecting continued support from high infrastructure spending, robust private consumption. and solid growth of the working-age population. In Malaysia, growth is expected to moderate slightly but remain robust, with weakening export growth largely offset by strong domestic demand on the back of favorable financing conditions and low inflation. In smaller commodity exporters, growth is expected to remain strong in 2020, supported by continued investment in new mining projects (Mongolia, Papua New Guinea).
While growth in the region is projected to remain robust in the near term, underlying potential growth—which has fallen considerably over the past decade, in part reflecting slowing productivity—is likely to decline further over the long term. This largely reflects deteriorating demographic trends, especially in China, Thailand, and Vietnam, combined with a projected slowdown in capital accumulation in China as credit growth is reined in (World Bank 2018a, 2018b).
E. GDP growth and total debt in China |
F. Current account balance net of FDI |
|
and GDP growth |
Source: Bank for International Settlements, Haver Analytics, International Monetary Fund, The Institute of International Finance, World Bank.
A.East Asian countries excl. China includes Cambodia, Indonesia, Lao PDR, Malaysia, Mongolia, Myanmar, Palau, Philippines, Thailand, and Vietnam. Pacific Island excl. PNG includes Fiji, Kiribati, Marshall Islands, Micronesia, Palau, Samoa, Solomon Islands, Timor-Leste, Tonga, Tuvalu, and Vanuatu. 1990-2018 average for East Asian countries excl. China excludes Myanmar and 1990-2018 average for Pacific Island excl. PNG excludes Marshall Islands, Micronesia, Palau, Timor-Leste, and Tuvalu due to data limitations. Yellow diamonds denote forecasts published in the January 2019 edition of the Global Economic Prospects report. Aggregate growth rates are calculated using 2010 U.S. dollar GDP weights. Data in shaded areas are forecasts.
B.EA=East Asia. PI=Pacific Islands. EA1 comprises Brunei Darussalam, Cambodia, Malaysia, Mongolia, Thailand, and Vietnam; EA2 comprises Indonesia, Lao PDR, Myanmar and Philippines. PI1 comprises Kiribati, Marshall Islands, Micronesia, Timor-Leste, Tonga, and Tuvalu; PI2 comprises Palau and Vanuatu; PI3 comprises Fiji, Papua New Guinea, Samoa, and Solomon Islands. The linkages estimated in this chart only represent direct channels: spillovers may also propagate via indirect channels such as global and regional value chains. Diamonds denote direct cumulative exposure to China, Euro Area, and United States.
C.Total debt is defined as a sum of domestic and external debt. Data for 2018 are estimates.
D.Non-public debt includes all debt excluding public debt. The general government debt data for Mongolia is based on World Bank staff estimates. Data for 2018 are estimates.
E.Total debt is defined as a sum of domestic and external debt.
F.CAB ex. FDI=Current Account Balance excluding Foreign Direct Investment. Orange dashes denote GDP growth in 2010; green hyphen—CAB ex. FDI in 2010. Data for 2019 are estimates.
Click here to download data and charts.
Risks
Risks to the forecast remain tilted to the downside. They include the possibility of a sharper-than- expected downturn in large economies, a further slowing of global trade, a possible intensification of trade tensions, and an abrupt change in global financing conditions and investor sentiment. Most of the region managed to weather the deterioration of external conditions in 2018. However, worsening conditions would place additional pressure on policymakers even though most countries having reasonably sound economic fundamentals and robust domestic demand (World Bank 2019a). The baseline also assumes that global trade policy uncertainty will remain elevated over the forecast horizon.
Around 80 percent of advanced economies, as well as China, are expected to register slower growth in 2019. In the baseline scenario, the impact of slower global growth and external demand on the EAP region is assumed to be offset by more supportive financing conditions and stronger

vk.com/id446425943
G L O BAL EC O NO M I C P ROS P EC T S | J U NE 2 0 1 9 |
E AS T AS I A AN D P AC I F I C |
93 |
|
|
|
policy stimulus in China. However, a sharper- than-expected deceleration of activity in large economies—the Euro Area, China, and the United States—could have adverse repercussions across the EAP region, mainly through weaker demand for exports and disruption of global value chains, as well as through financial, commodity, and confidence channels (Chapter 1; World Bank 2016; Figure 2.1.3.B).
In particular, risks of a sharper-than-expected slowdown in China remain significant because of a difficult external environment alongside notable domestic challenges. Total non-financial-sector debt in China is above levels seen at the peak of previous credit booms in other major EMDEs and some advanced economies. High corporate indebtedness in sectors with weak profitability is of particular concern. Policymakers’ continued reliance on credit expansion to support growth may exacerbate domestic risks by adding further leverage to its already highly leveraged corporate sector, while also contributing to rising debt in the household sector. In addition, a sizable portion of recent stimulus has taken the form of expanding local government special bond quotas. This form of stimulus may eventually become less effective because of diminishing returns to investment, and may further amplify domestic risks. More than half of the 2019 stimulus has taken the form of tax and fee cuts, whose impact on growth may be less predictable than that of changes in public investment.
A renewed spike in global policy uncertainty, including renewed trade tensions between major economies, could cause a further deterioration in confidence, investment, and trade. Policy uncertainty in the region remains high amid unresolved trade dispute between the United
States and China, as demonstrated by the most recent escalation of trade tensions. Commitments by China to purchase U.S. goods as part of an interim agreement could lead to further global trade policy uncertainty and trade diversion for other countries. Failure to reach a long-term agreement between these two economies could lead to a further escalation in tariffs, with broadranging global and regional consequences. In the extreme case scenario, it could reduce global exports by up to 3 percent and global income by 1.7 percent over the medium term, with the largest decline (3.5 percent) occurring in China (Freund et al. 2018).1 The region may also be negatively affected by a disorderly exit of the United Kingdom from the European Union. The U.K. is an important trading partner for several regional economies, especially Cambodia and Malaysia. The materialization of a combination of downside risks could trigger an even sharper slowdown in regional growth.
Notwithstanding the region’s strong funda- mentals—solid growth, diversified economic base, sound policy frameworks, and strong buffers— EAP economies remain vulnerable to risks related to abrupt changes in global financial conditions. Many countries have pockets of vulnerabilities, including elevated debt (China, Lao People’s Democratic Republic, Malaysia, Mongolia, Vietnam), sizable fiscal deficits (Cambodia, Lao PDR, Mongolia, Vietnam), or significant reliance on potentially volatile capital flows (Cambodia, Indonesia; Figures 2.1.3.C-F). Renewed episodes of financial market stress could have pronounced and widespread effects on countries with high indebtedness (Chapter 1). Vulnerabilities among some EAP countries could amplify the impact of external shocks, such as a sudden stop in capital flows or a rise in borrowing costs.
1 Assumes a 25 percent tariff surcharge on all products traded between China and the United States, combined with a decline in investor confidence, resulting in a 0.5 percentage point drop in global investment to GDP.

vk.com/id446425943
94 C H AP T E R 2 . 1 G L O BAL EC O NO M I C P ROS P EC T S | J U NE 2 0 1 9
TABLE 2.1.1 East Asia and Pacific forecast summary
|
|
|
|
|
|
|
|
Percentage point differences |
||
(Real GDP growth at market prices in percent, unless indicated otherwise) |
|
|
|
|
from January 2019 projections |
|||||
|
|
|
|
|
|
|
|
|
|
|
|
2016 |
2017 |
2018e |
2019f |
2020f |
2021f |
|
2019f |
2020f |
2021f |
|
|
|
|
|
|
|
|
|
|
|
EMDE EAP, GDP1 |
6.3 |
6.5 |
6.3 |
5.9 |
5.9 |
5.8 |
|
-0.1 |
-0.1 |
0.0 |
(Average including countries with full national accounts and balance of payments data only)2 |
|
|
||||||||
EMDE EAP, GDP2 |
6.3 |
6.5 |
6.3 |
5.9 |
5.9 |
5.8 |
|
-0.1 |
-0.1 |
0.0 |
GDP per capita (U.S. dollars) |
5.6 |
5.8 |
5.7 |
5.4 |
5.3 |
5.3 |
|
0.0 |
-0.1 |
0.0 |
PPP GDP |
6.3 |
6.4 |
6.3 |
5.9 |
5.9 |
5.8 |
|
0.0 |
0.0 |
0.0 |
Private consumption |
7.1 |
6.5 |
8.1 |
7.0 |
7.0 |
7.0 |
|
-0.4 |
-0.1 |
-0.2 |
Public consumption |
9.3 |
7.4 |
9.4 |
7.6 |
7.5 |
7.4 |
|
0.3 |
0.4 |
0.3 |
Fixed investment |
6.6 |
5.3 |
5.3 |
5.1 |
5.1 |
4.9 |
|
-0.2 |
-0.1 |
-0.2 |
Exports, GNFS3 |
2.6 |
9.4 |
4.7 |
3.3 |
3.9 |
4.3 |
|
-1.4 |
-0.5 |
0.0 |
Imports, GNFS3 |
5.4 |
7.9 |
7.8 |
4.7 |
5.0 |
5.7 |
|
-1.8 |
-0.9 |
-0.1 |
Net exports, contribution to growth |
-0.8 |
0.4 |
-0.9 |
-0.4 |
-0.4 |
-0.5 |
|
0.1 |
0.1 |
0.0 |
Memo items: GDP |
|
|
|
|
|
|
|
|
|
|
East Asia excluding China |
4.9 |
5.4 |
|
|
|
|
|
|
|
|
5.2 |
5.1 |
5.2 |
5.2 |
|
-0.1 |
0.0 |
0.0 |
|||
China |
6.7 |
6.8 |
6.6 |
6.2 |
6.1 |
6.0 |
|
0.0 |
-0.1 |
0.0 |
Indonesia |
5.0 |
5.1 |
5.2 |
5.2 |
5.3 |
5.3 |
|
0.0 |
0.0 |
0.0 |
Thailand |
3.4 |
4.0 |
4.1 |
3.5 |
3.6 |
3.7 |
|
-0.3 |
-0.3 |
-0.2 |
|
|
|
|
|
|
|
|
|
|
|
Source: World Bank.
Note: e = estimate; f = forecast. EMDE = emerging market and developing economies. World Bank forecasts are frequently updated based on new information and changing (global) circumstances. Consequently, projections presented here may differ from those contained in other Bank documents, even if basic assessments of countries’ prospects do not differ at any given moment in time.
1.GDP at market prices and expenditure components are measured in constant 2010 U.S. dollars. Excludes Democratic People’s Republic of Korea and dependent territories.
2.Sub-region aggregate excludes Democratic People’s Republic of Korea, dependent territories, Fiji, Kiribati, the Marshall Islands, the Federated States of Micronesia, Myanmar, Nauru, Palau, Papua New Guinea, Samoa, Timor-Leste, Tonga, and Tuvalu, for which data limitations prevent the forecasting of GDP components.
3.Exports and imports of goods and non-factor services (GNFS).
Click here to download data.
TABLE 2.1.2 East Asia and Pacific country forecasts1
|
|
|
|
|
|
|
|
Percentage point differences |
||
(Real GDP growth at market prices in percent, unless indicated otherwise) |
|
|
|
from January 2019 projections |
||||||
|
|
|
|
|
|
|
|
|
|
|
|
2016 |
2017 |
2018e |
2019f |
2020f |
2021f |
|
2019f |
2020f |
2021f |
Cambodia |
7.0 |
7.0 |
7.5 |
7.0 |
6.9 |
6.8 |
|
0.2 |
0.1 |
0.1 |
China |
6.7 |
6.8 |
6.6 |
6.2 |
6.1 |
6.0 |
|
0.0 |
-0.1 |
0.0 |
Fiji |
0.7 |
3.0 |
3.2 |
3.4 |
3.3 |
3.3 |
|
0.0 |
0.0 |
0.0 |
Indonesia |
5.0 |
5.1 |
5.2 |
5.2 |
5.3 |
5.3 |
|
0.0 |
0.0 |
0.0 |
Lao PDR |
7.0 |
6.9 |
6.5 |
6.6 |
6.7 |
6.6 |
|
0.0 |
0.0 |
0.0 |
Malaysia |
4.2 |
5.9 |
4.7 |
4.6 |
4.6 |
4.6 |
|
-0.1 |
0.0 |
0.0 |
Mongolia |
1.4 |
5.4 |
6.9 |
7.2 |
6.9 |
6.2 |
|
0.6 |
0.6 |
0.0 |
Myanmar |
5.9 |
6.8 |
6.2 |
6.5 |
6.6 |
6.8 |
|
0.0 |
0.0 |
0.0 |
Papua New Guinea |
4.1 |
2.3 |
-0.3 |
5.6 |
3.1 |
3.5 |
|
0.5 |
0.0 |
0.1 |
Philippines |
6.9 |
6.7 |
6.2 |
6.4 |
6.5 |
6.5 |
|
-0.1 |
-0.1 |
-0.1 |
Solomon Islands |
3.3 |
3.0 |
3.5 |
2.9 |
2.8 |
2.7 |
|
0.0 |
0.0 |
0.0 |
Thailand |
3.4 |
4.0 |
4.1 |
3.5 |
3.6 |
3.7 |
|
-0.3 |
-0.3 |
-0.2 |
Timor-Leste 2 |
5.1 |
-3.5 |
-0.7 |
3.9 |
4.6 |
5.0 |
|
0.6 |
-0.3 |
0.0 |
Vietnam |
6.2 |
6.8 |
7.1 |
6.6 |
6.5 |
6.5 |
|
0.0 |
0.0 |
0.0 |
|
|
|
|
|
|
|
|
|
|
|
Source: World Bank.
Note: e = estimate; f = forecast. World Bank forecasts are frequently updated based on new information and changing (global) circumstances. Consequently, projections presented here may differ from those contained in other Bank documents, even if basic assessments of countries’ prospects do not significantly differ at any given moment in time.
1.GDP at market prices and expenditure components are measured in constant 2010 U.S. dollars.
2.Non-oil GDP. Timor-Leste’s total GDP, including the oil economy, is roughly four times its non-oil economy and is highly volatile as a result of sensitivity to changes in global oil prices and local production levels.
Click here to download data.

vk.com/id446425943
Growth in Europe and Central Asia is projected to fall sharply from 3.1 percent in 2018 to 1.6 percent in 2019. The slowdown partly reflects a sharp weakening of activity in Turkey, which fell into recession in the wake of acute financial market stress in 2018. Regional growth is projected to pick up in 2020-21 as Turkey recovers and the Russian Federation strengthens. Excluding these economies, the rest of the region is expected to moderate. In particular, growth in Central Europe is projected to soften as economies grapple with the slowdown in the Euro Area and binding domestic capacity constraints. Key external risks to the region include spillovers from weaker-than-expected activity in the Euro Area and from escalation of global policy uncertainty, particularly in relation to trade tensions and the United Kingdom’s exit from the European Union. Renewed financial pressures in Turkey could also disrupt regional growth.
Recent developments
Growth in Europe and Central Asia (ECA) moderated in 2018 to 3.1 percent—close to its potential rate—while the start of 2019 has been slow amid weakening investment and trade growth. The slowdown followed a strong expansion in 2017, driven by both domestic demand and exports (Figure 2.2.1.A; World Bank 2019c). Regional growth in 2018 suffered from marked weakness in Turkey, where GDP contracted sharply in the second half of 2018. Activity in Central Europe also slowed toward the end of 2018, reflecting weakening domestic demand and challenging external factors amid a slowdown in the Euro Area (Poland, Romania). In contrast, growth in Russia accelerated due to several temporary factors.
Trade weakened across the region in early 2019, as goods trade volumes slowed in tandem with activity in the Euro Area, which is the region’s largest export destination (Figure 2.2.1.B). The region’s three largest economies—Russia, Turkey, and Poland—faced softening trade prospects amid slowing industrial production growth (Figure 2.2.1.C).
Note: This section was prepared by Collette M. Wheeler. Research assistance was provided by Mengyi Li and Julia R.R. Norfleet.
In response to deteriorating global growth prospects, central banks in major economies have provided additional monetary policy accommodation since the start of 2019, resulting in easing global financing conditions. The tightening cycle in monetary policy in 2018 has paused in ECA, with some economies cutting policy rates (Armenia, Azerbaijan, Georgia, Kazakhstan, Kyrgyz Republic, North Macedonia, Ukraine) or leaving them unchanged in 2019, but overall policy rates in some large ECA economies remain higher than in 2018 (Figure 2.2.1.D; Russia, Turkey). Fiscal policy has also loosened in 2019, resulting in widening government deficit- to-GDP ratios (Belarus, Kyrgyz Republic, Poland, Romania). Public debt has increased by over 10 percentage points of GDP since the global financial crisis, reaching 45 percent at the end of 2018. Inflation has been trending up in the region since the start of 2019 (Armenia, Azerbaijan, Bulgaria, Croatia, Georgia, Hungary, Kosovo, Moldova, Montenegro, Poland, Romania, Russia, Serbia, Tajikistan), driven in part by rising oil prices (Figure 2.2.1.E).
Activity strengthened somewhat in Eastern Europe, the South Caucasus, and Central Asia in 2018, with all three subregions benefiting from firming growth in Russia via close trade and financial linkages. However, the earlier boosts in Eastern Europe from improved agricultural
vk.com/id446425943
96 |
C H AP T E R 2 . 2 |
G L O BAL EC O NO M I C P ROS P EC T S | J U NE 2 0 1 9 |
|
|
|
FIGURE 2.2.1 ECA: Recent developments
Growth in ECA eased in 2018 and early 2019 on weakening exports to the tightly linked Euro Area. Inflation has risen owing to a combination of oil price movements and currency depreciations, which has forced many central banks to maintain higher policy interest rates in 2019. Turkey’s financial market stress was accompanied by large financial outflows, and the subsequent weakness in Turkish economic activity has weighed on regional growth.
A. Contribution to regional GDP |
B. Growth in goods trade, volumes |
growth |
|
C. Industrial production growth and |
D. Bond spreads and policy interest |
manufacturing PMI in Russia, Turkey, |
rates |
and Poland |
|
E. Inflation and global oil prices |
F. Turkey portfolio flows and nominal |
|
effective exchange rate |
harvests (Ukraine) and robust domestic demand (Moldova) have already begun to fade, as private consumption is dampened by inflationary pressures and weaker remittances in 2019. Robust services sector activity continues to underpin growth in the South Caucasus, with an additional boost coming from manufacturing in Armenia. In Central Asia, strong production in the Kashagan oil field supported the cyclical recovery in Kazakhstan in 2018, but production has flattened in 2019 due to agreed upon cuts with OPEC, as Kazakhstan is a non-OPEC partner. Strong tourist arrivals have continued in early 2019 in the Western Balkans (Albania, Montenegro), while the rebound in Serbia from earlier weather-related disruptions fades.
In Russia, growth picked up to a six-year high of 2.3 percent in 2018, despite tightening international economic sanctions and financial market pressures. The acceleration of activity was supported by the rise in oil prices, a solid contribution from net exports, as well as one-off factors such as energy-related construction projects and the hosting of the World Cup. Industrial activity slowed at the start of 2019, as compliance with agreed upon oil production cuts took effect as a non-OPEC partner. Retail sales volume growth also declined with the onset of the valueadded tax hike.
Source: CPB Netherlands Bureau for Economic Policy Analysis, Haver Analytics, Institute of International Finance, J.P. Morgan, World Bank.
Note: For sample coverage, refer to Table 2.2.1.
A.Aggregate growth rates calculated using 2010 constant U.S. dollar GDP weights. Data for 2018 are estimates. Sample includes 18 economies, for which GDP components are available.
B.Last observation is March 2019.
C.Manufacturing PMI are 3-month moving averages. PMI is the Purchasing Managers’ Index (PMI). Readings above 50 indicate expansion, readings below indicate contraction. The aggregates are calculated using constant 2010 U.S. dollar GDP weights. Last observation is April 2019 for manufacturing PMI, and March 2019 for industrial production growth.
D.Data are 3-month moving averages and calculated using 2010 U.S. dollar GDP weights. Bond spread denotes the average spread of ECA sovereign debt (measured by J.P. Morgan’s Emerging Markets Bond Index) over its equivalent maturity U.S. Treasury bond. Sample includes Georgia, Hungary, Kazakhstan, Poland, Russia, Serbia, Turkey, and Ukraine, for which EMBI spreads are available. Last observation is April 2019.
E.Figure shows median inflation values. Headline inflation measured as the percent change in the consumer price index. Sample includes Belarus, Croatia, Hungary, North Macedonia, Poland, Romania, Russia, and Turkey, for which data are available. Last observation is April 2019.
F.Cumulative weekly flows since April 20, 2018. Last observation is May 17, 2019.
Click here to download data and charts.
Following strong growth of 7.4 percent in 2017 and solid momentum at the start of 2018, the Turkish economy slowed sharply and entered a recession in the second half of 2018. The downturn was triggered by corporate fragility stemming from rising levels of debt, often denominated in foreign currency, and exacerbated by policy uncertainty. This led to significant pressure on financial markets and the value of the lira. Growth was 2.6 percent for 2018 as a whole. The deceleration of activity was partly driven by significant financial outflows from Turkey amid market concerns about high current account deficits and policy developments, which led to sharp falls in investment and private consumption (Figure 2.2.1.F).
Growth in Poland was a robust 5.1 percent in 2018, partly reflecting European Union (EU)
vk.com/id446425943
G L O BAL EC O NO M I C P ROS P EC T S | J U NE 2 0 1 9 |
E U RO PE AN D C E N T RAL AS I A |
97 |
|
|
|
fund transfers and the strongest labor market since the 1990s. Despite this, low inflation and borrowing rates enabled the authorities to undertake accommodative monetary policy and fiscal policy expansion. However, since the end of 2018, core inflation has nearly tripled, accelerating to a 6-year high in April.
Outlook
Regional growth is projected to sharply decelerate to a four-year low in 2019, to 1.6 percent, down from 3.1 percent in 2018. This is 0.7 percentage point lower than previous forecasts, reflecting weaker-than-expected activity in Turkey and Russia, as well as some smaller economies. Energy exporters in the region (Azerbaijan, Kazakhstan, Russia) should benefit from the recent rise in oil prices. Regional growth is expected to firm in 2020-21 as Turkey recovers (Figure 2.2.2.A). Excluding Turkey, regional activity is expected to stabilize, with modest growth in domestic demand and a small drag from net exports.
The baseline projection for regional growth is predicated on the assumption that Turkey’s economy bottoms out in 2019 and that spillovers from slowing growth in the Euro Area are limited. The baseline also assumes no further escalation in trade tensions between the United States and China or other major trading partners, no disorderly exit from the European Union by the United Kingdom, and an absence of policy missteps in economies that recently suffered acute financial stress—mainly Turkey. Trade relations between the United States and China remain fragile, however, and further escalation in tariffs or retaliatory action could adversely affect economies in the region, particularly energy and metals exporters. Similarly, a deterioration in trade relations between the United States and Europe, particularly with respect to auto tariffs, could also be detrimental to the ECA region. Regional growth also depends on oil prices remaining relatively stable, moderating gradually over the forecast horizon.
The projected weakening of growth is more pronounced in Central Europe than in other ECA subregions because of closer linkages with the
FIGURE 2.2.2 ECA: Outlook and risks
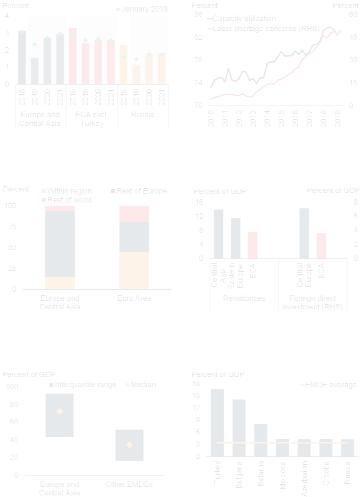
Growth in ECA is projected to fall to 1.6 percent in 2019, reflecting the effects of Turkey’s financial stress and weakening activity in other large economies. Capacity constraints are expected to hinder growth in Central Europe, while a further deceleration in the Euro Area or Russia could dent activity in tightly connected subregions. Large external debt leaves regional economies susceptible to sudden shifts in investor sentiment, while the realization of contingent liabilities could pose additional fiscal costs in ECA.
A. GDP growth |
B. Capacity utilization and labor |
|
shortages in Central Europe |
C. Share of export goods trade by destination, 2017
E. External debt, 2017
D. Remittances and foreign direct investment inflows, 2018
F. Average fiscal cost of realized contingent liability episodes
Source: Bova et al. (2016), European Commission, Kose et al. (2017), Organisation for Economic Co-operation and Development, United Nations Conference on Trade and Development, World Bank.
A.Aggregate growth rates calculated using constant 2010 U.S. dollar GDP weights. Shaded areas indicate forecasts. Data for 2018 are estimates. Green diamonds correspond to forecasts from the January 2019 edition of the Global Economic Prospects report.
B.Data are calculated using constant 2010 U.S. dollar GDP weights. Sample includes Hungary, Poland, and Romania. Labor shortage is the percentage of manufacturing firms pointing to labor shortages as a factor limiting production. Last observation is 2019Q1.
C.Shares are calculated from exports in millions of U.S. dollars.
D.Figure shows the 2018 averages for remittances, and the 2016-17 averages for foreign direct investment, based on data availability.
E.Figure shows total public and private external debt stocks as a share of GDP in 2017, as in Kose et al. (2017). “Other EMDEs” are all other EMDEs that are not in the Europe and Central Asia region.
F.Fiscal cost is measured as gross fiscal outlays and the change in the government financial position due to a contingent liability realization, as estimated by Bova et al. (2016). The data cover episodes from 1990 to 2014. Types of contingent liabilities include those that involved public sector bailouts for the financial sector, SOEs, the private non-financial sector, PPPs, and others, as defined by Bove et al. (2016).
Click here to download data and charts.
vk.com/id446425943
98 |
C H AP T E R 2 . 2 |
G L O BAL EC O NO M I C P ROS P EC T S | J U NE 2 0 1 9 |
|
|
|
Euro Area and increasingly binding domestic capacity constraints (Figure 2.2.2.B). Fiscal stimulus, and the resulting boost to private consumption, will begin to fade in some of the subregion’s largest economies by 2020 (Hungary, Poland, Romania). Shrinking working-age populations, partly reflecting emigration to western Europe in recent years, limits mediumterm growth prospects in Central Europe. Tepid private investment growth could weaken further in the absence of sustained progress on structural reforms.
Growth is expected to moderate over the forecast horizon in both Eastern Europe and Central Asia. These regions face a more challenging external environment as growth decelerates in major trading partners, such as the Euro Area and Russia. The pace of future growth in both subregions depends on the successful implementation of structural reforms to improve the business environment, achieve debt sustainability, and restructure state-owned enterprises (Belarus, Kyrgyz Republic, Moldova, Ukraine, Uzbekistan; EBRD 2017; Funk, Isakova, and Ivanyna 2017). In Central Asia, modest growth in Russia and low productivity will weigh on activity in the region’s largest economy, Kazakhstan.
Growth in the South Caucasus subregion is projected to strengthen to 4.2 percent by 2021, from 2.6 percent in 2018, assuming the continued implementation of domestic reforms and infrastructure investment. Activity in the region’s largest economy, Azerbaijan, will be boosted by a new natural gas pipeline coming on stream, although this will be partly offset by the effects of weak credit growth arising from problems in the financial sector. In Armenia and Georgia, growth is expected to firm, partly on account of increased government investment.
Growth in the Western Balkans is projected to be broadly stable, dipping to 3.5 percent in 2019 but returning to 3.9 percent by 2021. This forecast is predicated on political stability and policy uncertainty remaining in check. Infrastructure investment and private consumption will help deliver robust growth in some economies (Kosovo,
North Macedonia, Serbia), while a deceleration in public and private investment will slow growth in others (Albania, Montenegro; World Bank 2019d).
In Russia, the projection for 2019 has been downgraded to 1.2 percent, reflecting oil production cuts. Tighter monetary policy, combined with a value-added tax hike at the beginning of 2019, are also contributing to weaker growth momentum in the remainder of 2019. Private investment remains tepid due to policy uncertainty and prospects for slowing potential growth over the longer term due to worsening demographic pressures.
In Turkey, growth is expected to be weighed down by increased inflation and associated pressure on real incomes, banking and corporate sector deleveraging following several years of rapid credit growth, and low business and consumer confidence. Activity is expected to bottom out in 2019, with annual growth contracting 1 percent, but the recent flare up in financial market pressures highlight that downside risks remain sharply elevated. The recovery is assumed to strengthen in 2020 through gradual improvement in domestic demand and continued strength in net exports, provided that fiscal and monetary policy avert further sharp falls in the lira and corporate debt restructurings help avoid serious damage to the financial system.
In Poland, growth in 2019-20 will be buoyed by a recently announced fiscal stimulus package, amounting to roughly 2 percent of GDP. This fiscal expansion aims to boost private consumption through various social transfers and income tax reduction schemes. Nevertheless, growth is expected to slow over the forecast horizon, to 3.3 percent by 2021 from a peak of 5.1 percent in 2018, as domestic capacity constraints and slowing investment weigh on growth.
Over the long term, regional growth could be hindered by worsening demographic trends, in conjunction with tepid productivity and investment growth (World Bank 2018c; Bussolo, Koettl, and Sinnott 2015; EBRD 2018).
vk.com/id446425943
G L O BAL EC O NO M I C P ROS P EC T S | J U NE 2 0 1 9 |
E U RO PE AN D C E N T RAL AS I A |
99 |
|
|
|
Structural reforms that close remaining investment gaps, encourage privatization, and promote FDI and greater participation in global value chains could help boost productivity in the region (EBRD 2015; Gould 2018; Chapter 1). Greater economic integration and regional coordination could also help spur innovation and competition, unleashing the region’s growth potential (Kunzel et al. 2019).
Risks
The region’s outlook remains subject to significant downside risks. Chief among these is a sharper- than-expected slowdown in ECA’s most important trading partner, the Euro Area. The Euro Area purchased the majority of ECA exports in 2017, while total foreign direct investment inflows accounted for over 7 percent of GDP in Central Europe (Figure 2.2.2.C). In Central Asia and Eastern Europe, slowing activity in Russia could impact remittance inflows, which account for an important proportion of income (Kyrgyz Republic, Moldova, Tajikistan, Ukraine; Figure 2.2.2.D).
The financial stress in Turkey has had limited spillovers to the other economies in the region. However, the experience of Turkey is a stark reminder of the risk of sudden shifts in investor sentiment—in particular for countries with large current account deficits or reliance on potentially volatile capital inflows, high external debt loads, or
sizable foreign-currency-denominated debt (Belarus, Croatia, Georgia, Kyrgyz Republic, Moldova, Tajikistan, Ukraine; Figure 2.2.2.E).
Increases in policy uncertainty could undermine business and investor confidence in the region. Policy disagreements between the European Union and some Central European countries could deter international investors and reduce fiscal transfers. Election outcomes in some of the region’s largest economies could also elevate policy uncertainty. Further escalation of international trade restrictions could have a negative impact on the region, given its openness to trade and capital flows. A reversal of structural reforms remains a risk in many countries, especially Armenia, Azerbaijan, Belarus, Turkey, and Ukraine. Renewed conflict in the Syrian Arab Republic or Ukraine could trigger new sanctions.
Fiscal risks have increased in the ECA region despite more benign global financing conditions in 2019, as corporate debt has risen, with large shares of foreign-currency-denominated debt (Belarus, Kyrgyz Republic, Moldova, Ukraine). The rapid increase in private sector debt in ECA over the past decade has come with growing contingent liabilities for the public sector— potential bailouts of systemic private liabilities would come at a high cost. Past episodes of realized contingent liabilities have imposed large fiscal costs in the region (Figure 2.2.2.F; Bova et al. 2016).

vk.com/id446425943
100 C H AP T E R 2 . 2 G L O BAL EC O NO M I C P ROS P EC T S | J U NE 2 0 1 9
TABLE 2.2.1 Europe and Central Asia forecast summary
Percentage point differences
(Real GDP growth at market prices in percent, unless indicated otherwise) |
|
|
|
|
from January 2019 projections |
||||||
|
|
|
|
|
|
|
|
|
|||
|
|
|
|
|
|
|
|
|
|
|
|
|
2016 |
2017 |
2018e |
2019f |
2020f |
2021f |
|
2019f |
2020f |
2021f |
|
EMDE ECA, GDP1 |
1.9 |
4.1 |
3.1 |
|
1.6 |
2.7 |
2.9 |
|
-0.7 |
0.0 |
0.0 |
EMDE ECA, GDP excl. Turkey |
1.5 |
3.0 |
3.3 |
|
2.4 |
2.6 |
2.6 |
|
-0.2 |
0.0 |
0.1 |
|
|
|
|
|
|
|
|
||||
(Average including countries with full national accounts and balance of payments data only)2 |
|
|
|||||||||
EMDE ECA, GDP2 |
1.8 |
4.1 |
3.1 |
|
1.5 |
2.6 |
2.9 |
|
-0.8 |
-0.1 |
0.0 |
GDP per capita (U.S. dollars) |
1.4 |
3.7 |
2.7 |
|
1.2 |
2.4 |
2.7 |
|
-0.8 |
0.0 |
0.0 |
PPP GDP |
1.8 |
3.9 |
3.1 |
|
1.6 |
2.7 |
2.9 |
|
-0.7 |
0.0 |
0.0 |
Private consumption |
1.4 |
4.8 |
3.0 |
|
1.4 |
2.6 |
2.7 |
|
-1.0 |
-0.6 |
-0.2 |
Public consumption |
3.1 |
3.1 |
1.6 |
|
1.6 |
1.6 |
1.8 |
|
-0.9 |
-0.6 |
-0.3 |
Fixed investment |
-0.1 |
6.3 |
2.6 |
|
-0.8 |
3.3 |
3.6 |
|
-3.1 |
-1.3 |
-1.2 |
Exports, GNFS3 |
4.0 |
7.1 |
5.7 |
|
4.0 |
4.2 |
4.0 |
|
-1.3 |
-0.1 |
-0.5 |
Imports, GNFS3 |
3.5 |
10.7 |
3.2 |
|
3.2 |
5.4 |
5.8 |
|
-1.9 |
-0.4 |
0.0 |
Net exports, contribution to growth |
0.3 |
-0.7 |
1.0 |
|
0.5 |
-0.2 |
-0.4 |
|
0.2 |
0.0 |
-0.2 |
Memo items: GDP |
|
|
|
|
|
|
|
|
|
|
|
|
|
|
|
|
|
|
|
|
|
|
|
Commodity exporters4 |
0.7 |
2.1 |
|
|
|
|
|
|
|
|
|
2.7 |
|
1.8 |
2.2 |
2.3 |
|
-0.2 |
0.0 |
0.0 |
|||
Commodity importers5 |
3.1 |
6.0 |
3.6 |
|
1.4 |
3.1 |
3.5 |
|
-1.2 |
-0.1 |
-0.1 |
Central Europe6 |
3.4 |
5.0 |
4.6 |
|
3.7 |
3.3 |
3.1 |
|
0.1 |
0.0 |
0.1 |
Western Balkans7 |
3.2 |
2.6 |
3.9 |
|
3.5 |
3.8 |
3.9 |
|
0.0 |
0.0 |
0.1 |
Eastern Europe8 |
0.9 |
2.6 |
3.2 |
|
2.4 |
2.7 |
3.0 |
|
-0.5 |
-0.4 |
-0.4 |
South Caucasus9 |
-1.6 |
2.0 |
2.6 |
|
3.7 |
3.9 |
4.2 |
|
-0.3 |
0.1 |
0.8 |
Central Asia10 |
2.9 |
4.6 |
4.7 |
|
4.2 |
4.0 |
4.1 |
|
0.0 |
0.0 |
0.0 |
Russia |
0.3 |
1.6 |
2.3 |
|
1.2 |
1.8 |
1.8 |
|
-0.3 |
0.0 |
0.0 |
Turkey |
3.2 |
7.4 |
2.6 |
|
-1.0 |
3.0 |
4.0 |
|
-2.6 |
0.0 |
-0.2 |
Poland |
3.1 |
4.8 |
5.1 |
|
4.0 |
3.6 |
3.3 |
|
0.0 |
0.0 |
0.0 |
|
|
|
|
|
|
|
|
|
|
|
|
Source: World Bank.
Note: e = estimate; f = forecast. EMDE = emerging market and developing economies. World Bank forecasts are frequently updated based on new information and changing (global) circumstances. Consequently, projections presented here may differ from those contained in other Bank documents, even if basic assessments of countries’ prospects do not differ at any given moment in time.
1.GDP at market prices and expenditure components are measured in constant 2010 U.S. dollars.
2.Sub-region aggregate excludes Bosnia and Herzegovina, Kosovo, Montenegro, Serbia, Tajikistan, and Turkmenistan, for which data limitations prevent the forecasting of GDP components.
3.Exports and imports of goods and non-factor services (GNFS).
4.Includes Albania, Armenia, Azerbaijan, Kazakhstan, the Kyrgyz Republic, Kosovo, Russia, Tajikistan, Turkmenistan, Ukraine, and Uzbekistan.
5.Includes Belarus, Bosnia and Herzegovina, Bulgaria, Croatia, Georgia, Hungary, Moldova, Montenegro, North Macedonia, Poland, Romania, Serbia, and Turkey.
6.Includes Bulgaria, Croatia, Hungary, Poland, and Romania.
7.Includes Albania, Bosnia and Herzegovina, Kosovo, Montenegro, North Macedonia, and Serbia.
8.Includes Belarus, Moldova, and Ukraine.
9.Includes Armenia, Azerbaijan, and Georgia.
10.Includes Kazakhstan, the Kyrgyz Republic, Tajikistan, Turkmenistan, and Uzbekistan.
Click here to download data.