

Global Economic Prospects -World Bank_watermark
.pdfvk.com/id446425943
G L O BAL EC O NO M I C P ROS P EC T S | J U NE 2 0 1 9 |
M I D D L E E AS T AN D NO RT H AF RI C A 111 |
|
|
GCC economies (World Bank 2019f; Figure 2.4.2.A).2 An improved regulatory and business environment in the GCC will remain supportive of private sector activity. Growth in Iran is expected to resume in 2020-21, albeit at weak rates, as the impact of U.S. sanctions tapers and inflation stabilizes. Algeria’s growth is expected to remain subdued as an expected return to fiscal consolidation weighs on non-oil activity.
FIGURE 2.4.2 MENA: Outlook and risks
Stronger momentum in the non-oil sector in the GCC, aided by a pause in rate hikes, is expected to support activity. There are several risks to the growth outlook, however. Slower-than-expected reforms could hamper not only structural adjustment, but also efforts to diversify away from commodities. Trade disputes among major economies could weigh on external demand for both oil exporters and importers. Persistently lower-than- expected growth in the Euro Area would constrain external demand for oil importers.
A. GCC interest rates |
B. Political stability and business |
|
climate |
Growth in oil importers is expected to rise steadily from 3.9 percent in 2018 to 4.7 percent in 2021, led by expansions in the larger economies. These projections are predicated on business climate reforms to support investment, healthy tourism activity, and a slight easing in political risks. Growth prospects in smaller oil importers (Jordan, Lebanon, West Bank and Gaza) are highly uncertain, however, as business and consumer confidence are contingent on anticipated reforms or foreign financial assistance. Banking sector weakness and high public debt form significant constraints on growth in smaller oil importers. Nonetheless, tourism and renewed bilateral trade opportunities (for instance, between Syria and Jordan), aided by the easing of conflicts and by policy initiatives, are expected to continue supporting activity in most oil importers.
Continued IMFand World Bank-supported policy programs in many economies (e.g., Egypt, Morocco) will promote structural adjustment, such as stronger fiscal management frameworks, more vibrant small business entrepreneurship, and electricity access; however, in other cases economic prospects are contingent upon successful policy resolution in some newly formed governments (for instance, Lebanon). New reforms, such as investment, industrial licensing and procurement laws in Egypt; small and medium enterprise financing liberalizations in the United Arab Emirates; and participation of Djibouti in the Convention on the Settlement of Investment Disputes between States and Nationals of Other States, are expected to help relieve constraints in
2 The OPEC+ cuts are scheduled to expire in June and talks for renewal will commence soon thereafter. The recent decision by the U.S. to end its Iran sanctions waivers and OPEC’s reaction on oil prices are expected to serve as inputs to these meetings.
C. Export Market Penetration Index |
D. Euro Area trade exposure |
Sources: Haver Analytics, International Country Risk Guide, International Monetary Fund, World Bank.
A.GCC economies include Bahrain, Kuwait, Oman, Qatar, Saudi Arabia, and the United Arab Emirates. Bahrain and Qatar have the same deposit rate values during the period denoted. Last observation is April 2019.
B.Political stability rating denotes the political risk rating of the International Country Risk Guide. Business climate score denotes the overall Doing Business “distance to frontier” of the World Bank’s Doing Business report. Figure shows unweighted averages. Latest observation in 2018.
C.Export Market Penetration index is based on the number of countries to which the reporter exports a particular product divided by the number of countries that report importing the product from global suppliers that year. Based on 2017 or latest available year of data. Includes 20 MENA economies.
D.Goods trade to Euro Area as a percent of total exports or imports for each subgroup denoted. Based on 2018 data. Includes 6 GCC economies, 3 non-GCC oil exporters, and 7 oil importers.
Click here to download data and charts.
the corporate sector and support investor confidence.
Risks
Risks remain tilted to the downside for both oil exporters and importers, but for different reasons. Geopolitical risks are elevated in some oil exporters, while political challenges remain high in oil importers. Peace remains fragile in conflictaffected economies (e.g., uncertainty over the UNcoordinated truce in the Yemen war), and economic and social mobility of refugees (e.g.,
vk.com/id446425943
112 C H AP T E R 2 . 4 |
G L O BAL EC O NO M I C P ROS P EC T S | J U NE 2 0 1 9 |
|
|
Syria) are still highly constrained (World Bank 2019g). Further amplification of U.S.-Iran tensions would pose risks for the region’s economies other than Iran.
Developments in oil production in Iran, Venezuela, and the United States could add volatility to oil prices, and this could complicate or stall fiscal adjustment in both oil exporters and oil importers, including their subsidy reforms and other fiscal adjustment programs. Uncertainty about oil prices may dampen oil exporters’ investment and social programs. Impact on oil exporters could also dampen capital inflows and investment to oil importers via FDI and remittance linkages. Moreover, oil price volatility may also translate to significant adjustment costs for oil importers, including in countries with still elevated energy subsidies.
Slower-than-expected reforms would weigh on regional activity, especially for oil importers. Although some political uncertainties in the region have been resolved (for example, formation of new governments), risks of reform delays or reversals remain, owing to budgetary concerns and lack of political consensus. Higher political risk, by generating uncertainty and dampening investor confidence, has been associated with weaker business climate in the region (Figure 2.4.2.B). Reconstruction in Iraq has been proceeding at a moderate pace, and materialization of its benefits in 2020 remains uncertain. Sustained implementation of reforms in oil importers is crucial for their medium-term growth, and backloaded fiscal consolidation under high debt levels in these economies may worsen the risk overhang for the private sector and generate additional uncertainty. Sustained structural reforms are also necessary to put MENA economies’ current accounts on a more sustained path (Arezki et al. 2019) and to more fully untap their export potential, such as higher market penetration (Youssef and Zaki 2019; Figure 2.4.2.C).
Further escalation of trade tensions remains a key risk. Increased trade restrictions could dampen external demand from major trading partners, including the Euro Area (Figure 2.4.2.D). Relatedly, persistently weaker-than-expected activity in major trading partners, particularly the Euro Area, could weigh further on external demand from these economies and weaken remittance flows (World Bank 2019d). This risk may be partly mitigated by enhanced regional trade capacity (for instance, Djibouti export logistics hub development).
Interest rates in the GCC economies have moved broadly in tandem with U.S. rates, reflecting the general pegging of their currencies to the U.S. dollar. The recent pause of advanced-economy monetary policy normalization and renewed risk appetite for GCC assets have been supportive for GCC financial assets. Nonetheless, GCC economies have relatively open capital accounts, and a resumed tightening of external financing conditions is a downside risk to capital flows. In non-GCC economies, banking sectors are vulnerable in some cases due to exposure to sovereign risks associated with high public debt and policy uncertainty. Among oil importers, average public debt level is about 90 percent of GDP, exposing these economies to rollover risks and fluctuations in global interest rates. In GCC economies, public debt levels are lower but increased capital market access (e.g., large bond issuances) will subject them to volatility in global financial markets alongside the beneficial effects of financial market deepening.
On the upside, rising spending on infrastructure in conflict-affected countries (e.g., Iraq) may generate positive spillovers to neighboring economies. These include spending in soft infrastructure, such as broadband internet and mobile phone, that may broaden access to service delivery in areas like education, health, and financial services.

vk.com/id446425943
G L O BAL EC O NO M I C P ROS P EC T S | J U NE 2 0 1 9 M I D D L E E AS T AN D NO RT H AF RI C A 113
TABLE 2.4.1 Middle East and North Africa forecast summary
Percentage point differences
(Real GDP growth at market prices in percent, unless indicated otherwise) |
|
|
|
|
from January 2019 projections |
|||||
|
|
|
|
|
|
|
|
|||
|
|
|
|
|
|
|
|
|
|
|
|
2016 |
2017 |
2018e |
2019f |
2020f |
2021f |
|
2019f |
2020f |
2021f |
|
|
|
|
|
|
|
|
|
|
|
EMDE MENA, GDP1 |
5.1 |
1.2 |
1.4 |
1.3 |
3.2 |
2.7 |
|
-0.6 |
0.5 |
0.0 |
(Average including countries with full national accounts and balance of payments data only)2 |
|
|
||||||||
EMDE MENA, GDP2 |
4.7 |
1.4 |
1.5 |
1.1 |
2.9 |
2.7 |
|
-0.5 |
0.2 |
0.0 |
GDP per capita (U.S. dollars) |
2.8 |
-0.3 |
-0.1 |
-0.4 |
1.5 |
1.4 |
|
-0.5 |
0.2 |
0.0 |
PPP GDP |
5.0 |
1.7 |
1.6 |
1.1 |
3.0 |
2.8 |
|
-0.5 |
0.2 |
0.0 |
Private consumption |
2.9 |
2.2 |
0.8 |
1.3 |
1.9 |
2.1 |
|
-0.3 |
-0.4 |
-0.2 |
Public consumption |
-6.3 |
2.9 |
0.9 |
1.4 |
1.4 |
1.0 |
|
0.3 |
-0.5 |
-0.9 |
Fixed investment |
-0.3 |
2.4 |
3.7 |
4.4 |
5.7 |
6.4 |
|
0.8 |
1.0 |
1.6 |
Exports, GNFS3 |
9.6 |
4.1 |
3.8 |
0.4 |
3.9 |
3.6 |
|
-1.4 |
0.5 |
0.2 |
Imports, GNFS3 |
-0.8 |
6.3 |
1.4 |
1.9 |
3.3 |
3.8 |
|
0.0 |
0.2 |
0.7 |
Net exports, contribution to growth |
4.8 |
-0.2 |
1.4 |
-0.5 |
0.8 |
0.4 |
|
-0.7 |
0.3 |
-0.1 |
Memo items: GDP |
|
|
|
|
|
|
|
|
|
|
|
|
|
|
|
|
|
|
|
|
|
Oil exporters4 |
5.6 |
0.7 |
|
|
|
|
|
|
|
|
0.9 |
0.7 |
2.9 |
2.2 |
|
-0.7 |
0.6 |
-0.1 |
|||
GCC countries5 |
2.4 |
-0.3 |
1.9 |
2.1 |
3.2 |
2.7 |
|
-0.5 |
0.5 |
0.0 |
Saudi Arabia |
1.7 |
-0.7 |
2.2 |
1.7 |
3.1 |
2.3 |
|
-0.4 |
0.9 |
0.1 |
Iran |
13.4 |
3.8 |
-1.9 |
-4.5 |
0.9 |
1.0 |
|
-0.9 |
-0.2 |
-0.1 |
Oil importers6 |
2.9 |
3.8 |
3.9 |
4.1 |
4.5 |
4.7 |
|
-0.1 |
-0.1 |
0.0 |
Egypt |
4.3 |
4.8 |
5.4 |
5.7 |
5.9 |
6.0 |
|
0.0 |
0.0 |
0.0 |
Fiscal year basis7 |
4.3 |
4.2 |
5.3 |
5.5 |
5.8 |
6.0 |
|
-0.1 |
0.0 |
0.0 |
Source: World Bank.
Note: e = estimate; f = forecast. EMDE = emerging market and developing economies. World Bank forecasts are frequently updated based on new information and changing (global) circumstances. Consequently, projections presented here may differ from those contained in other Bank documents, even if basic assessments of countries’ prospects do not differ at any given moment in time.
1.GDP at market prices and expenditure components are measured in constant 2010 U.S. dollars. Excludes Libya, Syria, and Yemen due to data limitations.
2.Aggregate includes all countries in notes 4 and 6 except Djibouti, Iraq, Qatar, and West Bank and Gaza, for which data limitations prevent the forecasting of GDP components.
3.Exports and imports of goods and non-factor services (GNFS).
4.Oil exporters include Algeria, Bahrain, Iran, Iraq, Kuwait, Oman, Qatar, Saudi Arabia, and the United Arab Emirates.
5.The Gulf Cooperation Council (GCC) includes Bahrain, Kuwait, Oman, Qatar, Saudi Arabia, and the United Arab Emirates.
6.Oil importers include Djibouti, Egypt, Jordan, Lebanon, Morocco, Tunisia, and West Bank and Gaza.
7.The fiscal year runs from July 1 to June 30 in Egypt; the column labeled 2018 reflects the fiscal year ended June 30, 2018.
Click here to download data.

vk.com/id446425943
114 C H AP T E R 2 . 4 G L O BAL EC O NO M I C P ROS P EC T S | J U NE 2 0 1 9
TABLE 2.4.2 Middle East and North Africa economy forecasts1 |
|
|
|
Percentage point differences |
|||||||
|
|
|
|
|
|
|
|
|
|||
(Real GDP growth at market prices in percent, unless indicated otherwise) |
|
|
|
|
from January 2019 projections |
||||||
|
|
|
|
|
|
|
|
|
|
|
|
|
2016 |
2017 |
2018e |
2019f |
2020f |
2021f |
|
2019f |
2020f |
2021f |
|
Algeria |
3.2 |
1.4 |
1.5 |
|
1.9 |
1.7 |
1.4 |
|
-0.4 |
-0.1 |
-0.4 |
Bahrain |
3.5 |
3.8 |
1.8 |
|
2.0 |
2.2 |
2.8 |
|
-0.6 |
-0.6 |
0.0 |
Djibouti |
9.1 |
4.1 |
6.0 |
|
7.0 |
7.5 |
8.0 |
|
-0.3 |
0.0 |
0.5 |
Egypt |
4.3 |
4.8 |
5.4 |
|
5.7 |
5.9 |
6.0 |
|
0.0 |
0.0 |
0.0 |
Fiscal year basis2 |
4.3 |
4.2 |
5.3 |
|
5.5 |
5.8 |
6.0 |
|
-0.1 |
0.0 |
0.0 |
Iran |
13.4 |
3.8 |
-1.9 |
|
-4.5 |
0.9 |
1.0 |
|
-0.9 |
-0.2 |
-0.1 |
Iraq |
13.6 |
-1.7 |
0.6 |
|
2.8 |
8.1 |
2.3 |
|
-3.4 |
5.2 |
-0.5 |
Jordan |
2.0 |
2.1 |
2.0 |
|
2.2 |
2.4 |
2.6 |
|
-0.1 |
0.0 |
-0.1 |
Kuwait |
2.9 |
-3.5 |
1.2 |
|
1.6 |
3.0 |
2.9 |
|
-2.0 |
-0.6 |
-0.7 |
Lebanon |
1.6 |
0.6 |
0.2 |
|
0.9 |
1.3 |
1.5 |
|
-0.4 |
-0.2 |
0.0 |
Morocco |
1.1 |
4.1 |
3.0 |
|
2.9 |
3.5 |
3.6 |
|
0.0 |
0.0 |
0.1 |
Oman |
5.0 |
-0.9 |
2.1 |
|
1.2 |
6.0 |
2.8 |
|
-2.2 |
3.2 |
0.0 |
Qatar |
2.1 |
1.6 |
1.4 |
|
3.0 |
3.2 |
3.4 |
|
0.3 |
0.2 |
0.4 |
Saudi Arabia |
1.7 |
-0.7 |
2.2 |
|
1.7 |
3.1 |
2.3 |
|
-0.4 |
0.9 |
0.1 |
Tunisia |
1.1 |
2.0 |
2.5 |
|
2.7 |
3.2 |
3.5 |
|
-0.2 |
-0.2 |
-0.1 |
United Arab Emirates |
3.0 |
0.8 |
1.7 |
|
2.6 |
3.0 |
3.2 |
|
-0.4 |
-0.2 |
0.0 |
West Bank and Gaza |
4.7 |
3.1 |
0.9 |
|
0.5 |
1.0 |
1.6 |
|
-1.4 |
-0.9 |
-0.3 |
|
|
|
|
|
|
|
|
|
|
|
|
Source: World Bank.
Note: e = estimate; f = forecast. World Bank forecasts are frequently updated based on new information and changing (global) circumstances. Consequently, projections presented here may differ from those contained in other Bank documents, even if basic assessments of economies’ prospects do not significantly differ at any given moment in time.
1.GDP at market prices and expenditure components are measured in constant 2010 U.S. dollars. Excludes Libya, Syria, and Yemen due to data limitations.
2.The fiscal year runs from July 1 to June 30 in Egypt; the column labeled 2018 reflects the fiscal year ended June 30, 2018.
Click here to download data.

vk.com/id446425943
South Asia continued to enjoy solid economic activity in 2018, posting 7 percent GDP growth due to robust domestic demand. Pakistan was a notable exception, with a broad-based weakening of domestic demand over the past year against the backdrop of tightening policies aimed at addressing the country’s macroeconomic imbalances. Regional growth is projected to remain close to 7 percent a year over the forecast horizon, as it continues to benefit from strong private consumption and investment. The main risks to the outlook include a re-escalation of political uncertainty and regional tensions, financial sector weakness due to nonperforming assets, fiscal challenges amid elections in several countries, and a sharper-than-expected weakening of growth in major economies.
Recent developments
South Asia’s growth remains robust despite headwinds from the global economy amid weakening trade and manufacturing. Regional output is estimated to have expanded by 7 percent in 2018 (Figure 2.5.1.A). Economic activity was underpinned by strong private domestic demand. Private consumption and investment remained robust in much of the region, offsetting a slowdown in Pakistan. Government spending growth moderated in 2018, expanding closer to historical averages following rapid growth in 2017. Net exports continued to contribute negatively to regional growth, with import growth remaining stronger than export growth amid solid domestic demand (World Bank 2019h).
Regional inflation has remained moderate in most countries, partly reflecting broadly stable commodity prices (Figure 2.5.1.B). However, Pakistan has recently experienced a significant rise in inflation driven by currency depreciation, which was followed by several policy rate hikes over the course of FY2018/19.
There has been limited progress in fiscal consolidation in the region (Figure 2.5.1.C). Recently announced budget plans indicate
Note: This section was prepared by Temel Taskin. Research assistance was provided by Ishita Dugar.
divergent developments. India has announced a package of direct benefits to farmers and some tax breaks for the middle class while others (Pakistan, Sri Lanka) are on paths of fiscal consolidation to tackle sizable deficits. Current account deficits broadly widened last year, but recent data show signs of narrowing in a context of more stable oil prices (Figure 2.5.1.D).
In India, the largest economy in the region, GDP grew by 7.2 percent in FY2018/19 (April 1, 2018 to March 31, 2019)—the same pace as shown for the previous year by upwardly revised data. A slowdown in government consumption was offset by solid investment, which benefited from both private investment and public infrastructure spending. Urban consumption was supported by a pickup in credit growth, whereas rural consumption was hindered by soft agricultural prices. On the production side, robust growth was broad-based, with a slight moderation in services and agricultural activity accompanied by an acceleration in the industrial sector. Weakening agricultural production reflected subdued harvest in major crops on the back of less rainfalls. Services activity softened mainly due to slowing trade, hotel, transport, and communication activity. The industrial sector benefited from strong manufacturing and construction with solid demand for capital goods. The slowing momentum in economic activity in late 2018 carried into the first quarter of 2019, as suggested
vk.com/id446425943
116 C H AP T E R 2 . 5 |
G L O BAL EC O NO M I C P ROS P EC T S | J U NE 2 0 1 9 |
|
|
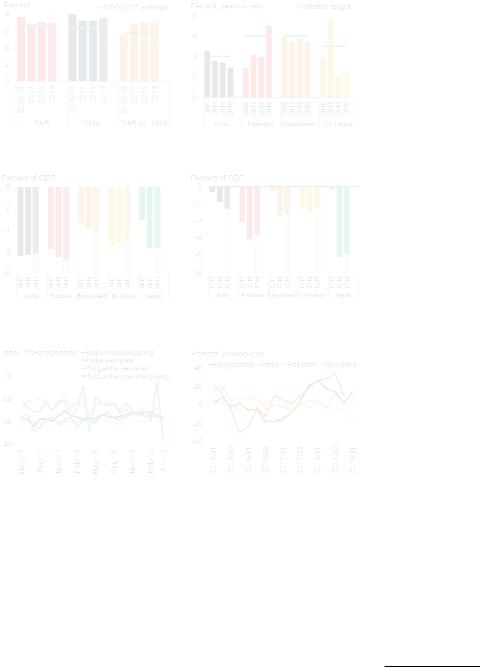
FIGURE 2.5.1 SAR: Recent developments
Growth in South Asia picked up to 7 percent in from 6.7 percent in 2017. Inflation has softened in most countries, partly reflecting broadly stable commodity prices. There has been limited progress in fiscal consolidation in the region. Current account deficits mostly widened last year, but recent data show signs of narrowing amid more stable oil prices. PMIs have softened in the first half of 2019. Remittances inflows broadly picked up in 2018.
A. Growth |
B. Inflation |
|
|
C. Fiscal balances |
D. Current account balances |
E. Purchasing Managers’ Indexes |
F. Net remittance inflow growth |
Source: Haver Analytics, World Bank.
A.SAR = South Asia Region. Shaded areas indicate forecasts. Aggregate growth rates calculated using constant 2010 U.S. dollar GDP weights. Data for 2018 are estimates.
B.Last observation is March 2019 for Bangladesh and April 2019 for India, Pakistan, and Sri Lanka. The 2019 data represent average y/y inflation year-to-date. The data refer to fiscal years of countries except for Sri Lanka, as described in Table 2.5.1.
C.D. Shaded areas indicate forecasts. Data for 2018 are estimates. The data refer to fiscal years of countries except for Sri Lanka, as described in Table 2.5.1.
E.PMI readings above 50 indicate expansion in economic activity; readings below 50 show contraction. Last observation is April 2019.
F.Data present the workers' remittances and compensation received by countries. The last available observation is 2018Q4 for India and 2019Q1 for Bangladesh, Pakistan, and Sri Lanka.
Click here to download data and charts.
by softening services and manufacturing Purchasing Managers’ Indexes (Figure 2.5.1.E).
Elsewhere in the region, Pakistan’s growth is estimated to decelerate to 3.4 percent in
FY2018/19 (July 16, 2018 to July 15, 2019) from 5.8 percent in the previous fiscal year.1 This slowdown reflects a broad-based weakening of domestic demand amid monetary and fiscal policy tightening designed to address macroeconomic imbalances, particularly large fiscal and current account deficits. These have contributed to a considerable decline in international reserves to levels that would cover less than three months of imports (World Bank 2018c). On the production side, recent high-frequency data indicate a notable weakening in both manufacturing and agricultural sectors. Inflation increased considerably during the past fiscal year, reflecting currency depreciation. Recently, financial assistance from Gulf countries and China, as well as an IMF program have helped partially rebuild confidence.
In Bangladesh, GDP is estimated to expand by 7.3 percent in FY2018/19 (July 1, 2018 to June 30, 2019), 0.3 percentage point higher than the previous projection, as a recovery in remittance inflows, stemming from improving economic activity in source countries (Figure 2.5.1.F) supported private consumption. While private investment benefited from the improved outlook for political stability, public investment was underpinned by progress in infrastructure projects. In the first half of FY2018/19, exports to the United States and China increased significantly, especially textile and apparel, in part reflecting trade diversion due to bilateral tariff increases between these two countries (World Bank 2018f).
Growth in Sri Lanka slowed marginally to 3.2 percent in 2018, on account of weaker domestic demand. Decline in international reserves and elevated political controversy contributed to depressed investor sentiment and Sri Lanka’s sovereign credit rating was downgraded by one notch by some rating agencies in 2018 (World Bank 2019i). Activity remained soft in the first quarter of 2019, constrained by tight monetary policy. While last year’s political turbulence has largely been resolved, recent security-related incidents are weighing on confidence and activity.
1 Pakistani authorities have revised the growth estimate for FY2017/18 from 5.8 percent to 5.2 percent in February 2019. However, the complete revised national accounts have not yet been published, which is why the earlier figure is used in this document.
vk.com/id446425943
G L O BAL EC O NO M I C P ROS P EC T S | J U NE 2 0 1 9 |
S O U T H AS I A |
117 |
|
|
|
In Afghanistan, GDP growth decelerated to 1 percent in 2018, partly owing to a severe drought and increased political uncertainty. Nepal’s GDP expanded by 6 percent in FY2018/19 on the back of solid services and industrial sector growth (World Bank 2018g). In Bhutan and Maldives, economic growth in 2018 continued to be underpinned by infrastructure projects and tourism. Maldives’ GDP expanded 7.9 percent in 2018, reflecting solid tourism receipts and a strong construction sector growth with robust credit growth and infrastructure projects. In Bhutan, economic activity decelerated to an estimated 5.4 percent in FY2018/19 (July 1, 2018 to June 30, 2019) as investment softened with delayed hydropower projects.
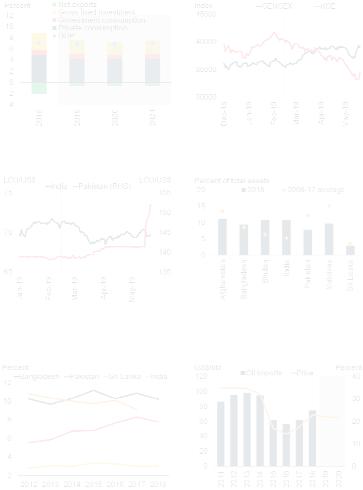
FIGURE 2.5.2 SAR: Outlook and risks
Domestic demand is expected to remain solid next year, with support from monetary and fiscal policies in some cases, whereas contribution of net exports will be limited with the subdued global trade outlook. The elevated tension between major South Asian economies in mid-February did not have a major immediate effect on financial markets, but a re-escalation might reduce confidence and weigh on investment. Nonperforming assets could remain elevated and weigh on credit growth unless further steps are taken to enhance effectiveness of the resolution mechanisms. Uncertainty about the Brexit process poses a risk to some South Asian economies that have preferential trade agreements with the European Union. A higher-than -expected increase in oil prices would increase current account deficits and inflation in the region.
A. Growth components |
B. Stock market indexes |
|
|
|
|
Outlook
The outlook for South Asia over the forecast horizon is expected to remain solid. Regional GDP is expected to expand 6.9 percent in 2019, 0.2 percentage point down from previous projections owing to downward revisions for Pakistan, but to pick up to 7 percent in 2020 and 7.1 percent in 2021. Domestic demand growth is expected to remain solid, with support from monetary and fiscal policies in some cases (such as India). The contribution of exports to economic activity is expected to remain weak with moderate global trade growth. (World Bank 2018h; Figure 2.5.2.A).
In India, growth is projected at 7.5 percent in FY2019/20 (April 1, 2019 to March 31, 2020), unchanged from the previous forecast, and to stay at this pace through the next two fiscal years. Private consumption and investment will benefit from strengthening credit growth amid more accommodative monetary policy, with inflation having fallen below the Reserve Bank of India’s target. Support from delays in planned fiscal consolidation at the central level should partially offset the effects of political uncertainty around elections in FY2018/19 (Beyer and Milivojevic 2019; World Bank, forthcoming).
Pakistan’s growth is expected to slow further, to 2.7 percent, in FY2019/20 with domestic demand remaining depressed. Current account and fiscal
C. Nominal exchange rates
E. Shares of exports to the United Kingdom
D. Nonperforming assets
F. Oil prices and share of oil in imports
Source: Export Promotion Bureau of Bangladesh, Haver Analytics, International Monetary Fund, World Bank.
A.Aggregate growth rates calculated using constant 2010 U.S. dollar GDP weights. Data for 2018 are estimates.
B.SENSEX and KSE are major stock market indexes of India and Pakistan, respectively. The vertical line marks February 15, 2019. Last observation is May 22, 2019.
C.The foreign exchange rates are Indian rupee and Pakistan rupee per U.S. dollar. The vertical line marks February 15, 2019. Last observation is May 21, 2019 for India and May 22, 2019 for Pakistan.
D.Last observation is 2018Q2 for Afghanistan, Bhutan, India, Pakistan, Maldives, and 2018Q1 for Sri Lanka. Bangladesh observation is 2017.
E.Last observation is 2017 for Sri Lanka and 2018 for the rest. Data show exports to the United Kingdom as a share of total exports.
F.Oil imports data cover Bangladesh, India, Pakistan, and Sri Lanka. Blue bars show oil imports as a share of total imports. Oil price data are the simple average of Dubai, Brent, and West Texas Intermediate. Shaded areas indicate forecasts.
Click here to download data and charts.
vk.com/id446425943
118 C H AP T E R 2 . 5 |
G L O BAL EC O NO M I C P ROS P EC T S | J U NE 2 0 1 9 |
|
|
deficits are projected to diminish only gradually. Workers’ remittances are expected to help improve both growth performance and the current account balance next year, reflecting economic recovery in source countries (Figure 2.5.2.C). This, together with a broadly stable external environment and a reduction in macroeconomic imbalances, is expected to lead to an increase in growth to 4.0 percent beginning in FY2020/21.
In Bangladesh, annual growth is projected to average 7.3 percent over the forecast horizon. Activity will be underpinned by strong infrastructure spending and solid private investment with some easing of infrastructure constraints. Slowing activity in major trade partners’ economies (such as the Unites States and the Euro Area) will constrain the contribution of net exports to growth next fiscal year.
Economic activity in Sri Lanka is expected to accelerate to 3.5 percent in 2019 and to average 3.6 percent over the forecast horizon. This modest acceleration will be supported by a pickup in services sector activity and solid infrastructure investment.
Afghanistan’s growth is projected to accelerate over the forecast horizon, reaching 3.6 percent by 2021, on the assumption that political stability will be restored by presidential elections in July. The business environment, and thus economic activity, is expected to benefit from an easing of the domestic armed conflict.
In Nepal, growth of 6.1 percent a year is projected over the medium term. The services sector will be supported by tourism, and manufacturing will be bolstered by the opening of the country’s largest cement factory next year.
Bhutan’s growth is expected to remain solid at 5.4 percent in FY2019/20 (July 1 to June 30) and to continue at around this annual rate over the forecast horizon, supported particularly by tourism and retail trade. Economic growth in the Maldives is forecast at 5.7 percent in 2019, and is projected to moderate to 5.3 percent over the medium term as investment growth in the tourism sector converges to historical averages.
Risks
The main domestic risks to the outlook include a re-escalation of political turbulence amid elections in some countries (Afghanistan, Sri Lanka); fiscal slippages with expanding public spending; and a resurgence of non-bank financial sector funding issues.
Military skirmishes between major South Asian countries in mid-February remained contained, and economic repercussions were minor. However, a re-escalation of tensions between the two countries could increase uncertainty, depress confidence, and weigh on investment in the region (Figures 2.5.2.B and 2.5.2.C). In Sri Lanka, a rise in political uncertainty in the months leading up to presidential and parliamentary elections, which will take place in 2019 and 2020, respectively, could weigh on business confidence. In addition, recent security-related incidents could dampen investor sentiment and perceptions.
In India, the new GST (goods and services tax) regime is still in the process of being fully established, creating some uncertainty about projections of government revenues. Fiscal deficits continue to exceed official targets in some countries (India, Pakistan). Supply bottlenecks such as infrastructure gaps, and relatively weak business climates continue to depress domestic and foreign investment potential in the region (Grainger and Zhang 2017; Aritua et al. 2018). Setbacks in reforms to address these issues would likely weigh on activity.
Nonperforming assets remain high in South Asia (Figure 2.5.2.D). While recent measures helped the recognition of these assets in India, the frameworks could still be improved by accelerating the resolution process. Unless further steps are taken to enhance effectiveness of the resolution mechanisms, nonperforming assets could remain elevated and pose a risk to financial stability and credit growth, weighing on activity in the region.
External risks include weakening global growth and rising policy uncertainty. A sharper-than- expected deceleration in major economies or a new escalation of trade-related tensions among
vk.com/id446425943
G L O BAL EC O NO M I C P ROS P EC T S | J U NE 2 0 1 9 |
S O U T H AS I A |
119 |
|
|
|
major economies would likely result in adverse trade and financial market spillovers to the region. High external debt and low international reserves could limit the policy room to address external shocks in some countries (Pakistan, Sri Lanka).
Uncertainty about the Brexit process poses a risk to some South Asian economies which have preferential trade agreements or generalized system of preferences with the European Union and significant exports to United Kingdom (Bangladesh, India, Pakistan, Sri Lanka). A nodeal Brexit could have a significant impact on
exports of those countries to the UK in the absence of new trade agreements (Figure 2.5.2.E).
South Asia, as a net oil-importing region, is vulnerable to oil price spikes. A sudden increase in oil prices would tend to worsen current account balances and elevate inflation in the region (Figure 2.5.2.F). South Asia is also vulnerable to the effects of climate change, such as natural disasters, which tend both to increase inflation and weigh on activity through supply disruptions, especially in the agricultural sector.
TABLE 2.5.1 South Asia forecast summary
Percentage point differences
(Real GDP growth at market prices in percent, unless indicated otherwise) |
|
|
|
|
from January 2019 projections |
|||||
|
|
|
|
|
|
|
|
|||
|
|
|
|
|
|
|
|
|
|
|
|
2016 |
2017 |
2018e |
2019f |
2020f |
2021f |
|
2019f |
2020f |
2021f |
EMDE South Asia, GDP1, 2 |
8.1 |
6.7 |
7.0 |
6.9 |
7.0 |
7.1 |
|
-0.2 |
-0.1 |
0.0 |
(Average including countries with full national accounts and balance of payments data only)3 |
|
|
||||||||
EMDE South Asia, GDP3 |
8.2 |
6.7 |
7.1 |
6.9 |
7.0 |
7.1 |
|
-0.2 |
-0.1 |
0.0 |
GDP per capita (U.S. dollars) |
6.9 |
5.5 |
5.8 |
5.7 |
5.8 |
5.9 |
|
-0.2 |
-0.1 |
-0.1 |
PPP GDP |
7.6 |
6.2 |
7.6 |
6.9 |
7.0 |
7.1 |
|
-0.2 |
-0.1 |
0.0 |
Private consumption |
7.6 |
6.2 |
8.3 |
7.0 |
6.9 |
7.0 |
|
0.0 |
-0.1 |
0.0 |
Public consumption |
8.5 |
11.1 |
8.5 |
7.6 |
6.9 |
7.1 |
|
-1.5 |
-1.6 |
-1.4 |
Fixed investment |
9.3 |
7.5 |
8.4 |
7.6 |
7.8 |
7.8 |
|
-0.3 |
0.1 |
0.3 |
Exports, GNFS4 |
1.9 |
6.0 |
7.8 |
5.4 |
5.2 |
5.5 |
|
-0.2 |
-0.7 |
-0.5 |
Imports, GNFS4 |
2.7 |
13.0 |
14.0 |
6.2 |
5.8 |
6.1 |
|
-0.1 |
-0.9 |
-0.7 |
Net exports, contribution to growth |
-0.3 |
-2.0 |
-2.1 |
-0.6 |
-0.6 |
-0.6 |
|
0.0 |
0.0 |
0.0 |
|
|
|
|
|
|
|
|
|
|
|
Memo items: GDP2 |
16/17 |
17/18 |
18/19e |
19/20f |
20/21f |
21/22f |
|
19/20f |
20/21f |
21/22f |
South Asia excluding India |
5.8 |
6.0 |
5.4 |
4.8 |
5.0 |
5.3 |
|
-0.7 |
-0.6 |
-0.3 |
India |
8.2 |
7.2 |
7.2 |
7.5 |
7.5 |
7.5 |
|
0.0 |
0.0 |
0.0 |
Pakistan (factor cost) |
5.4 |
5.8 |
3.4 |
2.7 |
4.0 |
4.7 |
|
-1.5 |
-0.8 |
-0.1 |
Bangladesh |
7.3 |
7.9 |
7.3 |
7.4 |
7.3 |
7.3 |
|
0.6 |
0.5 |
0.5 |
|
|
|
|
|
|
|
|
|
|
|
Source: World Bank.
Note: e = estimate; f = forecast. EMDE = emerging market and developing economies. World Bank forecasts are frequently updated based on new information and changing (global) circumstances. Consequently, projections presented here may differ from those contained in other Bank documents, even if basic assessments of countries’ prospects do not differ at any given moment in time.
1.GDP at market prices and expenditure components are measured in constant 2010 U.S. dollars.
2.National income and product account data refer to fiscal years (FY) for the South Asian countries, while aggregates are presented in calendar year (CY) terms. The fiscal year runs from July 1 through June 30 in Bangladesh, Bhutan, and Pakistan, from July 16 through July 15 in Nepal, and April 1 through March 31 in India.
3.Sub-region aggregate excludes Afghanistan, Bhutan, and Maldives, for which data limitations prevent the forecasting of GDP components.
4.Exports and imports of goods and non-factor services (GNFS).
Click here to download data.
vk.com/id446425943
120 C H AP T E R 2 . 5 |
G L O BAL EC O NO M I C P ROS P EC T S | J U NE 2 0 1 9 |
|
|
TABLE 2.5.2 South Asia country forecasts
(Real GDP growth at market prices in percent, unless indicated otherwise) |
|
|
|
|||
|
|
|
|
|
|
|
|
2016 |
2017 |
2018e |
2019f |
2020f |
2021f |
Calendar year basis 1 |
|
|
|
|
|
|
Afghanistan |
2.3 |
2.7 |
1.0 |
2.4 |
3.2 |
3.6 |
Maldives |
7.3 |
6.9 |
7.9 |
5.7 |
5.2 |
5.3 |
Sri Lanka |
4.5 |
3.3 |
3.2 |
3.5 |
3.6 |
3.7 |
|
|
|
|
|
|
|
Fiscal year basis1 |
16/17 |
17/18 |
18/19e |
19/20f |
20/21f |
21/22f |
Bangladesh |
7.3 |
7.9 |
7.3 |
7.4 |
7.3 |
7.3 |
Bhutan |
6.3 |
5.8 |
5.4 |
5.4 |
5.2 |
5.2 |
India |
8.2 |
7.2 |
7.2 |
7.5 |
7.5 |
7.5 |
Nepal |
8.2 |
6.7 |
7.1 |
6.4 |
6.5 |
6.5 |
Pakistan (factor cost) |
5.4 |
5.8 |
3.4 |
2.7 |
4.0 |
4.7 |
|
|
|
|
|
|
|
Percentage point differences from January 2019 projections
2019 |
2020f |
2021f |
|
|
|
-0.3 |
0.0 |
0.4 |
-0.6 |
-0.4 |
-0.3 |
-0.5 |
-0.5 |
-0.4 |
|
|
|
19/20f |
20/21f |
21/22f |
0.6 |
0.5 |
0.5 |
-1.0 |
-1.2 |
-1.2 |
0.0 |
0.0 |
0.0 |
0.4 |
0.5 |
0.5 |
-1.5 |
-0.8 |
-0.1 |
|
|
|
Source: World Bank.
Note: e = estimate; f = forecast. World Bank forecasts are frequently updated based on new information and changing (global) circumstances. Consequently, projections presented here may differ from those contained in other Bank documents, even if basic assessments of countries’ prospects do not significantly differ at any given moment in time.
1. Historical data is reported on a market price basis. National income and product account data refer to fiscal years (FY) for the South Asian countries with the exception of Afghanistan, Maldives, and Sri Lanka, which report in calendar year. The fiscal year runs from July 1 through June 30 in Bangladesh, Bhutan, and Pakistan, from July 16 through July 15 in Nepal, and April 1 through March 31 in India.
Click here to download data.