

Global Economic Prospects -World Bank_watermark
.pdfvk.com/id446425943
G L O BAL EC O NO M I C P ROS P EC T S | J U NE 2 0 1 9 |
S P EC I AL F O CU S 1 . 2 |
71 |
|
|
|
indirect effects through wage formation and profit markups (Bacchetta and van Wincoop 2003; Burstein and Gopinath 2014; Ito and Sato 2008; McCarthy 2007). Distribution costs, firms’ internal pricing, and inventory management can also drive a wedge between producer and consumer prices and impact the size and speed of the exchange rate pass-through (Alessandria, Kaboski, and Midrigan 2010; Berger et al. 2012; Copeland and Kahn 2012).
The size and speed of the impact of exchange rate movements on domestic inflation depend on several factors. These include competition among importing and exporting firms (Amiti, Itskhoki, and Konings 2016), the frequency of price adjustments (Devereux and Yetman 2003; Corsetti, Dedola, and Leduc 2008; Gopinath and Itskhoki 2010), wage bargaining structures (Aron, Macdonald, and Muellbauer 2014), the composition of trade (Campa and Goldberg 2010), and the share of trade invoiced in foreign currencies (Casas et al. 2017; Gopinath 2015).
Credible monetary policy frameworks that support well-anchored inflation expectations have also been associated with less pass-through to consumer prices (Carrière-Swallow et al. 2016; Gagnon and Ihrig 2004; Reyes 2004; SchmidtHebbel and Tapia 2002; Taylor 2000). A recent strand of the literature has emphasized the importance of identifying the underlying cause of currency movements when assessing pass-through ratios (Comunale and Kunovac 2017; Forbes, Hjortsoe, and Nenova 2017, 2018; Shambaugh 2008).
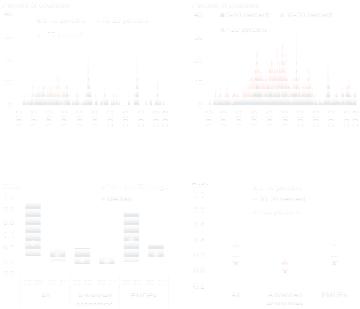
Correlation between exchange rate movements and inflation over time. Co-movement between exchange rate and consumer price developments has varied considerably over time. For advanced economies, the median correlation became positive during the late 1990s (+0.4 in 2000), during the mid-2000s (+0.2 in 2007), and again during the mid-2010s (+0.5 in 2014)—periods marked by unusually large monetary policy shocks or heightened uncertainty over policy actions (Figure SF1.2.2.A). In contrast, correlation rates were close to zero during the recovery in the early 2000s and 2017-18, and significantly negative during the global financial crisis (-0.5 in 2008-09)
FIGURE SF1.2.2 Correlation between inflation and effective exchange rate changes
Correlations between inflation and exchange rate movements vary considerably over time.
A. Advanced economies: Correlation |
B. EMDEs: Correlation |
|
|
|
|
Source: World Bank.
Note: EMDEs = emerging market and developing economies.
A.B. Correlation over a three-year rolling window between inflation and nominal effective exchange rate depreciations in the same quarter. The sample includes 51 economies. The median and interquartile range are for three-year window correlation during 1998-2018.
Click here to download data and charts.
—periods marked by shifts in domestic or global demand conditions.
Among EMDEs, the median correlation also moved close to zero during the economic recovery in the early 2000s and during the global financial crisis, but it became increasingly positive after 2010 amid deteriorating supply-side conditions in many countries, including commodity exporters facing the end of the commodity supercycle (Baffes et al. 2015; Figure SF1.2.2.B). Shifts in the correlation between exchange rate and consumer price movements is consistent with the notion that different shocks as well as country-specific characteristics can modify the response of inflation to currency movements.
Events of large exchange rate movements. The event study presented in this section explores episodes of large exchange rate fluctuations, defined as quarterly movements in (tradeweighted) nominal effective exchange rates in excess of 5 percent across 34 advanced economies and 138 EMDEs during 1970-2018. By focusing on large exchange rate swings, the study is more likely to be successful in detecting related changes in prices throughout the entire production chain and in identifying potential nonlinearities that would cause larger ERPTRs in the event of sudden marked depreciations. By allowing for both
vk.com/id446425943
72 |
S P EC I AL F O CU S 1 . 2 |
G L O BAL EC O NO M I C P ROS P EC T S | J U NE 2 0 1 9 |
|
|
|
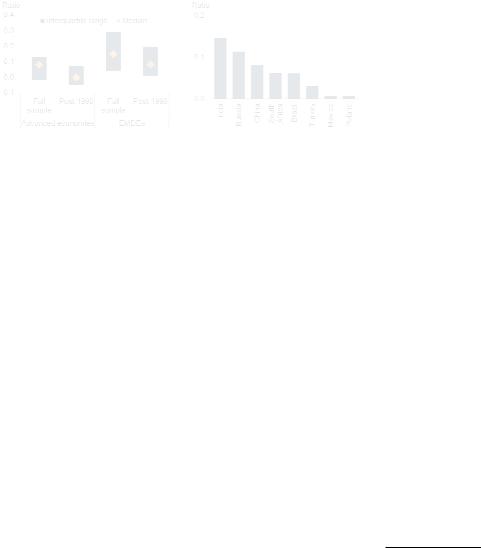
FIGURE SF1.2.3 Pass-through during significant currency depreciations
The frequency and severity of depreciation episodes have declined over recent decades. The median pass-through associated with large currency depreciations has dropped as well in EMDEs but remains higher than in advanced economies.
A. Frequency of significant exchange |
B. Frequency of significant exchange |
|
rate depreciations: Advanced |
rate depreciations: EMDEs |
|
economies |
|
|
|
|
|
C. Pass-through from depreciations of |
D. Pass-through from different |
5 to 10 percent |
depreciation episodes, 1998-2017 |
Source: World Bank.
Note: Depreciations are defined as negative quarterly changes in the nominal effective exchange rate. The sample comprises 34 advanced economies and 138 EMDEs. C.D. Pass-throughs are defined as the change in consumer prices after one quarter divided by the depreciation of the nominal effective exchange rate. The markers refer to the median pass-through.
C. The bars show the interquartile range of pass-throughs. Click here to download data and charts.
depreciations and appreciation events, passthroughs can be estimated conditional on the size and direction of the exchange rate movement.
This study identifies 2,323 depreciation events and 5,514 appreciation events in EMDEs and 242 depreciation events and 706 appreciation events in advanced economies (Figure SF1.2.3.A). The median depreciation across all events amounted to -10 percent in EMDEs and -8 percent for advanced economies, while the median appreciation amounted to 6 percent across the two groups.
The frequency and severity of large currency depreciations have declined over the past two
decades, particularly in EMDEs (Figure SF1.2.3.B). Prior to 1998, such episodes clustered around periods of broad-based U.S. dollar appreciation, often associated with a tightening of U.S. monetary policy. In some cases, these led to full-blown currency or debt crises, particularly in Latin America during the 1980s and the early to mid-1990s, and in Asia and Eastern Europe during the second half of the 1990s. The incidence of currency crises has diminished since the early 2000s, with depreciations in excess of 20 percent affecting less than 1 percent of EMDEs, on average.
ERPTRs during large depreciations. The event study suggests a broad-based decline in passthrough among EMDEs over the past two decades (Figure SF1.2.3.C). Median estimates of the samequarter pass-through of currency depreciations of 5-10 percent per quarter dropped from +0.4 in the period 1980-98 to around +0.1 since 1998 (meaning that a 10 percent depreciation in the median EMDE triggered a 1 percent increase in consumer prices in the same quarter). In advanced economies, the median pass-through for similar depreciations is close to zero for both periods. Depreciations of 10-20 percent in a given quarter continue to be accompanied by a larger pass-throughs, with median values of +0.1 for advanced economies and +0.2 for EMDEs since 1998 (Figure SF1.2.3.D). Depreciations in excess of 20 percent were associated with pass-throughs of around +0.4 in both groups of countries.
The reduced frequency of large depreciations and smaller pass-throughs over the past two decades may have common causes: enhanced monetary and fiscal policy frameworks, more flexible exchange rate regimes, accumulations of foreign exchange reserves, and better external debt management (Frankel, Parsley, and Wei 2005). Pass-throughs remained larger among EMDEs with less flexible exchange rate regimes (those devaluing from currency pegs or other forms of currency arrangements) and those without inflation-targeting central banks.
ERPTRs during large appreciations. Appreciation episodes were generally associated with positive, but smaller, pass-throughs compared to

vk.com/id446425943
G L O BAL EC O NO M I C P ROS P EC T S | J U NE 2 0 1 9 |
S P EC I AL F O CU S 1 . 2 |
73 |
|
|
|
depreciations of the same magnitude, with median values of +0.02 for advanced economies and EMDEs for appreciations of 5-10 percent, and only slightly larger for appreciations of 10-20 percent. These results may indicate that currency appreciations induce a weaker response from import and consumer prices than similarly sized depreciations (Brun Aguerre, Fuertes, and Greenwood Nimmo 2017). However, large currency appreciations are also rare events, making rigorous conclusions about such asymmetric effects difficult to establish in this context. Overall, the results appear to point to the presence of possible nonlinearities in the relationship between exchange rate movements and inflation, including in EMDEs (Caselli and Roitman 2016).
Pass-through to inflation and underlying shocks
The event study documents wide cross-country and time variation in the relationship between exchange rate movements and inflation. This section explores this variation further by estimating ERPTRs conditional on the underlying shocks as well as country-specific characteristics.
Empirical approach. Exchange rate pass-through ratios are estimated for 29 advanced economies and 26 EMDEs over the periods 1971Q1 to 1997Q4 and 1998Q1 to 2017Q4 in countryspecific Bayesian factor-augmented vector autoregression (FAVAR) models (see Annex 1 for details).1 The models include a global block (featuring global inflation, global output growth, and oil price changes) and a domestic block (featuring inflation, output growth, changes in nominal effective exchange rates, and monetary policy rates or equivalent short-term nominal interest rates). The identification strategy is based on the following sign and timing assumptions:
1 The model framework used here—a FAVAR with sign restrictions to identify structural shocks—accounts for the endogenous nature of exchange rate movements by identifying truly structural shocks that are, by construction, orthogonal to each other. This reduces potential estimation bias due to simultaneous interactions between variables.
•A positive monetary policy shock (corresponding to an unexpected tightening of monetary policy) initially increases the domestic interest rate and appreciates the domestic currency, while it decreases domestic output growth and inflation.
•A positive country-specific supply or demand shock increases country-specific output growth. A country-specific supply shock reduces domestic inflation, whereas a countryspecific demand shock increases it.
•A positive exchange rate shock (corresponding to an appreciation) only assumes a change in the exchange rate, while its impact on other domestic variables is left unrestricted.
•A positive global demand shock triggers a simultaneous increase in global output growth, global inflation, and oil prices.
•A positive global supply shock leads to higher global output growth and oil prices but lower global inflation.
•A positive oil price shock induces an increase in oil prices and global inflation but a drop in global output growth.
•Global shocks can have contemporaneous effects on domestic variables, but domestic shocks can only influence global variables with a lag.
A two-step procedure is applied to measure shockspecific exchange rate and inflation responses to these shocks, and are mapped separately from impulse response functions. Second, the passthrough is defined as the cumulative impulse response of consumer price inflation relative to the impulse response of the effective exchange rate over one year. A positive pass-through ratio indicates that a shock triggering a currency depreciation is followed by an increase in consumer prices, as is generally expected. A negative value means that a shock triggering a currency depreciation is followed by a decline in consumer prices.

vk.com/id446425943
74 |
S P EC I AL F O CU S 1 . 2 |
G L O BAL EC O NO M I C P ROS P EC T S | J U NE 2 0 1 9 |
|
|
|
FIGURE SF1.2.4 Variance decompositions of exchange rate movements, 1998-2017
Domestic shocks account for about two-thirds of the variation in exchange rates in the median advanced economy and more than half in the median EMDE after one year. Monetary policy shocks have contributed most to exchange rate variations.
A. Variance decomposition |
B. Variance decomposition: EMDEs |
Source: World Bank.
Note: Median share of country-specific exchange rate variance accounted for by global, domestic, and exchange rate shocks based on country-specific factor-augmented vector autoregression models estimated for 29 advanced economies and 26 EMDEs over 1998-2017. Bars show the interquartile range and markers represent the median across economies. EMDEs = emerging market and developing economies.
Click here to download data and charts.
Estimated exchange rate responses to shocks.
Empirical studies have shown that certain macroeconomic fundamentals have some, albeit limited, predictive power over exchange rate movements. These fundamentals include changes in relative business cycle positions, monetary policy stances, risk premiums, and terms of trade (Ca’Zorzi and Rubaszek 2018; Cheung et al. 2017). Periods of domestic output or investment contraction are often associated with currency depreciations (Cordella and Gupta 2015; Landon and Smith 2009; Campa and Goldberg 1999). Monetary policy easing tends to lead to currency depreciations, with a change in interest rate differentials unfavorable to the domestic currency putting downward pressure on its value (Chinn and Meredith 2005; Engel 2016). Rising risk premiums and heightened sovereign default risks tend to trigger depreciation pressures (Foroni, Ravazzolo, and Sadaba 2018). Finally, nominal exchange rates can respond to terms of trade shocks, particularly in commodity-exporting countries with flexible currency regimes (Aizenman, Edwards, Riera-Crichton 2012; Schmitt-Grohé and Uribe 2018).
Focusing on the period 1998-2017, the response of nominal effective exchange rates one year after different shocks are as follows:
•Domestic shocks. Monetary policy tightening is followed by currency appreciations in all advanced economies and, to an even greater extent, in EMDEs, particularly those with inflation-targeting central banks and some commodity exporters (Brazil, Colombia, and South Africa). Stronger domestic demand is accompanied by currency appreciations as well, but the impact is statistically insignificant after one year in most cases. Changes in domestic supply conditions have mixed effects, consistent with the literature on productivity shocks (Alfaro et al. 2018; Corsetti, Dedola, and Leduc 2008).
•Global shocks.2 In EMDEs, domestic currency appreciations are more likely in the wake of a positive global demand shock, possibly reflecting the U.S. dollar depreciation that typically accompanies global upturns and capital inflows to EMDEs, particularly those with current account deficits (Avdjiev et al. 2018). A positive global supply shock has mixed effects, with currency depreciations observed among some EMDEs that run current account surpluses (for example, China) and appreciations among some commodity exporters (for example, Brazil, Colombia, Malaysia, and South Africa). Rising oil prices also tend to be associated with currency appreciations in oil-exporting economies and with depreciations in some oil importers.
Relative contributions of global and domestic shocks to exchange rate movements. Domestic factors are the main drivers of exchange rate movements, accounting for about two-thirds of currency movements in advanced economies and more than one-half in EMDEs over the past two decades (Figure SF1.2.4.A). Changes in monetary policy play a particularly prominent role (Figure SF1.2.4.B). Although the direction and magnitude of the impact of global shocks vary substantially across countries, global shocks explain around 7 percent of the variance of currency movements in
2 Me median impact of global shocks on exchange rates is close to zero across countries, since one country’s currency depreciation is, by deNnition, another’s appreciation.

vk.com/id446425943
G L O BAL EC O NO M I C P ROS P EC T S | J U NE 2 0 1 9 |
S P EC I AL F O CU S 1 . 2 |
75 |
|
|
|
the median advanced economy and up to 16 percent in the median EMDE. About one-quarter of currency movements are accounted for by changes in other (unmeasured) factors, such as sovereign and private sector risk premiums. This is consistent with a significant impact of expectations about sovereign default risks on exchange rate dynamics (Alvarez, Atkeson, and Kehoe 2009; Foroni, Ravazzolo, and Sadaba 2018).
Estimated ERPTRs. Empirically, the following pattern of shock-specific one-year exchange rate pass-through ratios emerge:
•Domestic shocks. Domestic shocks account for over half the variance of inflation and exchange rates in most countries but are associated with different ERPTRs depending on their source. Monetary policy shocks are generally associated with large, positive ERPTRs that are statistically significant in nearly all advanced economies and EMDEs. This means that currency appreciations triggered by monetary policy tightening tend to be followed by significantly slower inflation after one year, as the dampening impact of declining import prices is compounded by the effect of decelerating demand and activity. Median values since 1998 are estimated to be +0.2 for advanced economies and +0.3 for EMDEs (Figure SF1.2.5.A). Domestic demand shocks are associated with small, negative ERPTRs that are statistically insignificant for most advanced economies and EMDEs (Figure SF1.2.5.B). In other words, the buildup of domestic inflationary pressures when domestic demand strengthens unexpectedly could more than offset the disinflationary impact of the accompanying currency appreciation. Median values of the ERPTRs are at around -0.07 for both advanced economies and EMDEs. Domestic supply shocks are associated with positive ERPTRs with lower median values than monetary policy shocks (less than +0.1 for advanced economies and EMDEs; Figure SF1.2.5.C). However, most of these estimates are insignificant, with wide variations across country groups, largely reflecting the
FIGURE SF1.2.5 Shock-specific pass-throughs, 19982017
The exchange rate pass-through is large and positive when currency movements result from monetary policy shocks. It is smaller when currency movements are associated with changes in domestic supply conditions and negative when they are associated with changes in domestic demand conditions. Exchange rate pass-throughs vary widely when driven by global shocks.
A. Monetary policy shocks |
B. Domestic demand shocks |
C. Domestic supply shocks
E. Oil price shocks
D. Global demand shocks
F. Global supply shocks
Source: World Bank.
Note: Pass-throughs are defined as the ratio of the one-year cumulative impulse response of consumer price inflation to the one-year cumulative impulse response of the exchange rate change estimated from factor-augmented vector autoregression models for 29 advanced economies and 26 EMDEs over 1998-2017. A positive pass-through means that a currency depreciation is associated with higher inflation. Bars show the interquartile range and markers represent the median across countries.
Click here to download data and charts.
heterogenous exchange rate response to these types of shocks.
•Global shocks. Global shocks account for a smaller proportion of the variance of exchange rate movements and are associated with significant variations in estimated ERPTRs,
vk.com/id446425943
76 |
S P EC I AL F O CU S 1 . 2 |
G L O BAL EC O NO M I C P ROS P EC T S | J U NE 2 0 1 9 |
|
|
|
FIGURE SF1.2.6 Average pass-through
Over the past two decades, the average pass-through dropped close to zero in advanced economies and somewhat below +0.1 in EMDEs, albeit with considerable differences across countries.
A. Average pass-through |
B. Average pass-through: EMDEs |
|
|
|
|
Source: World Bank.
Note: Pass-throughs are defined as the ratio of the one-year cumulative impulse response of consumer price inflation to the one-year cumulative impulse response of the exchange rate change estimated from factor-augmented vector autoregression models for 29 advanced economies and 26 EMDEs over 1998-2017. A positive pass-through means that a currency depreciation is associated with higher inflation. Bars show the interquartile range and markers represent the median across countries. Shock-specific pass-throughs are aggregated using shares of currency movements accounted for by each type of shock as weights. EMDEs = emerging market and developing economies.
A. Full sample estimations are over 1971 to 2017 but can vary at the country level depending on data availability.
Click here to download data and charts.
reflecting the fact that these shocks have, by definition, diverging effects on individual country exchange rates (i.e., one country’s currency depreciation is another’s appreciation). Estimated ERPTRs associated with global demand shocks are statistically insignificant in over one-fifth of advanced economies and one-third of EMDEs, but are mostly positive across both groups (Figure SF1.2.5.D). Oil price shocks tend to be associated with positive ERPTR for the median energy exporters and a negative one for the median advanced economy, though not for the United States (partly due to the negative correlation between the U.S. dollar and oil prices; Figure SF1.2.5.E). However, estimates are insignificant in over one-half of advanced economies and almost two-thirds of EMDEs. Global supply shocks tend to be associated with largely insignificant ERPTRs (for nearly three-quarters of advanced economies and about two-thirds of EMDEs; Figure SF1.2.5.F).
•Heterogenous consequences. Collectively, these results suggest that the estimated exchange rate pass-through is highly
heterogeneous across underlying shocks that trigger exchange rate fluctuations. This heterogeneity in part reflects the endogenous nature of exchange rates (Rincón-Castro and Rodríguez-Niño 2018). In general, nominal shocks (such as commodity price shocks) are more likely to change relative prices, whereas real shocks (such as supply shocks) are more likely to be associated with lower passthroughs but a higher impact on real exchange rates that facilitates expenditure switching.
Average ERPTRs. The average ERPTR has declined in both advanced economies and EMDEs since the late 1990s (Figure SF1.2.6.A). The average ERPTR is defined here as the weightedaverage of shock-specific pass-through ratios, where weights are the estimated shares of currency movements accounted for by each type of shock. The median estimate over the period 1998-2017 was close to zero for advanced economies and +0.08 in EMDEs, significantly down from the prior two decades, but with wide country variations (Figure SF1.2.6.B).3
Pass-through and country characteristics
The previous section illustrates the fact that ERPTRs can vary considerably depending on the nature of the shock driving exchange rate movements. However, country characteristics matter as well. In particular, previous empirical studies have emphasized that differences in monetary policy frameworks and in the degree of international integration can account for some of
3 Among larger EMDEs, the average ERPTR in China is estimated at +0.08 since 1998, somewhat below previously reported estimates (Jiang and Kim 2013; Shu and Su 2009; Wang and Li 2010). For India, the average ERPTR is estimated at +0.14, broadly in line with previous studies (Bhattacharya, Patnaik, and Shah 2008; Forbes, Hjortsoe, and Nenova 2017; Kapur and Behera 2012). For the Russian Federation, it is measured at +0.11, consistent with Nndings of the Central Bank of the Russia (2014). For Brazil, the average ERPTR is estimated at +0.06 since 1998, toward the lower end of other studies (Forbes, Hjortsoe, and Nenova 2017; Ghosh 2013; Nogueira and Leon-Ledesmab 2009). For South Africa, the ERPTR is estimated at +0.07, broadly in line with the evidence presented in Kabundi and Mbelu (2018). For Turkey, the average ERPTR is somewhat lower than found in earlier studies, partly reRecting the shorter sample focusing on a period marked by signiNcant de-dollarization and disinRation.
vk.com/id446425943
G L O BAL EC O NO M I C P ROS P EC T S | J U NE 2 0 1 9 |
S P EC I AL F O CU S 1 . 2 |
77 |
|
|
|
the heterogeneity in estimated ERPTRs (Campa and Goldberg 2010; Carrière-Swallow et al. 2016; Caselli and Roitman 2016; Coulibaly and Kempf 2010; Gagnon and Ihrig 2004; Mishkin and Schmidt-Hebbel 2007). These country characteristics are further investigated by comparing shockspecific ERPTRs for different subset of countries.
Global value chain integration. A priori, the impact of greater trade openness and international economic integration on estimated ERPTRs is difficult to ascertain. On the one hand, a larger share of imported products implies a potentially larger role for exchange rate movements in driving domestic inflation (Benigno and Faia 2016; Soto and Selaive 2003). On the other hand, increased foreign competition in domestic markets and greater integration in global value chains (GVCs) may reduce the ERPTR (Auer 2015; Berman, Martin, and Mayer 2012; Gust, Leduc, and Vigfusson 2010; Amiti, Itskhoki, and Konings 2016; de Soyres et al. 2018; Georgiadis, Gräb, and Khalil 2017; Figure SF1.2.7.A). Consistent with the literature, some economies in East Asia and the Pacific and in Eastern Europe and Central Asia are highly integrated into GVCs and also have low average pass-throughs (Chinn 2014). However, for other EMDEs, the association between GVC participation and ERPTRs is not as clear cut (Figure SF1.2.7.B).
Foreign currency invoicing. Having a large share of imports invoiced in a foreign currency could amplify the sensitivity of import and export prices to exchange rate movements (Devereux, Tomlin, and Dong 2015; Gopinath 2015). The ERPTR to import and export prices tend to be particularly elevated for countries with a high share of imports priced in U.S. dollars (Casas et al. 2017; Korhonen and Wachtel 2006). Domestic prices in highly dollarized economies also tend to react more to currency movements relative to other countries, since tradable and nontradable goods are priced in a foreign currency (Carranza, Galdon-Sanchez, and Gomez-Biscarri 2009; Reinhart, Rogoff, and Savastano 2014; Sadeghi et al. 2015). The selection of the pricing currency could itself depend on the exchange rate passthrough (Gopinath, Itskhoki, and Rigobon 2010). Among EMDEs, a higher share of imports
FIGURE SF1.2.7 Global economic integration and pass-through
Higher global value chain participation is associated with lower passthroughs in some EMDEs. A higher share of foreign-currency invoicing is associated with higher pass-throughs in some EMDEs, but does not seem to account for cross-country variations in EMDEs.
A. Global value chain participation |
B. Global value chain participation |
|
|
|
and pass-through from monetary |
|
|
policy shocks |
|
|
|
C. Share of imports invoiced in |
D. Share of foreign-currency invoicing |
foreign currency |
and pass-through from monetary |
|
policy shocks |
Source: Organisation for Economic Co-operation and Development, World Bank, World Trade Organization.
Note: Global value chain data are from the OECD-WTO TiVA (Trade in Value Added) database. The selected indicator is foreign value added as a percent of gross exports. Pass-throughs are defined as the ratio between the one-year cumulative impulse response of consumer price inflation and the oneyear cumulative impulse response of the exchange rate change estimated from factor-augmented vector autoregression models for 29 advanced economies and 26 EMDEs over 1998-2017. A positive pass-through means that a currency depreciation is associated with higher inflation. Bars show the interquartile range and markers represent the median across countries.
B.Low and high value chain participation are defined as below or above the sample average.
C.Share of imports invoiced in foreign currency based on data for 50 countries calculated by Gopinath (2015).
D.Low and high share of foreign-currency invoicing are defined as below or above the sample average.
Click here to download data and charts.
invoiced in foreign currencies tends to be associated with higher pass-through ratios, but with significant heterogeneity across countries (Figures SF1.2.7.C and SF1.2.7.D).
Monetary policy framework and credibility. The increased adoption of credible monetary policy frameworks that support well-anchored inflation expectations has helped reduce the exchange rate pass-through to consumer prices in EMDEs by
vk.com/id446425943
78 |
S P EC I AL F O CU S 1 . 2 |
G L O BAL EC O NO M I C P ROS P EC T S | J U NE 2 0 1 9 |
|
|
|
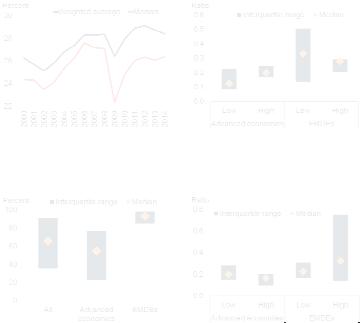
FIGURE SF1.2.8 Monetary policy frameworks and pass-through
A growing number of countries have adopted explicit inflation targets, and central bank independence has increased since 2000. Greater central bank independence has tended to dampen the pass-through to inflation of exchange rate movements stemming from monetary policy shocks and is also associated with lower average ERPTRs. Among EMDEs, the passthrough is generally lower among countries with more flexible exchange rate regimes and inflation-targeting central banks.
A. Central bank independence and |
B. Central bank independence and |
|
inflation-targeting frameworks |
ERPTRs from monetary policy shocks |
|
|
|
|
C. ERPTRs associated with monetary |
D. ERPTRs associated with global |
|
policy shocks in EMDEs |
demand shocks in EMDEs |
|
|
|
|
in EMDEs that do not have inflation-targeting central banks and have less flexible exchange rate regimes (for example, Azerbaijan, Botswana, Jordan, and North Macedonia; Figures SF1.2.8.B and SF1.2.8.C).4 The growing number of EMDEs adopting explicit inflation targets and reinforcing central bank transparency and independence has helped to dampen estimated ERPTRs over the last two decades. Thus an improvement of the central bank independence index from one standard deviation below the sample mean to one standard deviation above it is estimated to reduce the passthrough ratio associated with monetary policy shocks by half.
In countries with more independent central banks, inflation targets, and more flexible exchange rate regimes, inflation also responds less to exchange rate movements triggered by global demand and oil price shocks (Figure SF1.2.8.D). This implies that countries with such characteristics can better absorb external shocks through currency adjustments without threatening price stability. In countries with less flexible or pegged exchange rate regimes, global shocks could generate higher passthrough, making adjustments to devaluations more disruptive.
Source: World Bank.
Note: The central bank independence index is computed by Dincer and Eichengreen (2014). An increase in the index means greater central bank independence. Pass-throughs are defined as the ratio between the one-year cumulative impulse response of consumer price inflation and the one-year cumulative impulse response of the exchange rate change estimated from factor-augmented vector autoregression models for 29 advanced economies and 26 EMDEs over 1998-2017. A positive pass-through means that a currency depreciation is associated with higher inflation. Bars show the interquartile range and markers represent the median across countries. ERPTR = exchange rate pass -through ratio; IT = inflation-targeting.
B. Low and high central bank independence are defined as below or above the sample average. C.D. Exchange rate and IT regimes are based on IMF classifications.
Click here to download data and charts.
minimizing domestic wage and mark-up adjustments (Figure SF1.2.8.A). In fact, ERPTRs associated with domestic monetary policy shocks are estimated to be significantly smaller in EMDEs with more independent central banks and higher
4 This is in line with the empirical literature that has generally found ERPTRs to be smaller among advanced economies and in EMDEs with inflation targeting or more credible central banks (Carrière-Swallow et al. 2016; Gagnon and Ihrig 2004; Reyes 2004; Schmidt-Hebbel and Tapia 2002). Over the past two decades, an increasing number of central banks have adopted inflation targets and enhanced their credibility, which has helped reduce ERPTRs (Mishkin and Schmidt-Hebbel 2007; Coulibaly and Kempf 2010).
Conclusion
As recent financial market turbulences illustrate, large depreciations remain a threat to both price and financial stability in more vulnerable EMDEs. To formulate the appropriate monetary policy response to exchange rate pressures, central banks need to be able to anticipate the direction and magnitude of their impact on domestic inflation. But pass-through ratios—the percentage increase in consumer prices associated with a 1-percent depreciation of the nominal effective exchange rate—vary considerably across countries and over time, making inference from average values unreliable and potentially misleading for policy evaluation and forecasting purposes. Two fundamental factors help to account for the wide range of pass-through estimates: the nature of the shock triggering the currency movement and country characteristics.
An event study of past depreciation episodes suggests that the pass-through can more than

vk.com/id446425943
|
L |
|
B0Yt |
= α + Σ BjYt - j + |
t |
|
j=1 |
|
t |
|
|
Yt |
|
|
t |
t |
|
t |
|
t |
Yt
t
 t
t t
t
 t
t
t  t
t
utY ,global
utOP
ut ,globalutY ,domestic
ut ,domestic
utI ,domestic
utER
|
+ |
− |
+ |
0 |
0 |
||
|
|||||||
+ |
|
|
|
|
|||
|
+ |
+ |
0 |
0 |
|||
|
|
|
|
|
|
|
|
+ |
+ |
− |
0 |
0 |
|||
|
|||||||
|
|
|
|
|
|
||
= |
* |
* |
* |
+ |
+ |
||
|
|
|
|
|
|
|
|
|
* |
* |
* |
+ |
− |
||
|
|||||||
|
|
|
|
|
|
||
|
* |
* |
* |
* |
* |
||
|
|||||||
|
|||||||
|
* |
* |
* |
* |
* |
||
|
|||||||
|
|||||||
|
|
|
|
|
|
|
|
0 |
0 |
|
GlobalDemand |
|
||
|
|
|
t |
|
||
0 |
0 |
|
tOilPrice |
|
||
0 |
0 |
|
t |
|
||
|
|
|
|
GlobalSupply |
||
− |
* |
|
|
|
|
|
DomesticDemand |
||||||
|
|
|
|
|
t |
|
− |
* |
tDomesticSupply |
|
|||
+ |
|
|
|
|
|
|
* |
|
MonetaryPolicy |
||||
+ |
|
|
|
|
t |
|
|
t |
|
||||
+ |
|
ExchangeRate |
|
|||

vk.com/id446425943
80 |
S P EC I AL F O CU S 1 . 2 |
G L O BAL EC O NO M I C P ROS P EC T S | J U NE 2 0 1 9 |
|
|
|
ANNEX FIGURE SF1.2.1.1 Robustness of pass-through estimates: Oneversus two-quarter sign restrictions
A. Monetary policy shocks |
B. Global demand shocks |
C. Domestic demand shocks |
D. Global supply shocks |
E. Domestic supply shocks |
F. Oil price shocks |
|
|
Source: World Bank.
Note: Pass-throughs are defined as the ratio of the one-year cumulative impulse response of consumer price inflation to the one-year cumulative impulse response of the exchange rate change to shocks from country-specific factor-augmented vector autoregression models estimated for 51 economies (29 advanced economies and 22 EMDEs) over 1998-2017. A positive pass-through means that a currency depreciation is associated with higher inflation. Bars show the interquartile range and markers represent the median across countries. In the alternative specification, sign restrictions are applied to the current quarter and next quarter.
Click here to download data and charts.
where * stands for an unrestricted initial response. Although country-specific shocks do not affect global variables in the first four quarters, global shocks can affect country-specific variables (without any sign or zero restrictions).
The identification strategy is based on the following assumptions, combining sign and shortterm restrictions as shown above:
•A positive global demand shock triggers a simultaneous increase in global output growth, global inflation, and oil prices.1 A positive global supply shock leads to higher global output growth and oil prices but lower global inflation. A positive oil price shock induces an increase in oil prices and global inflation but a drop in global output growth. Finally, global shocks can have contemporaneous effects on domestic variables, but domestic shocks can only influence global variables with a lag.
•A positive country-specific supply or demand shock increases country-specific output growth. However, a country-specific supply shock reduces domestic inflation, whereas a country-specific demand shock increases it. A positive interest rate shock (corresponding to a contractionary monetary policy) initially increases the domestic interest rate and results in an appreciation of the domestic currency, while it decreases domestic output growth and inflation. Finally, a positive exchange rate shock (corresponding to an appreciation of the domestic currency) only assumes an increase in the exchange rate, while its impact on other domestic variables is left unrestricted. All country-specific shocks are assumed to affect country-specific variables on impact through the corresponding sign restrictions, although the robustness checks also consider such restrictions lasting for an alternative number of periods (Annex Figure SF1.2.1.1). An alternative specification assumes that positive domestic demand shocks lead to a contemporaneous increase in domestic interest rates (Annex Figure SF1.2.1.2).
The structural FAVAR model framework has several advantages over the reduced-form approach in estimating the exchange rate pass-through (Rincón-Castro and Rodríguez-Niño 2018, Forbes, Hjortsoe, and Nenova 2017, Shambaugh
1 Global shocks are derived from a separate tri-dimensional vector autoregression model that incorporates global output growth, global inRation, and oil price changes, following the approach of Charnavoki and Dolado (2014) and Uhlig (2005).