

Global Economic Prospects -World Bank_watermark
.pdfvk.com/id446425943
G L O BAL EC O NO M I C P ROS P EC T S | J U NE 2 0 1 9 |
S P EC I AL F O CU S 1 . 2 |
81 |
|
|
|
2008). First, it seeks to account for the endogenous nature of exchange rate movements, whereas reduced-form models assume that exchange rates are exogenously determined. In practice, exchange rates are often a function of macroeconomic fundamentals and thus the passthrough will depend on the type of shock the economy is facing. Second, the FAVAR model allows for the estimation of exchange rate passthroughs are conditional on a variety of global and domestic shocks in a unified framework. Finally, the identification using sign and zero restrictions employed in this Special Focus seeks to identify truly structural shocks, orthogonal to each other, and reduce potential estimation bias due to simultaneous interactions between the variables.
The system is estimated on a country-by-country basis using quarterly data with two lags, as in Charnavoki and Dolado (2014). The Bayesian estimation used searches for 1,000 successful draws of at least 2,000 iterations with 1,000 burnins. The results shown in this Special Focus are based on the median of these 1,000 successful draws and 68 percent confidence sets at the country level, although alternative presentation methodologies (for example, the median target, as in Fry and Pagan 2011) are considered as a robustness check. In the Bayesian estimation, Minnesota priors proposed by Litterman (1986) are used; since the Minnesota prior assumes that the variance-covariance matrix of residuals is known, we use the entire variance-covariance matrix of the vector autoregression estimated by ordinary least squares. For the actual estimation, the identification strategy through the algorithm introduced by Arias, Rubio-Ramirez, and Waggoner (2014) is used, where the standard Cholesky decomposition is employed together with an additional orthogonalization step that is necessary to produce a posterior draw from the correct distribution for structural vector autoregression coefficients.
The results for the role of global and domestic shocks in domestic inflation are presented as median point estimates across countries. Interquartile ranges indicate the range from the 25th to the 75th quartile of country-specific estimates (for example, Forbes, Hjortsoe, and Nenova 2017).
ANNEX FIGURE SF1.2.1.2 Robustness of pass-through estimates: Additional sign restriction to identify domestic demand shocks
A. Monetary policy shocks |
B. Global demand shocks |
C. Domestic demand shocks |
D. Global supply shocks |
E. Demand supply shocks |
F. Oil price shocks |
|
|
Source: World Bank.
Note: Pass-throughs are defined as the ratio of the one-year cumulative impulse response of consumer price inflation to the one-year cumulative impulse response of the exchange rate change to shocks from country-specific factor-augmented vector autoregression models estimated for 51 economies (29 advanced economies and 22 EMDEs) over 1998-2017. A positive pass-through means that a currency depreciation is associated with higher inflation. Bars show the interquartile range and markers represent the median across countries. In the alternative specification, an additional sign restriction was imposed, assuming that a positive domestic demand shock leads
to a contemporaneous increase in domestic interest rates. Click here to download data and charts.
Exchange rate pass-through definition
Following Shambaugh (2008) and Forbes, Hjortsoe, and Nenova (2017), for each country, the exchange rate pass-through ratio (ERPTR) is defined as the ratio of the response of countryspecific inflation to the response of the nominal exchange rate changes following a given shock. Since the exchange rate is defined such that an increase denotes appreciation, the sign of the ratio

vk.com/id446425943
•
•
•
•
•
|
Y |
|
= |
|
f |
|
|
+ e |
|
|
|
i |
|
Y ,i |
|
|
Y ,global |
Y ,i |
|
|
t |
|
global |
|
t |
|
t |
||
|
|
i |
= |
,i |
f |
|
,global |
+ e |
,i |
|
|
t |
|
global |
|
t |
|
t |
|
• |
t |
|
t |
|
|
|
|
|
|
|
|
|
|
|
|
|
|
||
|
|
|
|
|
|
|
t |
|
|
|
t |
|
t |
|
|
|
|
|
|
|
t |
|
|
Y |
|
|
|
|
|
• |
|
|
t |
|
|
t |
|
|
|
|
|
|
|
|
|
|
|
|
|
t

vk.com/id446425943
G L O BAL EC O NO M I C P ROS P EC T S | J U NE 2 0 1 9 S P EC I AL F O CU S 1 . 2 83
TABLE SF1.2.1 Countries and sample periods
Country |
Sample period |
Country |
Sample period |
|
|
|
|
Australia |
1970:2 - 2017:4 |
India |
1993:3 - 2017:4 |
|
|
|
|
Austria |
1990:1 - 2017:4 |
Israel |
1985:3 - 2017:4 |
Azerbaijan |
2005:3 - 2017:4 |
Italy |
1979:2 - 2017:4 |
|
|
|
|
Belgium |
1970:2 - 2017:4 |
Jordan |
1999:3 - 2017:4 |
Bulgaria |
1994:4 - 2017:4 |
Japan |
1989:3 - 2017:4 |
|
|
|
|
Brazil |
1998:3 - 2017:4 |
Korea, Republic of |
1991:3 - 2017:4 |
Botswana |
1994:4 - 2017:4 |
Luxembourg |
1999:3 - 2017:4 |
|
|
|
|
Canada |
1970:2 - 2017:4 |
Mexico |
1989:1 - 2017:4 |
Switzerland |
1970:3 - 2017:4 |
Malta |
1999:3 - 2017:4 |
|
|
|
|
Chile |
1986:3 - 2017:4 |
Malaysia |
2004:4 - 2017:4 |
China |
1984:4 - 2017:4 |
Morocco |
1995:4 - 2017:4 |
|
|
|
|
Colombia |
1994:4 - 2017:4 |
Netherlands |
1982:3 - 2017:4 |
Costa Rica |
1997:3 - 2017:4 |
North Macedonia |
2008:1 - 2017:4 |
|
|
|
|
Czech Republic |
1992:4 - 2017:4 |
Norway |
1979:2 - 2017:4 |
Germany |
1970:2 - 2017:4 |
New Zealand |
1974:3 - 2017:4 |
|
|
|
|
Denmark |
1970:2 - 2017:4 |
Philippines |
1987:3 - 2017:3 |
Dominican Republic |
2004:3 - 2017:3 |
Poland |
1992:1 - 2017:4 |
|
|
|
|
Egypt |
2002:4 - 2017:2 |
Portugal |
1986:2 - 2017:4 |
Spain |
1977:3 - 2017:4 |
Russia |
2000:1 - 2017:4 |
|
|
|
|
Finland |
1987:3 - 2017:4 |
Slovak Republic |
1996:1 - 2017:4 |
France |
1970:2 - 2017:4 |
Slovenia |
2002:3 - 2017:4 |
|
|
|
|
United Kingdom |
1970:2 - 2017:4 |
South Africa |
1981:3 - 2017:4 |
Greece |
1994:4 - 2017:4 |
Sweden |
1983:3 - 2017:4 |
|
|
|
|
Honduras |
2005:4 - 2017:4 |
Thailand |
2000:4 - 2017:4 |
Hungary |
1995:4 - 2017:4 |
Tunisia |
2000:4 - 2017:4 |
|
|
|
|
Indonesia |
1990:3 - 2017:4 |
Turkey |
2007:1 - 2017:4 |
Ireland |
1984:3 - 2017:4 |
United States |
1970:2 - 2017:4 |
|
|
|
|
Iceland |
1988:3 - 2017:4 |
|
|
|
|
|
|
References
Aizenman, J., S. Edwards, and D. Riera-Crichton. 2012. “Adjustment Patterns to Commodity Terms of Trade Shocks: The Role of Exchange Rate and International Reserves Policies.” Journal of International Money and Finance 31 (8): 1990-2016.
Alessandria, G., J. Kaboski, and V. Midrigan. 2010. “Inventories, Lumpy Trade, and Large Devaluations.”
American Economic Review 100 (5): 2304-39.
Alfaro, L., A. Cuñat, H. Fadinger, and L. Yanping. 2018. “The Real Exchange Rate, Innovation and Productivity: Regional Heterogeneity, Asymmetries and Hysteresis.” NBER Working Paper 24633, National Bureau of Economic Research, Cambridge, MA.
Alvarez, F., A. Atkeson, and P. Kehoe. 2009. “TimeVarying Risk, Interest Rates, and Exchange Rates in
General Equilibrium.” Review of Economic Studies 76 (3): 851-78.
Amiti, M., O. Itskhoki, and J. Konings. 2016. “International Shocks and Domestic Prices: How Large Are Strategic Complementarities?” NBER Working Paper 22119, National Bureau of Economic Research, Cambridge, MA.
Arias, J., J. Rubio-Ramirez, and D. Waggoner. 2014. “Inference Based on SVARs Identified with Sign and Zero Restrictions: Theory and Applications.” Dynare Working Paper 30, Centre pour la recherche économique et ses applications, Paris.
Aron, J., R. Macdonald, and J. Muellbauer. 2014. “Exchange Rate Pass-Through in Developing and Emerging Markets: A Survey of Conceptual, Methodological and Policy Issues, and Selected Empirical Findings.” The Journal of Development Studies 50 (1): 101-143.
vk.com/id446425943
84 |
S P EC I AL F O CU S 1 . 2 |
G L O BAL EC O NO M I C P ROS P EC T S | J U NE 2 0 1 9 |
|
|
|
Auer, R. 2015. “Exchange Rate Pass-Through, Domestic Competition, and Inflation: Evidence from the 2005-08 Revaluation of the Renminbi.” Journal of Money, Credit and Banking 47 (8): 1617-50.
Bacchetta, P., and E. van Wincoop. 2003. “Why Do Consumer Prices React Less Than Import Prices to Exchange Rates?” Journal of the European Economic Association 1 (2-3): 662-70.
Baffes, J., M. A. Kose, F. L. Ohnsorge, and M. Stocker. 2015. “The Great Plunge in Oil Prices: Causes, Consequences, and Policy Responses.” Policy Research Note 1, World Bank, Washington, DC.
Ball, C. P., and J. Reyes. 2008. “Inflation Targeting or Fear of Floating in Disguise? A Broader Perspective.”
Journal of Macroeconomics 30 (1): 308-26.
Benigno, P., and E. Faia. 2016. “Globalization, PassThrough, and Inflation Dynamics.” International Journal of Central Banking 12 (4): 263-306.
Berger, D., J. Faust, J. Rogers, and K. Steverson. 2012. “Border Prices and Retail Prices.” Journal of International Economics 88 (1): 62-73.
Berman, N., P. Martin, and T. Mayer. 2012. “How Do Different Exporters React to Exchange Rate Changes?”
Quarterly Journal of Economics 127 (1): 437-92.
Bhattacharya, R., I. Patnaik, and A. Shah. 2008. “Exchange Rate Pass-Through in India.” National Institute of Public Finance and Policy, New Delhi, India.
Brun-Aguerre, R., A. Fuertes, and M. Greenwood Nimmo. 2017. “Heads I Win; Tails You Lose: Asymmetry in Exchange Rate Pass-Through into Import Prices.” Journal of the Royal Statistical Society
180 (2): 587-612.
Burstein, A., and G. Gopinath. 2014. “International Prices and Exchange Rates.” In Handbook of International Economics, edited by G. Gopinath, E. Helpman, and K. Rogoff, 391-451. Amsterdam: Elsevier.
Calvo, G., and C. Reinhart. 2002. “Fear of Floating.”
Quarterly Journal of Economics 107 (2): 379-408.
Campa, J., and L. Goldberg. 1999. “Investment, PassThrough, and Exchange Rates: A Cross-Country Comparison.” International Economic Review 40 (2): 287-331.
———. 2010. “The Sensitivity of the CPI to Exchange Rates: Distribution Margins, Imported
Inputs, and Trade Exposure.” Review of Economics and Statistics 92 (2): 392-407.
Carranza, L., J. Galdon-Sanchez, and J. GomezBiscarri. 2009. “Exchange Rate and Inflation Dynamics in Dollarized Economies.” Journal of Development Economics 89 (1): 98-108.
Carrière-Swallow, Y., G. Bertrand, E. Magud, and F.
Valencia. 2016. “Monetary Policy Credibility and
Exchange Rate Pass-Through.” IMF Working Paper
16/240, International Monetary Fund, Washington,
DC.
Casas, C., F. Diez, G. Gopinath, and P. O. Gourinchas. 2017. “Dominant Currency Paradigm.” NBER Working Paper 22943, National Bureau of Economic Research, Cambridge, MA.
Caselli, F., and A. Roitman. 2016. “Non-Linear Exchange Rate Pass-Through in Emerging Markets.” IMF Working Paper 16/1, International Monetary Fund, Washington, DC.
Ca’Zorzi, M., and M. Rubaszek. 2018. “Exchange Rate Forecasting on a Napkin.” ECB Working Paper Series 2151, European Central Bank, Frankfurt am Main.
Central Bank of the Russian Federation. 2014. “Monetary Policy Report 3-2014.” Central Bank of the Russian Federation, Moscow, Russia.
Charnavoki, V., and J. Dolado. 2014. “The Effects of Global Shocks on Small Commodity-Exporting Economies: Lessons from Canada.” American Economic Journal: Macroeconomics 6 (2): 207-37.
Cheung, Y., M. Chinn, A. Garcia Pascual, and Y. Zhang. 2017. “Exchange Rate Prediction Redux: New Models, New Data, New Currencies.” NBER Working Paper 23267, National Bureau of Economic Research, Cambridge, MA.
Chinn, M. 2014. “Global Supply Chains and Macroeconomic Relationships in Asia.” In Asia and Global Production Networks: Implications for Trade, Incomes and Economic Vulnerabilities, edited by B. Ferrarini and D. Hummels. Cheltenham, U.K.: Asian Development Bank and Edward Elgar Publishing.
Chinn, M., and G. Meredith. 2005. “Testing Uncovered Interest Parity at Short and Long Horizons during the Post-Bretton Woods Era.” NBER Working Paper 11077, National Bureau of Economic Research, Cambridge, MA.
Comunale, M., and D. Kunovac. 2017. “Exchange Rate Pass-Through in the Euro Area.” ECB Working Paper
vk.com/id446425943
G L O BAL EC O NO M I C P ROS P EC T S | J U NE 2 0 1 9 |
S P EC I AL F O CU S 1 . 2 |
85 |
|
|
|
Series 2003, European Central Bank, Frankfurt am Main.
Copeland, A. and J. Kahn. 2012. “Exchange Rate PassThrough, Markups, and Inventories.” Staff Reports 584, Federal Reserve Bank of New York, New York.
Cordella, T., and P. Gupta. 2015. “What Makes a Currency Procyclical? An Empirical Investigation.”
Journal of International Money and Finance 55 (July): 240-59.
Corsetti, G., and L. Dedola. 2005. “A Macroeconomic Model of International Price Discrimination.” Journal of International Economics 67 (1): 129-55.
Corsetti, G., L. Dedola, and S. Leduc. 2008. “High Exchange-Rate Volatility and Low Pass-Through.”
Journal of Monetary Economics 55 (6): 1113-28.
Coulibaly, D., and H. Kempf. 2010. “Does Inflation Targeting Decrease Exchange Rate Pass-Through in Emerging Countries?” Working Paper 303, Banque de France, Paris.
de Soyres, F., E. Frohm, V. Gunnella, and E. Pavlova. 2018. “Bought, Sold and Bought Again.” Policy Research Working Paper 8535, World Bank, Washington, DC.
Devereux, M. B., B. Tomlin, and W. Dong. 2015. “Exchange Rate Pass-Through, Currency of Invoicing and Market Share.” NBER Working Paper 21413, National Bureau of Economic Research, Cambridge, MA.
Devereux, M. B., and J. Yetman. 2003. “Price Setting and Exchange Rate Pass-Through: Theory and Evidence.” In Price Adjustment and Monetary Policy: Proceedings of a Conference Held by the Bank of Canada. November 2003, 347-71. Ottawa: Bank of Canada.
Dincer, N. N., and B. Eichengreen. 2014. “Central Bank Transparency and Independence: Updates and New Measures.” International Journal of Central Banking 10 (1): 189-253.
Engel, C. 2016. “Exchange Rates, Interest Rates, and the Risk Premium.” American Economic Review 106 (2): 436-74.
Forbes, K., I. Hjortsoe, and T. Nenova. 2017. “Shocks versus Structure: Explaining Differences in Exchange Rate Pass-Through across Countries and Time.” External Monetary Policy Committee Unit Discussion Paper 50, Bank of England, London.
———. 2018. “The Shocks Matter: Improving Our Estimates of Exchange Rate Pass-Through.” Journal of International Economics 114 (September): 255-75.
Foroni, C., F. Ravazzolo, and B. Sadaba. 2018. “Assessing the Predictive Ability of Sovereign Default Risk on Exchange Rate Returns.” Journal of International Money and Finance 81 (March): 242-64.
Frankel, J. A., D. C. Parsley, and S.-J. Wei. 2005. “Slow Pass-Through around the World: A New Import for Developing Countries.” NBER Working Paper 11199, National Bureau of Economic Research, Cambridge, MA.
Fry, R., and A. Pagan. 2011. “Sign Restrictions in Structural Vector Autoregressions: A Critical Review.”
Journal of Economic Literature 49 (4): 938-60.
Gagnon, J. E., and J. Ihrig. 2004. “Monetary Policy and Exchange Rate Pass-Through.” International Journal of Finance and Economics 9 (4): 315-38.
Georgiadis, G., J. Gräb, and M. Khalil. 2017. “Global
Value Chain Participation and Exchange Rate Pass-
Through.” Unpublished, European Central Bank,
Frankfurt.
Ghosh, A. 2013. “Exchange Rate Pass-Through, Macro Fundamentals and Regime Choice in Latin America.”
Journal of Macroeconomics 35 (March): 163-71.
Gopinath, G. 2015. “The International Price System.” NBER Working Paper 21646, National Bureau of Economic Research, Cambridge, MA.
Gopinath, G., and O. Itskhoki. 2010. “Frequency of Price Adjustment and Pass-Through.” Quarterly Journal of Economics 125 (2): 675-727.
Gopinath, G., O. Itskhoki, and R. Rigobon. 2010. “Currency Choice and Exchange Rate Pass-Through.”
American Economic Review 100 (1): 304-36.
Gust, C., S. Leduc, and R. Vigfusson. 2010. “Trade Integration, Competition, and the Decline in Exchange Rate Pass-Through.” Journal of Monetary Economics 57 (3): 309-324.
Ha, J., M. Stocker, and H. Yilmazkuday. 2019. “Inflation and Exchange Rate Pass-Through.” Policy Research Working Paper 8780, World Bank, Washington, DC.
Hellerstein, R. 2008. “Who Bears the Cost of a Change in the Exchange Rate?” Journal of International Economics 76 (1): 14-32.
vk.com/id446425943
86 |
S P EC I AL F O CU S 1 . 2 |
G L O BAL EC O NO M I C P ROS P EC T S | J U NE 2 0 1 9 |
|
|
|
Ito, T., and K. Sato. 2008. “Exchange Rate Changes and Inflation in Post-crisis Asian Economies: Vector Autoregression Analysis of the Exchange Rate PassThrough.” Journal of Money, Credit and Banking 40 (7): 1407-38.
Jiang, J., and D. Kim. 2013. “Exchange Rate PassThrough to Inflation in China.” Economic Modelling 33 (July): 900-12.
Kabundi, A., and A. Mbelu. 2018. “Has the Exchange Rate Pass-Through Changed in South Africa?” South African Journal of Economics 86 (3): 339-60.
Kapur, M., and H. Behera. 2012. “Monetary Transmission Mechanism in India: A Quarterly Model.” Working Paper, September, Reserve Bank of India, Mumbai.
Korhonen, I., and P. Wachtel. 2006. “A Note on Exchange Rate Pass-Through in CIS Countries.” BOFIT Discussion Paper 2, Institute for Economies in Transition, Bank of Finland, Helsinki.
Kose, A., H. Matsuoka, U., Panizza, D. Vorisek, and D. Lauren. 2019. “Inflation Expectations: Review and Evidence.” Policy Research Working Paper 8785, World Bank, Washington, DC.
Landon, S., and C. Smith. 2009. “Investment and the Exchange Rate: Short Run and Long Run Aggregate and Sector-Level Estimates.” Journal of International Money and Finance 28 (5): 813-35.
Litterman, R. B. 1986. “Forecasting with Bayesian Vector Autoregressions: Five Years of Experience.”
Journal of Business and Economic Statistics 4 (1): 25-38.
McCarthy, J. 2007. “Pass-Through of Exchange Rates and Import Prices to Domestic Inflation in Some Industrialized Economies.” Eastern Economic Journal 33 (4): 511-37.
Mishkin, F., and K. Schmidt-Hebbel. 2007. “Does Inflation Targeting Make a Difference?” NBER Working Paper 12876, National Bureau of Economic Research, Cambridge, MA.
Nogueira, R., and M. Leon-Ledesmab. 2009. “Fear of Floating in Brazil: Did Inflation Targeting Matter?”
North American Journal of Economics and Finance 20 (3): 255-66.
Reinhart, C., K. Rogoff, and M. Savastano. 2014. “Addicted to Dollars.” Annals of Economics and Finance 15 (1): 1-50.
Reyes, J. 2004. “Exchange Rate Pass-Through Effects and Inflation Targeting in Emerging Economies: What Is the Relationship?” Review of International Economics
15 (3): 538-59.
Rincón-Castro, H. and N. Rodríguez-Niño. 2018. “Nonlinear State and Shock Dependence of Exchange Rate Passthrough on Prices.” BIS Working Paper 690, Bank for International Settlements, Bazel.
Sadeghi, S., M. Feshari, M. Marvasti, and Z. Ghanbari. 2015. “Exchange Rate Pass-Through and Inflation in Dollarized Economies: Evidence from the Middle Eastern and North African Countries.” Iranian Economic Review 19 (2): 139-47.
Schmidt-Hebbel, K., and M. Tapia. 2002. “Monetary Policy Implementation and Results in Twenty Inflation -Targeting Countries.” Working Paper 166, Central Bank of Chile, Santiago.
Schmitt Grohé, S., and M. Uribe. 2018. “How Important Are Terms-of-Trade Shocks?” International Economic Review 59 (1): 85-111.
Shambaugh, J. 2008. “A New Look at Pass-Through.”
Journal of International Money and Finance 27 (4): 560-91.
Shu, C., and X. Su. 2009. “Exchange Rate PassThrough in China.” China and World Economy 17 (1): 33-46.
Soto, C., and J. Selaive. 2003. “Openness and Imperfect Pass-Through: Implications for the Monetary Policy.” Working Paper 216, Central Bank of Chile, Santiago.
Stock, J. H., and M. W. Watson. 2012. “Disentangling the Channels of the 2007-2009 Recession.” NBER Working Paper 18094, National Bureau of Economic Research, Cambridge, MA.
Taylor, J. 2000. “Low Inflation, Pass-Through, and the Pricing Power of Firms.” European Economic Review 44 (7): 1389-1408.
Uhlig, H. 2005. “What Are the Effects of Monetary Policy on Output? Results from an Agnostic Identification Procedure.” Journal of Monetary Economics 52 (2): 381-419.
Wang, J., and N. Li. 2010. “Exchange Rate PassThrough: The Case of China.” Frontiers of Economics in China 5 (3): 356-74.

vk.com/id446425943
CHAPTER 2
 REGIONAL
OUTLOOKS
vk.com/id446425943
vk.com/id446425943
Growth in the East Asia and Pacific region is projected to slow from 6.3 percent in 2018 to 5.9 percent in 2019-20, and to ease further to 5.8 percent in 2021. This will mark the first time since the 1997-98 Asian financial crisis that EAP growth dropped below 6 percent. In China, growth is expected to decelerate from 6.6 percent in 2018 to 6.2 percent in 2019, and gradually decline to 6.0 percent by 2021, reflecting softening manufacturing activity and trade amid domestic and external headwinds. In the rest of the region growth is also expected to moderate to 5.1 percent in 2019, before rebounding modestly to 5.2 percent in 2020-21, as global trade stabilizes. Risks to regional growth remain tilted to the downside and have intensified with the reescalation of trade tensions. They include a sharper-than-expected slowdown in major economies, including China; an intensification of global trade tensions; and an abrupt change in global financing conditions and investor sentiment.
Recent developments
Growth in the East Asia and Pacific (EAP) region is slowing, largely reflecting a deceleration in China. Growth in the rest of the region is also moderating, but less sharply, albeit with notable heterogeneity (Table 2.1.1; Figure 2.1.1.A). Regional trade, especially exports, has plummeted amid weakening global investment and elevated trade policy uncertainty related to ongoing U.S- China trade tensions. Export growth has declined sharply, in line with the slowdown in global growth of manufacturing, investment, and trade. Import growth has also decelerated, but is still solid, aided by robust domestic demand growth (Figure 2.1.1.B). Inflation is generally below targets across the region, but has been trending up recently, reflecting higher food prices (Figure 2.1.1.C). External financing conditions have been generally supportive, with narrowing bond spreads and improved net capital inflows (Figure 2.1.1.D). Regional currencies and equity markets, however, are under renewed pressure, most recently following the re-escalation of trade tensions (World Bank 2019a; Figures 2.1.1.E-F).
Note: This section was prepared by Ekaterine Vashakmadze. Research assistance was provided by Liu Cui.
In China, the economy continues to slow and rebalance. Decelerating industrial production growth has been partly offset by more resilient activity in the services sector (Figure 2.1.2.A). Fiscal policies have eased and monetary policies have been generally supportive, helping to balance the impact of external and domestic headwinds (Chapter 1).
China’s consumer price inflation has been trending up, but remains below the 3 percent target, while producer price inflation has bottomed out, partly reflecting some stabilization in the industrial sector. The current account surplus widened in 2019Q1 (Figure 2.1.2.B). Both export and import growth slowed sharply in late 2018, and despite some signs of stabilization, recent high-frequency indicators point to continuing broad-based weakness in trade (Figure 2.1.2.C).
Asset prices came under renewed pressure most recently, following a re-escalation of trade tensions in early May (Figures 2.1.2.D-E). Sovereign bond spreads remain above their long-term averages, reflecting slowing growth prospects amid lingering domestic vulnerabilities and ongoing trade disputes with the United States.
vk.com/id446425943
90 |
C H AP T E R 2 . 1 |
G L O BAL EC O NO M I C P ROS P EC T S | J U NE 2 0 1 9 |
|
|
|
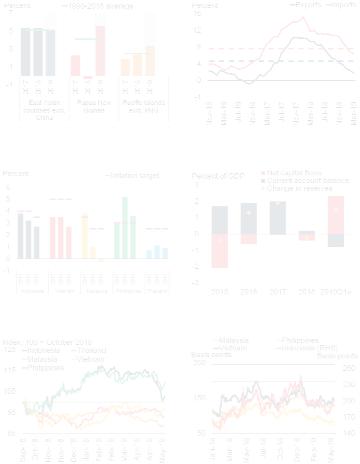
FIGURE 2.1.1 EAP region excluding China: Recent developments
Growth in the EAP region is slowing, albeit with notable heterogeneity. Regional export growth has declined sharply, while domestic demand remains robust. Inflation has been trending downward across the region and is generally below targets. Net capital flows improved in 2019Q1. Regional equity markets, however, are under renewed pressure, most recently following the re-escalation of trade tensions. Financial conditions remain supportive with bond spreads generally narrowing or below their long-term averages.
A. Growth |
B. Export and import growth |
|
|
|
|
C. Inflation |
D. Balance of payments |
|
|
E. Equity prices |
F. Bond spreads |
Source: Haver Analytics, International Monetary Fund, World Bank.
A.East Asian countries excl. China includes Cambodia, Indonesia, Lao PDR, Malaysia, Mongolia, Myanmar, Palau, Philippines, Thailand, and Vietnam. Pacific Island excl. PNG includes Fiji, Kiribati, Marshall Islands, Micronesia, Palau, Samoa, Solomon Islands, Timor-Leste, Tonga, Tuvalu, and Vanuatu. 1990-2018 average for East Asian countries excl. China excludes Myanmar and 1990-2018 average for Pacific Island excl. PNG excludes Marshall Islands, Micronesia, Palau, Timor-Leste, and Tuvalu due to data limitations. Aggregate growth rates are calculated using 2010 U.S. dollar GDP weights. Data in shaded areas are forecasts.
B.Export and import volumes. Data include only goods. 12-month moving average. Regional aggregate excludes Cambodia, Fiji, Lao PDR, Mongolia, Myanmar, Solomon Islands, Papua New Guinea, Timor-Leste, Vanuatu, and Vietnam due to data limitations. Dotted lines indicate January 2000-March 2019 averages. Last observation is March 2019.
C.Average year-on-year consumer price inflation. Mid-point of inflation for Indonesia, Philippines, and Thailand. Inflation target for China and Vietnam. For Malaysia, the low point of Bank Negara’s official forecast range of 2.5-3.5 percent in the 2019 budget is used. Last observation is April 2019.
D.e=estimate. The aggregate includes Indonesia, Malaysia, Philippines, and Thailand. Net capital flows and change in reserves are staff estimates. Net capital inflows include net capital and financial account balance, errors and omissions. 2019Q1 data is not available for Philippines and Thailand.
E.Equity index stands for the respective country composite index. Last observation is May 21, 2019.
F.The spread of a country’s sovereign debt as measured by J.P. Morgan’s Emerging Markets Bond Index over their equivalent maturity U.S. Treasury bond. Horizontal lines denote January 2000-May 2019 average rates. Last observation is May 21, 2019.
Click here to download data and charts.
Regulatory tightening has helped reduce leverage in some segments of the non-bank sector; however, bank credit growth remains robust and bond issuance has accelerated (Figure 2.1.2.F). Total leverage of the economy— measured as the ratio of total credit (general government and non-financial private sector) to gross domestic product—is estimated to have increased by about 2 percentage points of GDP in the year to 2018Q4. Total debt has surpassed 250 percent of GDP.
Growth in commodity importers remains robust but continues to moderate, reflecting weakening exports amid resilient domestic demand. Inflation is subdued or declining in most countries (Cambodia, the Philippines, Thailand, Vietnam), allowing monetary authorities to keep policy rates steady, generally at accommodative levels. In Thailand, domestic demand is supported by more accommodative fiscal policy. However, weakening export growth is weighing on activity. In the Philippines, private consumption is rebounding amid slowing inflation and improving employment conditions. In addition, electionrelated spending in the first half of 2019 is giving the economy an additional boost and is partly mitigating the impact of weakening exports.
In commodity exporters, the cyclical recovery is maturing, and the pace and composition of growth increasingly reflect country-specific factors. In larger and more diversified economies, where past terms-of-trade shocks were less acute and macroeconomic fundamentals are strong, steady growth has continued at rates of around 4.5-5 percent per year (Indonesia, Malaysia). In Indonesia, growth has been supported by robust private consumption and investment. In Malaysia, investment is rebounding, reflecting improved financing conditions and business confidence, offsetting the impact of moderating but still robust consumption growth. In smaller commodity exporters, the subdued recovery from the 2015-16 downturn is resuming at a stronger- than-expected pace, helped by investments in new mining projects (Mongolia) and a rebound in the extractive sector following a devastating earthquake in 2018 (Papua New Guinea).