

Global Economic Prospects -World Bank_watermark
.pdfvk.com/id446425943
CHAPTER 1
GLOBAL OUTLOOK
Weak Momentum, Heightened Risks
vk.com/id446425943

vk.com/id446425943
G L O BAL EC O NO M I C P ROS P EC T S | J U NE 2 0 1 9 |
C H AP T E R 1 |
3 |
|
|
|
Global growth in 2019 has been downgraded to 2.6 percent, 0.3 percentage point below previous forecasts, reflecting weaker-than-expected international trade and investment at the start of the year. Growth is projected to gradually rise to 2.8 percent by 2021, predicated on continued benign global financing conditions, as well as a modest recovery in emerging market and developing economies (EMDEs) previously affected by financial market pressure. However, EMDE growth remains constrained by subdued investment, which is dampening prospects and impeding progress toward achieving development goals. Risks are also firmly on the downside, in part reflecting the possibility of destabilizing policy developments, including a further escalation of trade tensions between major economies; renewed financial turmoil in EMDEs; and sharper-than-expected slowdowns in major economies. It is therefore urgent for EMDEs to reinforce policy buffers and build resilience to possible negative shocks, and to implement reforms that promote private investment and improve public sector efficiency. Efforts to strengthen access to markets and technology while boosting the quality of infrastructure and governance should be prioritized and be implemented through cost-effective and private-sector-led solutions. Structural reforms aimed at improving the business climate would also boost growth prospects. Well-designed social safety nets and active labor market policies are key to managing risks and protecting vulnerable groups.
Summary
Global economic activity continued to soften at the start of 2019, with trade and manufacturing showing signs of marked weakness (Figures 1.1.A and B). Heightened policy uncertainty, including a recent re-escalation of trade tensions between major economies, has been accompanied by a deceleration in global investment and a decline in confidence (Figure 1.1.C). Activity in major advanced economies—particularly in the Euro Area—as well as in some large emerging market and developing economies (EMDEs) has been weaker than previously expected. Recent highfrequency indicators suggest this period of weakness may be receding; however, global activity remains subdued.
Amid low global inflation and a deterioration of the growth outlook, the prospect that the U.S. Federal Reserve and other major central banks will tighten monetary policy in the near term has faded, leading to an easing in global financing conditions and a recovery of capital flows to EMDEs. However, weakening external demand has weighed on export growth across EMDE regions. Although demand for industrial commodities has generally softened, prices have
Note: This chapter was prepared by Carlos Arteta, Patrick Kirby, and Marc Stocker, with contributions from Ekaterine Vashakmadze and Collette M. Wheeler. Additional inputs were provided by John Baffes, Csilla Lakatos, Peter Nagle, Franz Ulrich Ruch, and Rudi Steinbach. Research assistance was provided by Liu Cui, Ishita Dugar, Claudia Marchini, Julia R.R. Norfleet, and Jinxin Wu.
partially recovered because of tightening supply conditions. EMDE growth momentum continues to be generally subdued, as slowing global trade and persistent policy uncertainty in key economies are only partially offset by recent improvements in external financing conditions.
Global growth in 2019 has been downgraded to 2.6 percent—0.3 percentage point below previous projections—reflecting the broad-based weakness observed during the first half of the year, including a further deceleration in investment amid rising trade tensions. In particular, global trade growth in 2019 has been revised down a full percentage point, to 2.6 percent—slightly below the pace observed during the 2015-16 trade slowdown, and the weakest since the global financial crisis.
As recent softness abates, global growth is projected to edge up to 2.7 percent in 2020 and to 2.8 percent in 2021. Slowing activity in advanced economies and China is expected to
be |
accompanied by |
a modest cyclical recovery |
|||
in major commodity |
exporters and in a number |
||||
of |
EMDEs |
affected |
by |
recent pressure |
related |
to |
varying |
degrees |
of |
financial market |
stress |
or idiosyncratic headwinds such as sanctions (Figure 1.1.D).
EMDE growth is projected to pick up from a four-year low of 4 percent in 2019—0.3 percentage point below previous projections—to 4.6 percent in 2020-21. This recovery is predicated on the waning impact of earlier

vk.com/id446425943
4 C H AP T E R 1 G L O BAL EC O NO M I C P ROS P EC T S | J U NE 2 0 1 9
TABLE 1.1 Real GDP1 |
|
|
|
|
|
|
|
Percentage point differences |
||
|
|
|
|
|
|
|
|
|||
(Percent change from previous year) |
|
|
|
|
|
|
|
from January 2019 projections |
||
|
|
|
|
|
|
|
|
|
|
|
|
2016 |
2017 |
2018e |
2019f |
2020f |
2021f |
|
2019f |
2020f |
2021f |
World |
2.6 |
3.1 |
3.0 |
2.6 |
2.7 |
2.8 |
|
-0.3 |
-0.1 |
0.0 |
Advanced economies |
1.7 |
2.3 |
2.1 |
1.7 |
1.5 |
1.5 |
|
-0.3 |
-0.1 |
0.0 |
United States |
1.6 |
2.2 |
2.9 |
2.5 |
1.7 |
1.6 |
|
0.0 |
0.0 |
0.0 |
Euro Area |
2.0 |
2.4 |
1.8 |
1.2 |
1.4 |
1.3 |
|
-0.4 |
-0.1 |
0.0 |
Japan |
0.6 |
1.9 |
0.8 |
0.8 |
0.7 |
0.6 |
|
-0.1 |
0.0 |
0.0 |
Emerging market and developing economies |
4.1 |
4.5 |
4.3 |
4.0 |
4.6 |
4.6 |
|
-0.3 |
0.0 |
0.0 |
Commodity-exporting EMDEs |
1.5 |
2.1 |
2.2 |
2.1 |
3.1 |
3.0 |
|
-0.4 |
0.1 |
0.0 |
Other EMDEs |
6.0 |
6.1 |
5.8 |
5.2 |
5.5 |
5.5 |
|
-0.3 |
-0.1 |
-0.1 |
Other EMDEs excluding China |
5.1 |
5.4 |
4.9 |
4.2 |
4.8 |
5.0 |
|
-0.5 |
-0.1 |
-0.1 |
East Asia and Pacific |
6.3 |
6.5 |
6.3 |
5.9 |
5.9 |
5.8 |
|
-0.1 |
-0.1 |
0.0 |
China |
6.7 |
6.8 |
6.6 |
6.2 |
6.1 |
6.0 |
|
0.0 |
-0.1 |
0.0 |
Indonesia |
5.0 |
5.1 |
5.2 |
5.2 |
5.3 |
5.3 |
|
0.0 |
0.0 |
0.0 |
Thailand |
3.4 |
4.0 |
4.1 |
3.5 |
3.6 |
3.7 |
|
-0.3 |
-0.3 |
-0.2 |
Europe and Central Asia |
1.9 |
4.1 |
3.1 |
1.6 |
2.7 |
2.9 |
|
-0.7 |
0.0 |
0.0 |
Russia |
0.3 |
1.6 |
2.3 |
1.2 |
1.8 |
1.8 |
|
-0.3 |
0.0 |
0.0 |
Turkey |
3.2 |
7.4 |
2.6 |
-1.0 |
3.0 |
4.0 |
|
-2.6 |
0.0 |
-0.2 |
Poland |
3.1 |
4.8 |
5.1 |
4.0 |
3.6 |
3.3 |
|
0.0 |
0.0 |
0.0 |
Latin America and the Caribbean |
-0.3 |
1.7 |
1.6 |
1.7 |
2.5 |
2.7 |
|
-0.4 |
-0.2 |
0.0 |
Brazil |
-3.3 |
1.1 |
1.1 |
1.5 |
2.5 |
2.3 |
|
-0.7 |
0.1 |
-0.1 |
Mexico |
2.9 |
2.1 |
2.0 |
1.7 |
2.0 |
2.4 |
|
-0.3 |
-0.4 |
0.0 |
Argentina |
-2.1 |
2.7 |
-2.5 |
-1.2 |
2.2 |
3.2 |
|
0.5 |
-0.5 |
0.1 |
Middle East and North Africa |
5.1 |
1.2 |
1.4 |
1.3 |
3.2 |
2.7 |
|
-0.6 |
0.5 |
0.0 |
Saudi Arabia |
1.7 |
-0.7 |
2.2 |
1.7 |
3.1 |
2.3 |
|
-0.4 |
0.9 |
0.1 |
Iran |
13.4 |
3.8 |
-1.9 |
-4.5 |
0.9 |
1.0 |
|
-0.9 |
-0.2 |
-0.1 |
Egypt2 |
4.3 |
4.2 |
5.3 |
5.5 |
5.8 |
6.0 |
|
-0.1 |
0.0 |
0.0 |
South Asia |
8.1 |
6.7 |
7.0 |
6.9 |
7.0 |
7.1 |
|
-0.2 |
-0.1 |
0.0 |
India3 |
8.2 |
7.2 |
7.2 |
7.5 |
7.5 |
7.5 |
|
0.0 |
0.0 |
0.0 |
Pakistan2 |
4.6 |
5.4 |
5.8 |
3.4 |
2.7 |
4.0 |
|
-0.3 |
-1.5 |
-0.8 |
Bangladesh2 |
7.1 |
7.3 |
7.9 |
7.3 |
7.4 |
7.3 |
|
0.3 |
0.6 |
0.5 |
Sub-Saharan Africa |
1.3 |
2.6 |
2.5 |
2.9 |
3.3 |
3.5 |
|
-0.5 |
-0.3 |
-0.2 |
Nigeria |
-1.6 |
0.8 |
1.9 |
2.1 |
2.2 |
2.4 |
|
-0.1 |
-0.2 |
0.0 |
South Africa |
0.6 |
1.4 |
0.8 |
1.1 |
1.5 |
1.7 |
|
-0.2 |
-0.2 |
-0.1 |
Angola |
-2.6 |
-0.1 |
-1.7 |
1.0 |
2.9 |
2.8 |
|
-1.9 |
0.3 |
0.0 |
MEMORANDUM ITEMS: |
|
|
|
|
|
|
|
|
|
|
Real GDP1 |
|
|
|
|
|
|
|
|
|
|
High-income countries |
1.7 |
2.3 |
2.1 |
1.8 |
1.6 |
1.6 |
|
-0.2 |
-0.1 |
0.0 |
Developing countries |
4.4 |
4.8 |
4.6 |
4.2 |
4.7 |
4.8 |
|
-0.3 |
-0.1 |
0.0 |
Low-income countries |
4.8 |
5.6 |
5.6 |
5.4 |
6.0 |
6.1 |
|
-0.5 |
-0.2 |
-0.2 |
BRICS |
4.6 |
5.3 |
5.4 |
5.1 |
5.3 |
5.3 |
|
-0.1 |
0.0 |
0.0 |
World (2010 PPP weights) |
3.3 |
3.7 |
3.7 |
3.3 |
3.5 |
3.6 |
|
-0.3 |
-0.1 |
0.0 |
World trade volume4 |
2.8 |
5.5 |
4.1 |
2.6 |
3.1 |
3.2 |
|
-1.0 |
-0.4 |
-0.2 |
Commodity prices5 |
|
|
|
|
|
|
|
|
|
|
Oil price |
-15.6 |
23.3 |
29.4 |
-3.4 |
-1.5 |
0.7 |
|
-0.5 |
-1.5 |
0.7 |
Non-energy commodity price index |
-2.8 |
5.5 |
1.7 |
-2.1 |
-0.1 |
1.4 |
|
-3.1 |
-1.3 |
0.2 |
|
|
|
|
|
|
|
|
|
|
|
Source: World Bank.
Notes: PPP = purchasing power parity; e = estimate; f = forecast. World Bank forecasts are frequently updated based on new information. Consequently, projections presented here may differ from those contained in other World Bank documents, even if basic assessments of countries’ prospects do not differ at any given moment in time. Country classifications and lists of emerging market and developing economies (EMDEs) are presented in Table 1.2. BRICS include: Brazil, Russia, India, China, and South Africa. Due to lack of data, the World Bank has ceased producing a growth forecast for Venezuela and has removed Venezuela from all growth aggregates in which it was previously included.
1.Aggregate growth rates calculated using constant 2010 U.S. dollar GDP weights.
2.GDP growth values are on a fiscal year basis. Aggregates that include these countries are calculated using data compiled on a calendar year basis. Pakistan's growth rates are based on GDP at factor cost. The column labeled 2019 refers to FY2018/19.
3.The column labeled 2018 refers to FY2018/19.
4.World trade volume of goods and non-factor services.
5.Oil is the simple average of Brent, Dubai, and West Texas Intermediate. The non-energy index is comprised of the weighted average of 39 commodities (7 metals, 5 fertilizers, 27
agricultural commodities). For additional details, please see http://www.worldbank.org/en/research/commodity-markets. Click here to download data.
vk.com/id446425943
G L O BAL EC O NO M I C P ROS P EC T S | J U NE 2 0 1 9 |
C H AP T E R 1 |
5 |
|
|
|
financial pressure currently weighing on activity in some large EMDEs, and on more benign global financing conditions than previously expected. It also assumes no further escalation in trade restrictions between major economies and stability in commodity prices. Despite this projected recovery, per capita growth in a large number of EMDEs will remain insufficient to narrow income gaps with advanced economies—including in SubSaharan Africa, a region with a high concentration of poverty (Figure 1.1.E).
Moreover, EMDE investment growth will remain soft, particularly in commodity exporters and countries affected by recent pressures (Figure 1.1.F). Factors contributing to the weak pace of EMDE investment growth include elevated debt levels, limited fiscal space, lack of clarity about policy direction, and inadequate business climates. Subdued investment will weigh on EMDE growth prospects directly through slower capital deepening and indirectly through its dampening impact on productivity, which will make achieving the Sustainable Development Goals more difficult.
Amid a low probability of substantial near-term policy improvements in major economies, risks remain firmly on the downside (Figure 1.2.A). Confidence and investment could be markedly impacted by a sudden rise in policy uncertainty— triggered, for instance, by substantial new trade barriers between major economies resulting in cascading trade costs and a lack of clarity about future trading rules (Figure 1.2.B). If this rise is persistent, the impact on global investment and activity could be severe. An increase in uncertainty could also be related to a heightened possibility of a disorderly exit of the United Kingdom from the European Union (EU). Similarly, a sustained dissipation of these uncertainties—for instance, due to a comprehensive resolution of trade tensions between the United States and China— could significantly buttress global growth prospects. The potential gains associated with such a resolution highlight the large opportunity costs that additional trade tensions would entail.
A weakening of financial market sentiment could lead to sudden increases in risk premiums and be amplified by high and rising debt levels, corporate sector vulnerabilities, and increasing refinancing
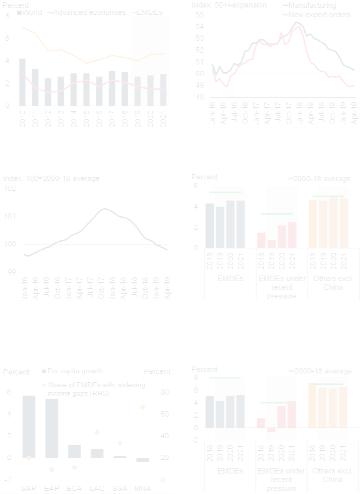
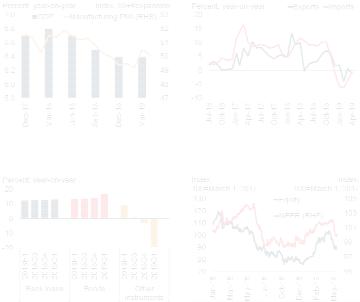
FIGURE 1.1 Global growth prospects
Global growth softened further in the first half of the year, as trade and manufacturing decelerated. Amid heightened policy uncertainty, confidence has declined. A more dovish stance by major central banks has led to some easing in financing conditions. After weakness in 2019, EMDE growth is expected to recover in 2020-21, as headwinds in key economies fade. In many EMDEs, this recovery will not be enough to narrow per capita income gaps with advanced economies. Subdued investment will continue to weigh on EMDE growth prospects.
A. Global growth |
B. Global manufacturing and new |
|
export orders |
|
|
C. Global business confidence
E. Per capita growth and share of EMDEs with widening income gaps in 2019
D. Growth in EMDEs
F. Investment growth in EMDEs
Source: Haver Analytics, J.P. Morgan, Organisation for Economic Co-operation and Development, World Bank.
Note: EMDEs = emerging market and developing economies.
A.D.F. Shaded areas indicate forecasts. Aggregate growth rates calculated using constant 2010 U.S. dollar GDP weights. Data for 2018 are estimates.
B.Manufacturing and new export orders are measured by Purchasing Managers’ Index (PMI). PMI readings above 50 indicate expansion in economic activity; readings below 50 indicate contraction. Black horizontal line indicates expansionary threshold. Last observation is April 2019.
C.Average business confidence across major advanced economies and EMDEs, including Brazil, Canada, France, Germany, Italy, Japan, Russia, Turkey, the United Kingdom, and the United States. Last observation is April 2019.
D.F. EMDEs under recent pressure include: a) countries that have had an increase in their J.P. Morgan EMBI credit spread of at least one standard deviation above the 2010-19 average at any time since April 2018 (Argentina, Brazil, Egypt, Gabon, Jordan, Lebanon, Mexico, Nigeria, South Africa, Sri Lanka, Tunisia, Turkey); or b) countries that have been subject to recent sanctions (Iran, Russia). E. EAP = East Asia and Pacific, ECA = Europe and Central Asia, LAC = Latin America and the Caribbean, MNA = Middle East and North Africa, SAR = South Asia, SSA = Sub-Saharan Africa. Countries with widening income gaps are those with per capita GDP growth at least 0.1 percentage point lower than advanced-economy per capita GDP growth.
Click here to download data and charts.
vk.com/id446425943
6 |
C H AP T E R 1 |
G L O BAL EC O NO M I C P ROS P EC T S | J U NE 2 0 1 9 |
|
|
|
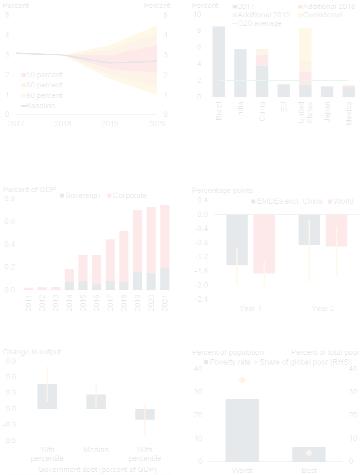
FIGURE 1.2 Global risks and policy challenges
Downside risks continue to dominate. A further escalation of trade tensions involving major economies could lead to a sharp increase in trade barriers and weigh on confidence and investment. The risk of financial stress in EMDEs could be exacerbated by increasing debt-refinancing needs. A sharp deceleration in major economies would have large spillover effects for EMDEs and increase the probability of a marked global downturn. Rising public debt levels are reducing the effectiveness of fiscal policy in EMDEs. Structural reforms, such as improvements in institutional quality, can help boost growth and reduce poverty.
A. Probability distribution around |
B. Average import tariffs in G20 |
global growth forecasts |
countries |
C. International bond redemptions in EMDEs
E. Fiscal multipliers in EMDEs
D. Impact of 1 percentage point growth slowdown in the United States, Euro Area, and China
F. Poverty, by regulatory quality
Source: Bloomberg; Dealogic; International Monetary Fund; World Bank.
A.The fan chart shows the forecast distribution of global growth using time-varying estimates of the standard deviation and skewness extracted from the forecast distribution of three underlying risk factors: Oil price futures, S&P 500 equity price futures, and term spread forecasts. Each of the risk factor’s weight is derived from the model described in Ohnsorge, Stocker, and Some (2016). Values for 2019 are computed from the forecast distribution of 6-month-ahead oil price futures, S&P 500 equity price futures, and term spread forecasts. Values for 2020 are based on 18-month-ahead forecast distributions. Last observation is May 21, 2019.
B.Blue bars are the trade-weighted averages for 2017 tariffs. “Considered” reflects announcements of possible tariffs as of May 23, 2019, including an additional 25 percent tariff on U.S. imports from China not subject to 2018 tariff hikes and on selected U.S. imports of motor vehicles and parts.
C.Data are as of May 22, 2019.
D.Bars are impulse responses to a 1 percentage point decline in the United States, Euro Area, and China. Yellow lines are 16-84 percent confidence intervals. Based on the vector autoregression model in World Bank (2016). Sample includes 22 advanced economies and 19 EMDEs.
E.Bars are the median conditional fiscal multipliers after two years. Fiscal multipliers are the cumulative change in output relative to cumulative change in government consumption to a 1-unit government consumption shock. Orange lines are 16-84 percent confidence bands.
F.Poverty rate is the unweighted average in each group. “Best” indicates quartile of EMDEs with the strongest regulatory quality (2017 or for year with latest poverty data); “Worst” indicates the weakest regulatory quality. The back data for regulatory quality are from the World Governance Indicators.
Click here to download data and charts.
pressures in many EMDEs (Figure 1.2.C). The risk of a sharper-than-expected deceleration in major economies—such as the Euro Area, the United States, or China—would result in considerably weaker global and EMDE growth (Figure 1.2.D). Meanwhile, climate change poses ever-growing risks to various EMDE regions.
Moderating global activity and heightened downside risks highlight the need for policymakers in advanced economies and EMDEs to reinforce policy buffers against possible negative shocks, and to shore up both short-term and long-term growth prospects.
For advanced economies, the associated challenges include the appropriate use of automatic fiscal stabilizers and discretionary spending, when feasible, as well as clear and credible monetary policy guidance that reduces the risk of abrupt market adjustments. Productivity-enhancing reforms are also crucial to deal with slowing labor force growth.
In EMDEs, policymakers need to use the opportunity provided by still benign financing conditions to rebuild fiscal and monetary policy buffers to confront future shocks. Even if borrowing costs are currently low, countries with constrained fiscal positions may find that rising debt levels limit the effectiveness of public spending and make them more vulnerable to crises (Box 1.1; Figure 1.2.E). Amid adverse debt dynamics and narrowing fiscal space, authorities need to urgently strengthen domestic resource mobilization, prioritize growth-enhancing spending, and improve debt management and transparency.
While growth prospects are subdued, there is a substantial upside potential from the implementation of structural reforms that improve the business climate and encourage job creation. Increased public sector efficiency and measures to foster private sector investments will be key to meet large infrastructure needs in electricity, transport, water supply and sanitation, and climate change prevention and mitigation. Estimates of the infrastructure spending required to meet the Sustainable Development Goals in those areas by 2030 range between 4.5 to 8.2 percent of EMDE
vk.com/id446425943
G L O BAL EC O NO M I C P ROS P EC T S | J U NE 2 0 1 9 |
C H AP T E R 1 |
7 |
|
|
|
GDP, depending on policy choices. Improving access to reliable and affordable electricity, enhancing the quality of logistics and transport infrastructure, leveraging digital technologies, and improving institutional quality could help unlock a large untapped growth potential and contribute to poverty alleviation (Figure 1.2.F).
Raising agricultural productivity could also help boost development opportunities and increase resilience to extreme weather events in regions with large exposed populations. Strengthening the role of social safety nets and active labor market policies is also key to manage risks and promote access to productive employment.
Finally, amid soft growth prospects and heightened risks, both advanced economies and EMDEs need to be prepared to undertake coordinated policy action in the event of a severe global slowdown that threatens to inflict major economic losses and set back progress on poverty alleviation. International coordination would magnify the effectiveness of available fiscal and monetary policy buffers. International financial institutions and the G20 can play an important role in fostering such coordination.
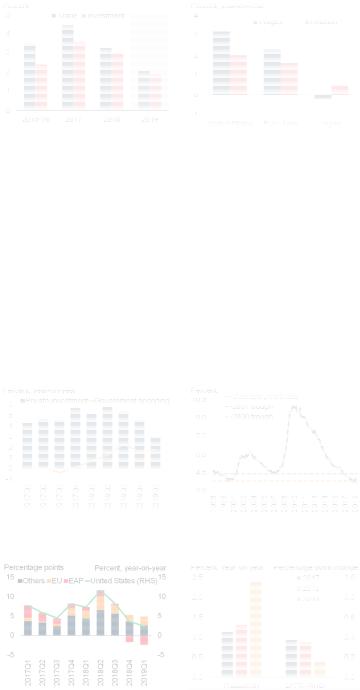
FIGURE 1.3 Advanced economies
Trade and investment in advanced economies have lost momentum. In contrast, rising real wages are supporting consumption in most countries.
A. Trade and investment growth, |
B. Wage growth and inflation in early |
|
volumes |
2019 |
|
|
|
|
Source: Haver Analytics, World Bank.
A.Trade calculated as the average of imports and exports of goods and services. Shaded area indicates forecasts.
B.Last observation is April 2019 for U.S. wages and Consumer Price Index, and Euro Area Harmonized Index of Consumer Prices; March 2019 for Japan wages and Consumer Price Index; and 2018Q4 for Euro Area wages. Wages are average hourly earnings of private nonfarm employees for the United States, average monthly earnings for Japan, and nominal hourly wages and salaries for the Euro Area.
Click here to download data and charts.
FIGURE 1.4 United States
U.S. activity is still being bolstered by government spending and corporate tax cuts, but the boost is fading. Unemployment recently reached its lowest level in nearly five decades. Amid heightened trade tensions, exports have slowed, especially those to Europe and Asia. Rising productivity and labor force participation are supporting activity.
A. Private investment and government |
B. Unemployment rate and previous |
spending |
troughs |
Major economies: Recent developments and outlook
Activity in advanced economies is slowing, especially in the Euro Area, in part due to weakening exports and investment. Amid subdued inflation and decelerating activity, major central banks have signaled a more dovish stance. In the United States, the effects of recent fiscal stimulus are waning. In China, growth appears to be stabilizing following weakness at the start of the year, but it faces heightened risks.
Recent data for advanced economies point to decelerating activity, especially in the Euro Area. Investment has lost momentum and trade growth has declined markedly (Figure 1.3.A). Private consumption has so far been resilient, however, supported by ongoing job creation and higher real wages (Figure 1.3.B). In response to subdued inflation and decelerating activity, monetary policy has become more accommodative.
C. Contribution to export growth, by |
D. Productivity and labor force |
|
trading partner |
participation |
|
|
|
|
Source: Bureau of Economic Analysis, Federal Reserve Bank of St. Louis, Haver Analytics, U.S. Census Bureau, World Bank.
A.Government spending is government consumption and investment spending. Last observation is 2019Q1.
B.Data for civilian unemployment rate are seasonally adjusted. Last observation is April 2019.
C.EU = European Union, EAP = East Asia and Pacific. Last observation is 2019Q1.
D.LFPR = Labor force participation rate. LFPR refers to civilian labor force participation rate
of people aged 25 to 54 years. Data for 2019 are Q1 for Productivity and April for LFPR. Click here to download data and charts.
vk.com/id446425943
8 |
C H AP T E R 1 |
G L O BAL EC O NO M I C P ROS P EC T S | J U NE 2 0 1 9 |
|
|
|
FIGURE 1.5 Euro Area
Euro Area economic conditions have deteriorated rapidly since early 2018, particularly in manufacturing and industrial activity. Exports have fallen sharply. Domestic demand has also slowed, but to a lesser degree. Fiscal policy is expected to be modestly stimulative in coming years.
A. Industrial production growth and |
B. Contribution to export growth, by |
manufacturing PMI |
trading partner |
|
|
C. Domestic demand contribution to |
D. Fiscal impulse in the Euro Area |
GDP growth |
|
Source: Eurostat, Haver Analytics, International Monetary Fund, World Bank.
A.PMI = Purchasing Managers’ Index. Readings above 50 indicate expansion in economic activity; readings below 50 indicate contraction. Last observation is April 2019 for PMI and March 2019 for industrial production.
B.ECA = Europe and Central Asia, EAP = East Asia and Pacific. Data are seasonally and working day adjusted. Last observation is 2019Q1.
C.Final domestic demand is GDP less net exports of goods and services, less changes in inventories. Last observation is 2019Q1 for GDP growth and 2018Q4 for consumption and investment.
D.Changes versus previous year. A positive (negative) number indicates expansionary (contractionary) fiscal policy. Country contributions are calculated using nominal GDP weights. Fiscal impulse indicates the change in cyclically adjusted primary balance, namely the estimate of the fiscal balance that would apply under current policies if output were equal to potential. Data on the general government cyclically adjusted primary balance are published in the April 2019 edition of the Fiscal Monitor (IMF 2019).
Click here to download data and charts.
Aggregate activity in advanced economies is expected to decelerate over the forecast horizon.
United States
Growth in the United States remains solid. The Tax Cuts and Jobs Act of late 2017 and the Bipartisan Budget Act of early 2018 are supporting near-term growth, but their contribution is diminishing (Barro and Furman 2018; Figure 1.4.A). Unemployment is at its lowest level in nearly five decades, and inflation is hovering slightly below the 2-percent target
(Figure 1.4.B). Export growth has slowed further, with an especially acute deceleration in goods going to the European Union and the East Asia and Pacific region (Figure 1.4.C). By raising costs on a variety of goods, recent tariff increases have so far modestly weighed on U.S. real incomes (Fajgelbaum et al. 2019; Amiti et al. 2019). In light of muted inflation, heightened risks from the external environment, and unresolved policy issues, the Federal Reserve has signaled a more gradual pace of tightening.
U.S. growth is expected to slow to 2.5 percent in 2019 and further decelerate to 1.7 percent in 2020 and 1.6 percent in 2021, as the effects of recent fiscal stimulus wane. These projections are unchanged from the previous forecast due to offsetting factors. On the one hand, recent tariff increases and associated retaliatory actions are expected to weigh on activity. On the other, growth is being supported by more accommodative monetary policy than previously assumed and by sustained increases in productivity growth and labor force participation (Figure 1.4.D). A continuation of these positive structural trends could result in higher mediumand longterm growth than currently predicted. In contrast, further increases in trade restrictions or policy uncertainty could hinder activity.
Euro Area
Economic conditions in the Euro Area have deteriorated rapidly since mid-2018, particularly in the manufacturing sector (Figure 1.5.A). This slowdown mainly reflects a decline in exports, especially to China and the Europe and Central Asia region (Figure 1.5.B). Domestic demand has also softened, albeit to a lesser degree, as it remains buoyed by declining unemployment and solid real wage growth (Figure 1.5.C).
In response to slowing activity, Germany, France, and Italy have announced plans for limited tax cuts and spending increases, equivalent to a combined 0.2 percent of Euro Area GDP per year during 2019-21 (Figure 1.5.D). In addition, the European Central Bank (ECB) has announced it will provide banks with additional low-cost credit, starting in September. Core inflation remains
vk.com/id446425943
G L O BAL EC O NO M I C P ROS P EC T S | J U NE 2 0 1 9 |
C H AP T E R 1 |
9 |
|
|
|
around 1 percent, and the ECB is not expected to begin raising its main refinancing rate above zero until at least 2020.
Growth is projected to slow from 1.8 percent in 2018 to 1.2 percent in 2019 and to edge up to an average of 1.4 percent in 2020-21. Relative to previous projections, this represents a downgrade of 0.4 percentage point in 2019 and 0.1 percentage point in 2020, reflecting weakness in trade and domestic demand that will not be fully offset by more accommodative fiscal and monetary policy support.
Japan
Activity in Japan benefited from government support in the first half of 2019, as well as a rebound following natural disasters last year, but remains lackluster. Trade—particularly exports to China—has been especially weak. A value-added tax (VAT) hike in October is likely to dampen activity further. Nonetheless, unemployment is low, labor force participation continues to climb, and the services sector remains relatively healthy.
Growth in 2019 is expected to be 0.8 percent, down from previous projections due to weaker- than-expected external demand. A variety of fiscal measures are expected to soften the near-term impact of the VAT hike toward the end of the year. With the economy at close to full employment and potential output constrained by low labor force growth, capacity constraints will slow activity to a projected 0.7 percent in 2020 and 0.6 percent in 2021.
China
Following several quarters of broad-based deceleration, growth appears to be stabilizing (Figure 1.6.A). Trade flows have been weak, however, weighed down by softness in manufacturing output, trade tensions with the United States, and lackluster global growth (Figure 1.6.B).
Recent activity has been supported by monetary and fiscal stimulus. Bank credit and bond issuance have picked up, but other non-bank lending has moderated due to regulatory tightening (Figure 1.6.C). Equity prices and the renminbi, which
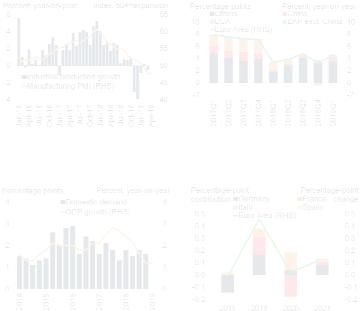
FIGURE 1.6 China
Following several quarters of broad-based deceleration, growth appears to be stabilizing. However, trade flows remain weak. Bank credit is stable and bond issuance has picked up, but other non-bank lending has moderated due to regulatory tightening. Equity prices, which recovered in early 2019 thanks in part to stimulus measures, have faced downward pressures amid the recent re-escalation of trade tensions.
A. Growth and manufacturing PMI |
B. Export and import growth, volumes |
|
|
|
|
C. Credit growth |
D. Equity prices and exchange rate |
|
|
|
|
Source: Haver Analytics, World Bank.
A.Purchasing Managers’ Index (PMI) readings above 50 indicate expansion in economic activity; readings below 50 indicate contraction. Last observation is April 2019 for manufacturing PMI and 2019Q1 for GDP.
B.Figure shows 3-month moving averages. Data include only goods. Export and import volumes are calculated as export and import values deflated by export and import price deflators. Export and import indices for some missing values and for April 2019 are estimates. Last observation is April 2019.
C.Figure shows average of monthly data for periods indicated. Bonds include local government special bonds and net financing of corporate bonds. Other instruments include entrusted loans and trust loans. Last observation is March 2019.
D.NEER = nominal effective exchange rate. An increase in the NEER denotes an appreciation. Equity index is represented by the Shanghai Stock Exchange Composite. Last observation is May 20, 2019 for equity prices and May 21, 2019 for NEER.
Click here to download data and charts.
rebounded in early 2019 partly due to policy support measures, have faced downward pressures amid the recent re-escalation of trade tensions (Figure 1.6.D). Consumer price inflation has picked up but remains below target.
Growth is projected to decelerate from 6.6 percent in 2018 to 6.2 percent in 2019, primarily reflecting softening manufacturing activity and trade. The recent increase in tariffs on trade with the United States is projected to weigh on growth in 2020, which has been revised down to 6.1 percent. This outlook is predicated on no further escalation of trade disputes with the United States.
vk.com/id446425943
10 |
C H AP T E R 1 |
G L O BAL EC O NO M I C P ROS P EC T S | J U NE 2 0 1 9 |
|
|
|
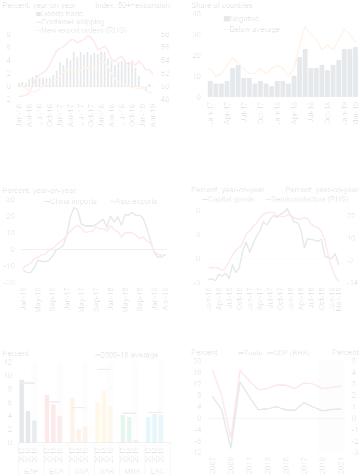
FIGURE 1.7 Global trade
Global goods trade growth weakened substantially in late 2018 and early 2019. While trade in Asia was markedly affected, the slowdown in industrial activity was widespread across countries. The softness reflected in part slowing demand for capital goods amid elevated trade policy uncertainty. Exports in most EMDE regions are expected to decelerate this year. Global trade growth is projected to slow to 2.6 percent this year, the weakest pace since the global financial crisis.
A. Goods trade volume, container |
B. Share of countries with negative or |
|
shipping, and export orders |
below-average industrial production |
|
|
|
growth |
|
|
|
C. Nominal merchandise import growth in China and export growth in Asia
E. Export volume growth, by region
D. Capital goods production and semiconductor sales growth
F. Global GDP and trade growth
Source: Baker, Bloom, and Davis (2016); CPB Netherlands Bureau for Economic Policy Analysis; Haver Analytics; Institute of Shipping Economics and Logistics; Semiconductor Industry Association; World Bank.
A.Data are 3-month moving averages. New export orders measured by Purchasing Managers’ Index (PMI). PMI readings above 50 indicate expansion in economic activity; readings below 50 indicate contraction. Last observation is March 2019 for goods trade and April 2019 for container shipping and new export orders.
B.Share of countries for which industrial production growth (3-month on 3-month change) was negative or below their 2012-17 average for two consecutive quarters. Sample includes 39 EMDEs and 29 advanced economies. Last observation is March 2019.
C.Import and export data are merchandise imports and exports in U.S. dollars, respectively, and is expressed as 3-month moving averages. “Asia” comprises Bangladesh, India, Indonesia, Japan, Malaysia, Mongolia, Pakistan, Philippines, Republic of Korea, Singapore, Sri Lanka, Thailand, and Vietnam. Last observation is March 2019 for Asia exports and April 2019 for China imports.
D.Capital goods index weighted by gross domestic product at constant 2010 U.S. dollars. Sample includes the G20 countries for capital goods for which data are available. Semiconductor index is 3- month moving averages of global billings by semiconductor equipment manufacturers, including frontend and final manufacturing equipment. Last observation is March 2019.
E.F. Aggregate growth rates calculated using constant 2010 U.S. dollar GDP weights. Shaded area indicates forecasts.
E.EAP = East Asia and Pacific, ECA = Europe and Central Asia, LAC = Latin America and the Caribbean, MNA = Middle East and North Africa, SAR = South Asia, and SSA = Sub-Saharan Africa.
F.Trade is the average of export and import volumes.
Click here to download data and charts.
It also assumes that policy actions partly mitigate domestic and external headwinds to activity (SCPRC 2019).
Global trends
Global trade has weakened amid slowing investment growth and elevated trade policy uncertainty. As the short-term growth outlook has softened, international financing conditions have eased, providing a respite to countries with large external financing needs. Industrial commodity prices have partially recovered, with weaker demand offset by supply cuts.
Global trade
Global industrial activity and goods trade have lost considerable momentum in 2019. Goods trade growth and new export orders fell to levels comparable to those prevailing at the start of 2016, when concerns about the global economy were elevated (Figure 1.7.A). The deceleration was broad-based—the share of countries with industrial production in technical recession has tripled since the start of 2018, reaching nearly 25 percent in early 2019 (Figure 1.7.B). Trade in Asia—which contains major, tightly interconnected, global manufacturing hubs—was particularly affected, although recent indicators suggest some stabilization (Figure 1.7.C).
Weakness in global trade was concentrated in heavily traded capital goods, including electronic components such as semiconductors (Figure 1.7.D). These products are deeply embedded in international production networks and illustrate the links between global investment and trade (Bussière et al. 2013; Buelens and Tirpák 2017). Increased tariffs by the United States and retaliatory actions by China and other trading partners that were implemented last year have affected bilateral trade flows and prices of the targeted products; however, they resulted in limited effects on aggregate trade volumes and activity in these countries (Constantinescu, Mattoo, and Ruta 2019; Fajgelbaum et al. 2019). Nevertheless, the increase in tariffs by the United States and China that were announced in May represents a substantial re-escalation in trade tensions and are likely to have more severe effects. Beyond economic losses for the affected exporters,