

Figure 2-3: Typical max station (Jerry’s Nugget South)

Figure 2-4: Lake Mead station with max ticket vending machine

Figure 2-5: Las Vegas Downtown Transportation Center
2.4 Vehicles
The CIVIS vehicles represent the key technology used to meet the project goals and to define the MAX brand; thus they are a major component of the capital cost of the project. The procurement, use, and management of CIVIS vehicles and related technology also contribute significantly to RTC’s lessons for future BRT systems implementation. The CIVIS vehicle has special features, which individually and collectively contribute to system operation, passenger satisfaction, and brand image. These features include:
-
a diesel-electric propulsion system intended to provide smoother acceleration;
-
a center drive position for improved maneuverability;
-
22-year running life (compared to 12 years for standard buses);
-
a carrying capacity of 120 passengers;
-
continuous low-floor access;
-
four wide doorways, and
-
onboard bike racks.

Figure 2-6: MAX CIVIS vehicle exterior

Figure 2-7: Center Drive Position

Figure 2-8a: MAX bus position with automatic docking

Figure 2-8b: MAX bus position at station using manual docking

Figure 2-9: Onboard Bike Rack
2.5 Fare Collection
The fare structure on MAX is the same as the rest of the CAT system. Monthly passes are valid for both classes of service. Unlike other CAT routes, however, MAX uses off-board, “proof of payment” fare collection, designed to reduce station dwell time and increase vehicle speed and reliability. The off-board fare collection system requires passengers who are not carrying a monthly pass to purchase tickets before boarding the vehicle from ticket vending machines located at each station, at the Downtown Transit Center, and in several off-route locations. Inspectors conduct periodic checks for proof of payment, which can be either a validated ticket or a pass. MAX is currently one of only two bus routes in the USA using proof-of-payment fare collection.2

Figure 2-10: Ticket Vending Machine
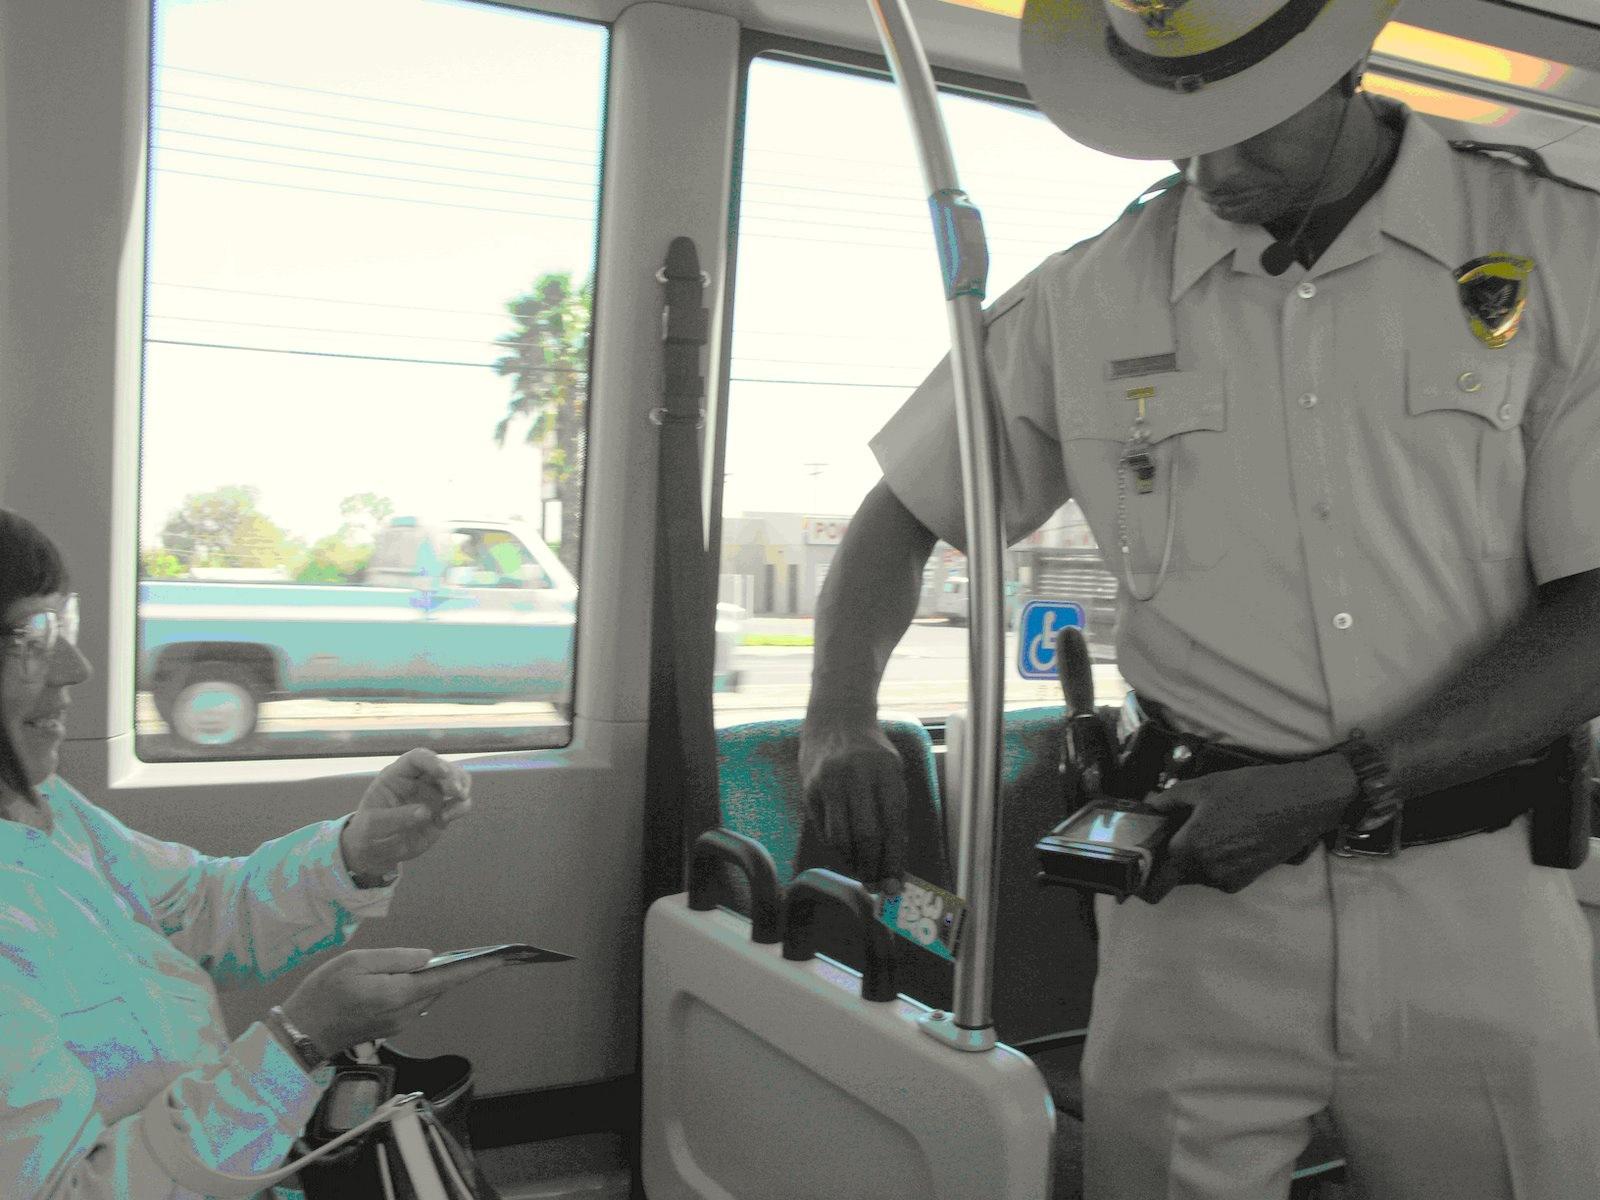
Figure 2-11: Uniformed security officer checking for fare proof of payment using Personal Digital Assistant
2.6 Intelligent Transportation Systems (its)
The MAX system also includes several Intelligent Transportation Systems (ITS) designed to ensure reliable operations and maintain a high quality of service as scheduled. Specific ITS elements include:
-
Traffic Signal Priority (TSP), which seeks to reduce signal delay for transit vehicles, was implemented at 11 intersections along Las Vegas Boulevard North and one queue jumper priority treatment.
-
A precision docking optical guidance system (OGS) intended to guide the vehicle into a precise docking at station platforms;
-
Automated passenger counter (APC) sensors and Computer Aided Dispatch/Automated Vehicle Location (CAD/AVL) communications system designed to electronically communicate passenger boardings and vehicle locations;
-
On-board electronic passenger information display.
The operation of these features is discussed in Chapter 4.