

5.5 Capacity
The CIVIS vehicle has a maximum capacity of 120 passengers, including standees. The MAX LVBN service operates at a maximum frequency of 5 trips per hour (12 minute headway). Thus the maximum number of passengers per hour per direction is 600 (5 x 120). Given the current vehicle supply of 10 vehicles, frequency could be increased to 6 trips per hour (10 minute headway). This would increase capacity to 720 passengers per hour per direction.
6.0 SYSTEM BENEFITS
The primary benefits associated with implementation of BRT are identified in the Characteristics of BRT documents as follows:
-
Higher Ridership
-
Cost Effectiveness
-
Operating Efficiency
-
Community Benefits
-
Transit Supportive Land Development
-
Environmental Quality
This section of our evaluation examines each of these potential benefits as they relate to the implementation of the MAX BRT.
6.1 Ridership
Change in Riders
Ridership on MAX increased steadily from the start of service in July 2004 to January 2006, and was level through July 2006 (see Figure 6-1). Total corridor ridership grew from about 7,000 boardings per day in May 2004 to a high of 10,000 in January 2006. RTC believes that problems with the Automatic Passenger Counting system led to undercounting of ridership following January 2006. The reported figures show average daily ridership in the corridor of 9,600 to 9,800 between February and July 2006, except for March, which showed an unusual drop in MAX ridership that is almost certainly due to an error in the counting system.
The share of the transit market in the Las Vegas Blvd. North corridor that was using MAX increased from 21% in the first month of operation to a high of 65% in April 2006, and has remained roughly constant since (see Figure 6-2). Most of the gain in market share happened within the first year of operation.
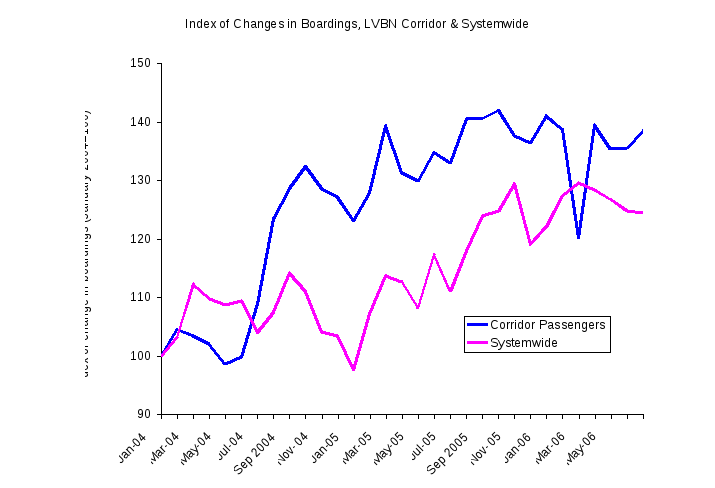
How does the gain in the LVBN corridor compare to changes in ridership in the CAT system? We compared average daily boardings, converted to an index with January 2004 equal to 100 (Figure 6-3). As of July 2006, more than two years after the start of MAX service, system ridership had increased 24% and LVBN corridor ridership had increased 38%. (Note that the March 2006 data appear to be incorrect, as explained above.) Most of the faster growth in corridor ridership compared to CAT occurred between June and October 2004—the first few months of MAX service.
Figure 6-1: Average Boardings per Day, max and 113, January 2004 to July 2006

Figure 6-2: MAX share of Las Vegas Blvd. North Public Transit Market

x
Figure 6-3: Index of Changes in Boardings, lvbn Corridor and Systemwide
Source of New Riders
Some MAX riders were previously using Route 113, but others were newly making the trip by transit. Passenger surveys in April 2005 and October 2005 provide data on how passengers previously made the trip (see Table 6-1 and Figure 6-4).
Table 6-1: Previous mode of max riders
|
|
April 2005 |
October 2005 |
||
|
Response |
Frequency |
Percentage |
Frequency |
Percentage |
|
Drove myself |
21 |
9.3% |
25 |
11.1% |
|
Got a ride from someone |
6 |
2.7% |
7 |
3.1% |
|
Bicycle |
1 |
0.4% |
7 |
3.1% |
|
Walked |
13 |
5.8% |
12 |
5.3% |
|
Paratransit |
1 |
0.4% |
3 |
1.3% |
|
Didn’t make trip |
12 |
5.3% |
14 |
6.2% |
|
CAT bus route 113 |
165 |
73.3% |
151 |
67.1% |
|
Other CAT bus route |
6 |
2.7% |
4 |
1.8% |
|
No answer |
0 |
0.0% |
2 |
0.9% |
|
Total |
225 |
100.0% |
225 |
100.0% |