

Учебники / Head_and_Neck_Cancer_Imaging
.pdfImaging Techniques |
35 |
to be paused while changing the gantry angle. If one uses an MDCT machine, allowing a rapid entire neck examination without gantry angulation, the scan should be started only after injection of the entire contrast volume (i.e. after 100 s). A subsequent saline injection at the same injection rate is recommended.
3.4.1.3
Data Acquisition and Image Reconstruction
3.4.1.3.1
General Comments
On a lateral scout view, the area of interest is indicated. For a routine head and neck imaging study, images are acquired from the top of the sphenoid sinus to the lower border of the sternoclavicular joints. It makes sense to scan from cranial to caudal: this allows the contrast medium concentration in the subclavian vein, at the side of injection, to drop to a similar or only slightly higher level compared to other neck vessels, reducing artifacts at the level of the thoracic inlet.
When performing a routine study of the face, sinonasal region or skull base, images are acquired from the top of the frontal sinus to the submental region.
The field of view (FOV) must be as small as possible, to optimize spatial resolution. The recommended FOV for neck studies varies between 16 and 20 cm, depending on the size of the patient. The selected FOV also depends on the type of pathology: in a study performed for squamous cell cancer, the posterior part of the perivertebral space not necessarily needs to be included in the FOV as it is unlikely to encounter pathology in that region; however, for example in skin cancer and lymphoma, this part of the neck should also be visualized, as (sub)occipital adenopathies may be present.
The optimal display slice thickness for evaluation of neck structures is 3 mm; adjacent slices should be obtained. Somewhat thinner slices (2 mm) are apt for the evaluation of the facial bones, sinonasal cavities and orbits. In laryngeal and hypopharyngeal neoplasms, it is useful to reconstruct an additional series of images coned down to the laryngohypopharyngeal region, with a FOV of about 10 cm and a slice thickness of 2 mm. Also the evaluation of the temporal bone requires a coned down FOV (about 9 cm), and a thin slice thickness of 0.8–1 mm.
Image reconstruction is always done in a soft tissue algorithm. Additional images, reconstructed in a high resolution (bone detail) algorithm, are always
generated in sinonasal cavity, skull base and temporal bone studies.
3.4.1.3.2
Incremental CT and Single-Slice Spiral CT
Even in this era of MDCT, studies of acceptable quality can be obtained using an incremental or singleslice spiral CT technique. The disadvantage of these techniques is the compromise that has to be made between slice thickness and acquisition time.As these techniques do not allow obtaining very high quality reformattings from the native images, the gantry angle should be changed at the mouth level. From the skull base down to the oral cavity, the image plane should be parallel to the hard palate, while from the oral cavity down to the thoracic inlet, the image plane should be parallel to the vocal cords. The vocal cord plane sometimes can be recognized on the lateral scout views; if this can not be seen, the gantry should be tilted parallel to the intervertebral disk space at the level of C4–C5 or C5–C6. Adherence to this protocol generates images reproducibly showing head and neck anatomy; furthermore, dental filling artifacts are avoided at the level of the oral cavity.
The CT examination is performed as contiguous 3- mm thick scans, or as a spiral study reconstructed as contiguous 3-mm sections. The spiral technique uses 3-mm thick scans with a 3- to 5-mm/s table speed, and a pitch of 1:1–1:1.6; these parameters may vary slightly according to the CT machine.
3.4.3.1.3 Multidetector Spiral CT
State-of-the-art CT of the head and neck requires the use of MDCT. The rapid acquisition results in a volumetric data set, reconstructed to a stack of thin and overlapping native images; this reduces partial volume averaging and motion artifacts. Furthermore, full advantage of the injected contrast agent is accomplished by optimal timing between injection and image acquisition. The disadvantage of this technique is the overall higher radiation exposure.
The data acquisition with MDCT is usually done with zero gantry tilt. However, in some patients, this causes problems at the level of the oral cavity when dental fillings are present. Also, in patients with short necks or a high position of the shoulders, the image quality may be suboptimal at the level of the larynx due to artifacts arising from the shoulder girdle. To avoid these problems, some head and neck radiologists continue to use gantry tilting in MDCT, as de-

36 |
R. Hermans et al. |
scribed for the incremental and single slice spiral CT technique. Changing the gantry tilt increases the image study time, and makes it impossible to obtain reformatted images in the coronal or sagittal plane at the level of the oral cavity.
The native images can not routinely be used for display: the large amount of native images is difficult to handle, and the signal/noise level of these images is relatively low. Therefore, a new set of images needs to be reformatted from these native images for display. These images are routinely reformatted in the axial plane, mimicking the image display as is obtained in incremental or single slice spiral CT: for neck studies, adjacent 3-mm thick images are reformatted parallel to the hard palate from the skull base to the oral cavity, and parallel to the vocal cords from the oral cavity to the thoracic inlet (Fig. 3.4). Reformatting in other planes and/or with a thinner slice thickness is done according to the organ of interest (see above) and/or the findings on the axial images (Fig. 3.5).
More technical details on the MDCT parameters used currently in the University Hospitals of Leuven are summarized in Tables 3.1 and 3.2.
a
b
Fig. 3.5a,b. a Axial MDCT image (3-mm thick) shows lymph node on right side, appearing centrally hypodense (arrowhead): central necrosis or partial volume averaging of fatty nodal hilum? b Additionally, a thinner (1.5-mm) reformatting was made through this lymph node in the coronal plane. On this section, the hypodense nodal region shows fat density and communicates with the outer nodal border: fatty metaplasia in nodal hilum. Normal lymph node
Fig. 3.4. Routine head and neck CT study. Midline sagittally reformatted image from native axial MDCT images. The data acquisition extended from just above the sphenoid sinus to the thoracic inlet. From the native images, two sets of axial images are routinely reformatted for display: the first set (1), parallel to the hard palate, from the skull base to the lower margin of the mandible; the second set (2), parallel to the vocal cords (or C4–C5/C5–C6 intervertebral space), from the oral cavity to the thoracic cavity. The two image sets should be overlapping
3.4.1.4
Dynamic Maneuvers
The data acquisition is routinely performed while the patient continues breathing. Dynamic maneuvers during scanning can improve the visualization of particular anatomic structures. During prolonged phonation of [i], arytenoid mobility can be judged

Imaging Techniques |
|
|
|
37 |
|
Table 3.1. MDCT data acquisition and native image reconstruction parameters |
|
|
|||
|
|
|
|
|
|
|
|
4-Row |
16-Row |
64-Row |
|
|
|
|
|
|
|
|
Collimation |
4×1 mm |
16×0.75 mm |
64×0.6 mm |
|
|
Feed/rotation |
4 mm |
9.9 mm |
34.5 mm |
|
Necka |
Rotation time |
0.75 s |
1 s |
1 s |
|
Faceb |
KV |
120 |
120 |
120 |
|
Sinonasal cavitiesb |
mAseff |
200c |
250c |
250c |
|
|
Sliceeff |
2 mm |
1.5 mm |
1.5 mm |
|
|
Slice interval |
1 mm |
0.7 mm |
0.7 mm |
|
|
|
|
|
|
|
|
Collimation |
2×0.5 mm |
2×0.6 mm |
12×0.6 mm |
|
|
Feed/rotation |
0.8 mm |
1.2 mm |
3.2 mm |
|
Temporal boneb |
Rotation time |
1 s |
1 s |
1 s |
|
Skull baseb |
KV |
120 |
120 |
120 |
|
|
mAseff |
180c |
220c |
350c |
|
|
Sliceeff |
0.5 mm |
0.6 mm |
0.6 mm |
|
|
Slice interval |
0.2 mm |
0.2 mm |
0.2 mm |
|
|
|
|
|
|
|
mAseff, effective mAs; sliceeff, effective slice thickness aSoft tissue algorithm
bBoth soft tissue and bone detail algorithm in tumoral pathology
cEffectively used mAs may be lower (determined by automatic exposure control system)
Table 3.2. MDCT image reformatting for display
|
Slice thickness |
Slice interval |
Image plane |
|
|
|
|
Neck |
3 mm |
3 mm |
Axial (coronal + |
|
|
|
sagittal if needed) |
Face, sinonasal cavities, |
2 mm |
4 mm |
Axial + coronal |
skull base (soft tissue detail) |
|
(2 mm for skull base) |
(sagittal if needed) |
Temporal bone, |
0.8 mm |
1 |
Axial + coronal |
skull base (bone detail) |
|
|
(sagittal if needed) |
|
|
|
|
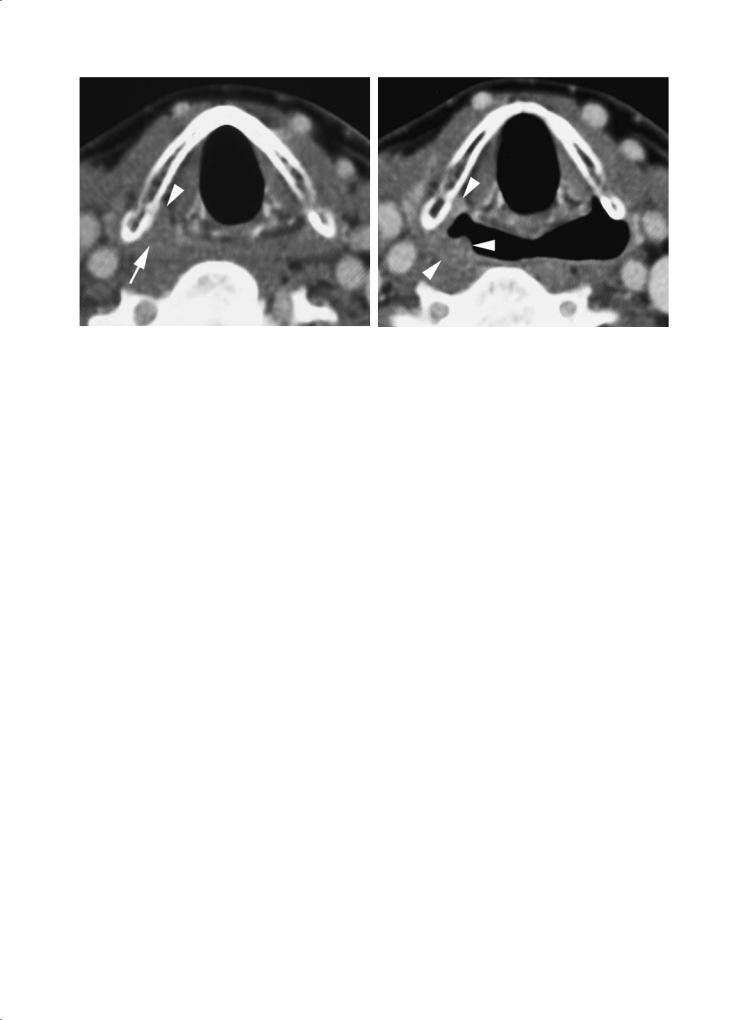
and a better visualization of the laryngeal ventricle can be achieved; the slight distention of the pyriform sinuses may also allow better delineation of the aryepiglottic folds (Lell et al. 2004). A modified Valsalva maneuver (blowing air against closed lips, puffing out the cheeks) produces substantial dilatation of the hypopharynx, allowing better visualization of the pyriform sinuses, including the postcricoid region (Robert et al. 1993) (Fig. 3.6). This modified Valsalva maneuver may also be of use in the evaluation of oral cavity tumors, as the inner cheek walls and gingivobuccal sulci become better visible.
The success rate of these dynamic maneuvers is variable, especially when an incremental CT technique is used, and is strongly dependent on patient cooperation. These problems are largely overcome by spiral CT and MDCT, as the patient has to perform the maneuver only once during one rapid acquisition.
Dynamic maneuvers are mainly helpful in showing superficial tumor spread, while the purpose
of imaging is describing deep tumor extent. Also, abnormal mobility of the vocal cord is more accurately seen during clinical examination than on dynamic imaging studies. Therefore, the added value of acquiring images during a dynamic maneuver in staging head and neck neoplasms is, on average, limited.
3.4.1.5
Three-Dimensional Image Reformatting
Three-dimensional (3D) display of the data set is most often done to evaluate the bony structures of the maxillofacial skeleton in congenital abnormalities or traumatic lesions. Meaningful 3D display of the often subtle osteolytic changes seen in head and neck malignancies is rarely possible. However, in some cases of extensive bone destruction, 3D displays are helpful for the surgeon in planning bone resection (Fig. 3.7).
38 |
R. Hermans et al. |
a |
b |
Fig. 3.6a,b. Contrast-enhanced single-slice spiral CT images in a patient suffering cancer of the pyriform sinus. a Axial image during quiet breathing shows subtle soft tissue thickening in the apex of the right pyriform sinus (arrow); some evidence of subtle infiltration or displacement of the paraglottic space fat is present (arrowhead). b Axial image obtained during modified Valsalva maneuver. The right pyriform sinus expands somewhat less than the opposite one; the mucosal irregularity produced by the cancer is now better visible (arrowheads)
a 
 b
b
Fig. 3.7a,b. a Axial contrast-enhanced MDCT image. Large floor of the mouth cancer, massively invading the right side of the mandible (arrows). Several small but inhomogenously enhancing adenopathies are visible on both sides of the neck (arrowheads). b Extent of mandibular bone destruction can easily be appreciated on 3D reformatting
Virtual endoscopy of the larynx and hypopharynx hasbeenstudied;otolaryngologistsranksuch3Dimages as more beneficial than radiologists, usually in bulky masses that precluded definitive direct endoscopic evaluation (Silverman et al. 1995). This technique does not show the adjacent soft tissues, and its clinical role is not exactly defined (Magnano et al. 2005).
3.4.2
Magnetic Resonance Imaging
MRI of the head and neck can be performed on lowfield or high-field machines. At comparable measuring time, the high-field (≥ 1T) machines provide a better signal-to-noise ratio and a higher spatial

Imaging Techniques |
39 |
resolution. Currently, the experience on 3T systems regarding the investigation of head and neck tumors is limited.
3.4.2.1
Patient Positioning
Similar to CT, image acquisition is performed with the patient in supine position, and during quiet respiration. The head and neck should be aligned and symmetrically positioned. Every effort should be made to make the patient feel as comfortable as possible. The patient should be instructed not to move during the examination, and to try not to swallow or cough during the image acquisition.
3.4.2.2 Coils
The choice of the receiver coil is dictated by the localization of the disease process. If the tumor is localized in the oral cavity or infrahyoid part of the neck, the neck coil should be used. When the patient suffers neoplastic disease at the level of the skull base, sinonasal cavities, face, parotid glands, or nasopharynx, the head coil should be selected.
A disadvantage of using the head coil is that the neck lymph node regions are only partly covered; this is of particular importance in nasopharyngeal cancer, commonly associated with neck adenopathies throughout the neck. On modern MR machines, the head and neck coil can be combined, allowing comprehensive evaluation of the entire head and neck region. Alternatively, in the absence of a dedicated neck coil, one can opt to stage the primary tumor with MR, using the head coil, and perform an additional CT or neck ultrasound study to stage neck disease.
A possible drawback of using the combination of head and neck coils is that both coils have a distinctive coil design, inducing inhomogeneous recipient field characteristics at the crossover between the two coils, which translates into local signal loss, distortion and heterogeneous incomplete fat saturation. This drawback can be partially overcome by meticulous shimming, coil and patient position and the use of sequences with short echo-trains. The latest MR systems are equipped with large arrays of identical receiver coil elements, positioned in a homogeneous pattern on the patient, providing full receiver coil coverage with a homogeneous high signal to noise ratio and minimizing artifacts due to differential coil design.
3.4.2.3
Standard Sequences
After obtaining scout images, a standard examination of the head and neck should start with a T2-weighted turbo spin echo (TSE) sequence. Compared to a conventional T2-weighted spin echo (SE) sequence, a TSE sequence takes less time to perform, reducing motion artifacts and improving image quality. The high signal intensity of fat on a T2-weighted TSE sequence can be a disadvantage, as this may reduce the contrast between a tumor and the surrounding tissues. The contrast can be improved by performing the sequence with either a chemical shift-moderated fat suppression technique (chemical shift-selective fat suppression or water-selective excitation) or by applying an additional inversion recovery preparation pulse with a short inversion time (SPIR, SPAIR, STIR).
The high signal intensity of fat and bone marrow on a plain T1-weighted SE or TSE sequence is often very helpful to determine tumor extent, as it contrasts clearly with the low signal intensity of most tumors. Repetition of this sequence after injection of gado- linium-DTPA, and comparison with the pre-injection sequence, makes it possible to determine the areas of contrast enhancement and to differentiate these areas from fat.
A fat-saturated T1-weighted SE sequence after injection of gadolinium-DTPA may be helpful, as the contrast between enhancing tissue and fat is increased. However, such a sequence has a number of disadvantages. A fat-suppressed sequence is prone to susceptibility artifacts, commonly observed in the head and neck region because of the presence of numerous soft tissue-bone and tissue-air interfaces. Also, the conspicuity of anatomical structures is reduced, and the acquisition time is prolonged.
Depending on the investigated region, a slice thickness of 3–4 mm is optimal, with an interslice gap of 0%–50%.The FOV is similar to what is described above for CT. The imaging matrix should be at least 256×256; for lesions in and around the skull base and sinonasal cavities, a matrix of 512×512 should be used.
The plane of section is chosen according to the localization of the disease process. For most neck lesions, it is appropriate to start with a T2and T1weighted sequence in the axial plane, and to continue with a gadolinium-enhanced axial, coronal and sagittal T1-weighted sequence. In general, the axial plane should be, similar as for CT, parallel with the hard palate when dealing with suprahyoid pathology, and parallel with the vocal cords when dealing with infrahyoid pathology. In naso-ethmoidal neoplasms, it may

40 |
R. Hermans et al. |
be more useful to start the study with a coronal T2and T1-weighted sequence, in order to better evaluate potential spread to the anterior cranial fossa.
The use of very fast imaging such as single-shot techniques is not recommended in all but the newest systems. Single-shot techniques have in general a low signal to noise ratio and are very sensitive to magnetic field inhomogeneities (susceptibility effects), which are the two most persistent difficulties in head and neck MRI.When such sequences are used, patient positioning and shimming should be performed with the utmost precision. If patient movement is within limits, a segmented approach, probing the entire k- space into several separate acquisitions and thereby reducing the echo-train length, is preferable to minimize the above mentioned drawbacks. The use of parallel imaging grants the benefit of a reduced scan time with the same image quality, or a ‘normal’ scan time but with a better image quality. In practice this means that patient movement artifacts can be reduced and signal-to-noise ratio increased, making parallel imaging an ideal addition to head and neck MR imaging. However, as the parallel imaging reconstruction algorithm is very prone to both magnetic field and receiver coil homogeneity, a combined use of dedicated head and neck coils (see above) limits the application of parallel imaging. When using the newest systems with a large number of homogeneous receiver coils (see above), application of parallel imaging may allow comprehensive evaluation of the head and neck area.
3.4.2.4 Contrast Agents
In MR studies for head and neck neoplasms, obtaining sequences before and after injection of gado- linium-DTPA (at a dose of 0.1–0.2 mmol/kg body weight) is mandatory. Most neoplasms will show increased signal intensity after contrast agent injection. This will usually increase the contrast between the tumor and the surrounding lesions. However, tumors infiltrating bone marrow may become less well visible after contrast injection, as their signal intensity may become similar to that of the surrounding bone marrow; this problem can be solved by obtaining a fat-suppressed sequence (see above). Tumor necrosis becomes better visible after injection of gadolinium; this is of particular importance in staging the neck nodes (see Chap. 15).
Ultra-small superparamagnetic iron oxide (USPIO) particles are captured by macrophages in normally functioning lymph nodes. As a result,
signal intensity reduction is observed in tissues accumulating these particles, because of the susceptibility effects of iron oxide. Metastatic lymph nodes show a hyperintensity on sequences weighted to these effects. Promising results have been obtained in the head and neck, but technical problems regarding motion, susceptibility artifacts and spatial resolution still need to be solved (Sigal et al. 2002).
3.4.2.5
Additional MRI Techniques
MRI is a very flexible imaging modality, and tailoring the study to the particular needs in the individual patient is possible. Although in most cases the standard sequences solve the diagnostic questions, in some instances additional sequences can further characterize pathological tissues or further refine the anatomical details visible on the study. Without aiming to be exhaustive, a number of possible additional MRI techniques are shortly described below.
Diffusion-weighted (DW) MRI is an imaging technique showing molecular diffusion, corresponding to the Brownian motion of the spins in biologic tissues. The apparent diffusion coefficient (ADC) is a parameter used to quantify DW-MRI. The ADC is in part determined by the molecular diffusion of water, the microcirculation of blood and the presence of structures on a microscopic scale (microvessels, tubuli, and others) (Le Bihan et al. 1988). Cell size, cell density and cell integrity influence the signal intensity seen on DW images, as well as the value of the ADC. The technique is promising to distinguish non-invasively different entities, such as benign and malignant tumor (Fig. 3.8) (Wang et al. 2001).
Volumetric interpolated breath-hold imaging (VIBE) is a 3D fat-saturated gradient-echo T1weighted sequence that can be optimized for short acquisition times, providing high-quality MR angiograms if acquisition and contrast injection are properly synchronized. It can also be used to evaluate tumor perfusion, or as an alternative to T1-weighted SE sequences, as it combines excellent image contrast with minimal partial volume averaging (Farina and
Borghesi 2005).
Heavily T2-weighted thin images are helpful for the visualization of the cisternal part of the cranial nerves; this can be achieved with gradient-echo or TSE sequences (Yousry et al. 2000). These sequences provide high-resolution anatomical images of the cranial nerves; however, involvement of the nerves by neoplasms is often best detected on gadoliniumenhanced images.

Imaging Techniques |
41 |
c
a
d
b
Fig. 3.8a–e. Patient suffering floor of the mouth cancer. a
Sagittal contrast-enhanced MDCT image shows primary tu- |
|
mor at the junction of the floor of the mouth and oral tongue |
|
(arrowheads). b Axial MDCT image. Slightly enlarged lymph |
|
node (minimal axial diameter 12 mm) in the submandibular |
|
region (arrow): suspect for metastatic adenopathy. c–e Axial |
|
diffusion-weighted MR images. Compared to the b=0 image |
|
(c), the signal clearly reduced in the adenopathy (arrow) on |
|
the b=1000 image (d), indicating easy diffusion of water pro- |
|
tons. The ADC map (e) shows a relatively high signal (ADC > |
|
0.00130 mm2/s). These findings are consistent with a benign |
|
adenopathy. After neck dissection, histologically no tumor |
|
was found in this lymph node |
e |

42
3.5
Nuclear Imaging
Nuclear imaging techniques, such as single photon emission computed tomography (SPECT) and positron emission tomography (PET), are increasingly being used in the evaluation of advanced head and neck cancer. Particularly PET and PET-CT, using flu- orine-18-labeled 2-fluoro-2-deoxy-D-glucose (FDG) as tracer, have received a lot of attention in recent years.
PET can be used in the pretreatment staging process, during radiotherapy planning (see Chap. 18), and in the posttreatment work-up. Overall, PET has a higher sensitivity for detecting tumor compared to CT and MRI. However, this is achieved at a relatively low specificity. Physiological tracer uptake, e.g. in the thyroid gland, lymphoid tissue, salivary glands and in active muscles may cause confusion; tracer accumulation in inflammation, such as observed in therapyinduced tissue changes, may also cause false-positive results. Other pitfalls of PET imaging are the low spatial resolution, and the lack of tracer uptake in some neoplasms, causing false-negative results. The high cost of PET imaging is an important drawback.
A detailed description of the technical background and possibilities of nuclear imaging techniques is beyond the scope of this chapter. Detailed information on PET imaging in head and neck cancer is provided in Chap. 17.
References
Curtin HD, Ishwaran H, Mancuso AA et al (1998) Comparison of CT and MR imaging in staging of neck metastases. Radiology 207:123–130
Farina D, Borghesi A (2005) Techniques of radiological exami-
R. Hermans et al.
nation. In: Maroldi R, Nicolai P (eds) Imaging in treatment planning for sinonasal diseases. Springer, Berlin, p 5
Keberle M, Tschammler A, Hahn D (2002) Single-bolus technique for spiral CT of laryngopharyngeal squamous cell carcinoma: comparison of different contrast material volumes, flow rates, and start delays. Radiology 224:171–176
Le Bihan D, Breton E, Lallemand D, Aubin ML, Vignaud J, Laval-Jeantet M (1988) Separation of diffusion and perfusion in intravoxel incoherent motion MR imaging. Radiology 168:497–505
Lell MM,Greess H,Hothorn T,Janka R,Bautz WA,Baum U (2004) Multiplanar functional imaging of the larynx and hypopharynx with multislice spiral CT. Eur Radiol 14:2198–2205
Magnano M, Bongioannini G, Cirillo S et al (2005) Virtual endoscopy of laryngeal carcinoma: is it useful? Otolaryngol Head Neck Surg 13:776–782
Robert YH, Chevalier D, Rocourt NL et al (1993) Dynamic maneuver acquired with spiral CT in laryngeal disease. Radiology 189:298–299
Sigal R, Vogl T, Casselman J et al (2002) Lymph node metastases from head and neck squamous cell carcinoma: MR imaging with ultrasmall superparamagnetic iron oxide particles (Sinerem MR) – results of a phase-III multicenter clinical trial. Eur Radiol 12:1104–1113
Silverman PM, Zeiberg AS, Sessions RB, Troost TR, Zeman RK (1995) Three-dimensional imaging of the hypopharynx and larynx by means of helical (spiral) computed tomography. Comparison of radiological and otolaryngological evaluation. Ann Otol Rhinol Laryngol 104:425–431
Takes RP, Knegt P, Manni JJ et al (1996) Regional metastasis in head and neck squamous cell carcinoma: revised value of US with US-guided FNAB. Radiology 198:819–823
Takes RP, Righi P, Meeuwis CA et al (1998) The value of ultrasound with ultrasound-guided fine-needle aspiration biopsy compared to computed tomography in the detection of regional metastases in the clinically negative neck. Int J Radiat Oncol Biol Phys 40:1027–1032
van den Brekel MW, Castelijns JA, Stel HV et al (1991) Occult metastatic neck disease: detection with US and US-guided fine-needle aspiration cytology. Radiology 180:457–461
Wang J, Takashima S, Takayama F et al (2001) Head and neck lesions: characterization with diffusion-weighted echoplanar MR imaging. Radiology 220:621–630
Yousry I, Camelio S, Schmid UD et al (2000) Visualization of cranial nerves I–XII: value of 3D CISS and T2-weighted FSE sequences. Eur Radiol 10:1061–1067

Laryngeal Neoplasms |
43 |
4Laryngeal Neoplasms
Robert Hermans
CONTENTS
4.1Introduction 43
4.2 |
Normal Laryngeal Anatomy 43 |
4.2.1Laryngeal Skeleton 43
4.2.2 |
Mucosal Layer and Deeper Laryngeal Spaces 45 |
|
4.2.3 |
Normal Radiological Anatomy 45 |
|
4.3 |
Squamous Cell Carcinoma |
46 |
4.3.1 |
General Imaging Findings |
48 |
4.3.2 |
Neoplastic Extension Patterns of Laryngeal Cancer 49 |
|
4.3.2.1Glottic Cancer 49
4.3.2.2Supraglottic Cancer 53
4.3.2.3Subglottic Cancer 56
4.4Prognostic Factors for Local Outcome of Laryngeal Cancer 57
4.4.1Treatment Options 57
4.4.1.1Glottic Cancer 57
4.4.1.2Supraglottic Cancer 58
4.4.2Impact of Imaging on Treatment Choice and Prognostic Accuracy 58
4.4.3Use of Imaging Parameters as Prognostic Factors
|
for Local Outcome Independently from the TN |
|
Classification 59 |
4.4.3.1 |
Predicting Local Outcome After Radiotherapy 59 |
4.4.3.2 |
Predicting Local Outcome After Surgery 62 |
4.4.3.3Towards Risk Profiles Incorporating Imaging Findings 63
4.5 |
Post-treatment Imaging in Laryngeal Cancer |
63 |
|
4.5.1 |
Expected Findings After Treatment 63 |
|
|
4.5.1.1 |
Expected Tissue Changes After Radiotherapy |
63 |
|
4.5.1.2 |
Expected Findings After Laryngeal Surgery |
64 |
|
4.5.2 |
Persistent or Recurrent Cancer |
68 |
|
4.5.2.1 |
Imaging Strategies and Findings |
68 |
|
4.5.2.2 |
Potential Value of Imaging Surveillance 70 |
|
|
4.5.3Treatment Complications 71
4.5.3.1 |
Complications After Surgery 71 |
|
4.5.3.2 |
Complications After Radiotherapy |
71 |
4.6 |
Non-squamous Cell Laryngeal Neoplasms 73 |
|
4.6.1 |
Minor Salivary Gland Neoplasms |
73 |
4.6.2Mesenchymal Malignancies 74
4.6.2.1 |
Chondrosarcoma 74 |
4.6.2.2 |
Other Mesenchymal Malignancies 74 |
4.6.3Hematopoietic Malignancies 75
4.6.3.1 |
Lymphoma 75 |
4.6.3.2 |
Plasma Cell Neoplasms 76 |
4.6.3.3Metastasis 77 References 77
R. Hermans, MD, PhD
Professor, Department of Radiology, University Hospitals
Leuven, Herestraat 49, 3000 Leuven, Belgium
4.1 Introduction
The larynx is one of the most frequent head and neck cancer sites. Nearly all laryngeal malignancies are squamous cell carcinomas. Cigarette smoking and excessive alcohol consumption are well-known risk factors. An important factor in the treatment planning of laryngeal neoplasms is the accuracy of pretherapeutic staging. As most laryngeal tumors are mucosal lesions, they can often be seen directly or indirectly, but the limitations of clinical and endoscopic tumor evaluation are well recognized. The clinical and radiological evaluation of laryngeal tumors are complementary; the combination of the obtained information will lead to the most accurate determination of tumor extent. Imaging may be used to monitor tumor response and to detect recurrent or persistent disease as early as possible.
4.2
Normal Laryngeal Anatomy
Essentially the larynx consists of a supporting skeleton, a mucosal surface, and in between a soft tissue layer containing fat, some ligaments and muscular structures (Figs. 4.1–4.4).
4.2.1
Laryngeal Skeleton
The laryngeal skeleton is made up of cartilage and fibrous bands. The foundation of the larynx is the cricoid cartilage. The cricoid cartilage is the only complete cartilaginous ring in the airway. Its horizontal ring-shaped part is known as the arch (arcus), while the higher posterior part is called the lamina. Two paired facets are found at the upper margin of the lamina, allowing articulation with the arytenoid cartilages.

44
Fig. 4.1. Lateral diagram of the larynx showing the cartilaginous skeleton (mucosa, intrinsic laryngeal muscles and paraglottic fat removed). The vocal ligament (single arrowhead) stretches from the vocal process of the arytenoid (A) to the anterior thyroid cartilage. The ventricular ligament (double arrowhead) runs from the upper arytenoid to the anterior thyroid cartilage. T, thyroid lamina; SC, superior cornu (of thyroid). The superior cornua are attached to the hyoid by the thyrohyoid ligament (unlabeled thick arrow), which forms the posterior margin of the thyrohyoid membrane. C, cricoid cartilage; E, epiglottis; H, hyoid bone. Note: The small structure at the upper tip of the arytenoid is the corniculate cartilage. It has no clinical significance, but is occasionally seen on CT. The small hole (unlabeled thin arrow) in the thyrohyoid membrane transmits the internal branch of the superior laryngeal nerve that provides sensation to the laryngeal mucosa
Fig. 4.3. Coronal diagram of the larynx showing the laryngeal subsites. 1, True vocal cord (TVC) consist mainly of the bellies of the thyroarytenoid muscle. 2, false vocal cord (FVC) consists mainly of fatty tissue. TVC and FVC are separated by the slitlike laryngeal ventricle (sinus of Morgagni), extending superolaterally as the sacculus laryngis or appendix. E, epiglottis; H, hyoid bone; T, thyroid cartilage; C, cricoid cartilage
R. Hermans
Fig. 4.2. Lateral diagram of the larynx sectioned sagittally in the midline. The slitlike ventricle separates true vocal cord (unlabeled arrow) and false vocal cord (large arrowhead). Small arrowheads, aryepiglottic fold; T, thyroid cartilage; C, cricoid cartilage (lamina); dashed line, projection of the arch of the cricoid cartilage; E: epiglottis; H, hyoid bone; V, vallecula
Fig. 4.4. Inner view of the larynx, seen from above, after removal of most soft tissues. A, arytenoid cartilage; C, cricoid lamina; T, thyroid cartilage. The bulk of the TVC is made up of the thyroarytenoid muscle (in dark) running from the inner aspect of the thyroid lamina to the arytenoid cartilage, paralleling the vocal ligament (large arrowhead). The thyroarytenoid muscle can be separated in two bellies. Only the medial portion (vocalis muscle) is seen on the right. The vocal ligament extends from the vocal process (small arrowhead) to the anterior commissure (unlabeled arrow)