

Учебники / Head_and_Neck_Cancer_Imaging
.pdfNeoplasms of the Hypopharynx and Proximal Esophagus |
85 |
Fig. 5.5. Axial contrast-enhanced CT image demonstrates the normal appearance of the common wall of the trachea and esophagus with a thin layer of fat (arrows) visualized between the trachea anteriorly and the esophagus posteriorly
Lipoand synovial sarcomas are the most commonly reported types of sarcomas involving the hypopharynx and cervical esophagus (Mouret 1999; Artico et al. 2004). Hypopharyngeal liposarcoma most commonly involves older males. Patients typically present with local symptoms and rarely with nodal or distant metastasis. The prognosis does not seem to be affected by the tumor size but rather by the grade of the tumor. Low grade liposarcomas are less locally aggressive but still show a high local recurrence rate and rarely metastasize. In contrast, high grade tumors show a much
more aggressive growth pattern and metastasize frequently. The imaging findings vary dependent upon the grade and differentiation of the tumor, with welldifferentiated low grade tumors almost resembling benign lipoma, while high grade undifferentiated tumors may be indistinguishable to squamous cell malignancies. Synovial hypopharyngeal sarcoma is the second most common sarcoma type involving the hypopharynx. Only 3% of the synovial sarcomas involve the head and neck region with the hypopharynx being most commonly involved (Rangheard et al. 2001). Typically, they affect young adults and adolescents. Although synovial sarcomas are often seen adjacent to joints they do not originate from synovial tissue but rather from pluripotential mesenchymal cells located near articular surfaces, tendons, tendon sheaths, juxta-articular membranes and facial aponeuroses. They are characterized by a reciprocal translocation between chromosomes X and 18 and are divided into a monophasic and biphasic form (Artico et al. 2004; Rangheard et al. 2001). The monophasic form is more common and is constituted of one cell type (epithelial or spindle cells), whereas the biphasic form is very rare and is composed of epithelial and spindle cells. As liposarcomas, they usually present with local symptoms and rarely with nodal or distant metastatic disease. On cross-sectional imaging studies, synovial sarcomas classically display a well-defined, multilocular mass with heterogeneous enhancement (Fig. 5.7) (Quint et al. 1985). No significant imaging differences have been reported between the monoand biphasic form. The tumor size primaily influences patient’s
a 
 b
b
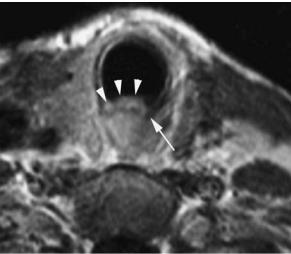
Fig. 5.6a,b. Axial non-enhanced T1- (a) and gradient echo T2-weighted (b) images illustrate the dependency of visibility on the thin layer of fat within the common wall of the trachea and esophagus (arrows), with this fat plane more completely visible on the gradient echo T2 image (arrows in b)
86 |
I. M. Schmalfuss |
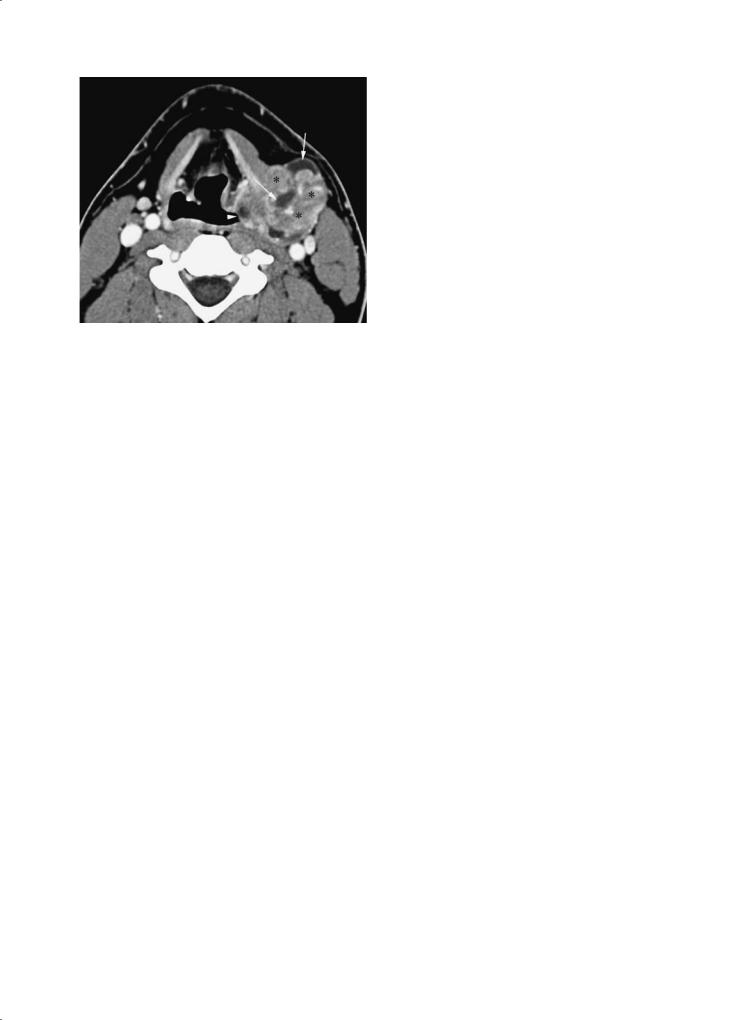
Fig. 5.7. Axial contrast-enhanced CT image through the upper thyroid cartilage level shows a large mass arising from the lateral wall of the pyriform sinus on the left (arrowhead) with gross extension into the lateral compartment of the neck. This mass has heterogeneous density with solid (asterisks) and cystic (arrows) portions that is characteristic for synovial sarcoma but not typically seen with squamous cell carcinoma
prognosis. Presence of calcifications is also a favorable prognostic factor (Hirsch et al. 1997; Bukachevsky et al. 1992; Mamelle et al. 1986). Wide excision with post-operative radiation therapy is currently considered the optimal treatment of the different sarcoma types.
Lymphoma involving the hypopharynx and cervical esophagus is extremely rare (Miyazaki et al. 2004; Kitamoto et al. 2003). Mucosa-associated lymphoid tissue (MALT) lymphoma – a non-Hodgkin lymphoma – is the most commonly reported subtype of lymphoma in those regions. None of the published case reports refers to cross-sectional imaging findings; however, the reported cases describe a smooth-surfaced, submucosal mass rather than a mucosal lesion as suggested by its name (Miyazaki et al. 2004; Kitamoto et al. 2003). MALT lymphoma of other regions have been described to show increased signal intensity on T2, decreased attenuation on T1-weighted images and strong, rapid enhancement following intravenous contrast administration (Takahara et al. 2005; Espinosa et al. 2005). Therefore, MALT lymphoma should be considered in the differential diagnosis if such MR imaging findings are seen in a patient with a submucosal lesion of the hypopharynx and/or cervical esophagus.
Salivary gland malignancies are also rare in the hypopharynx and cervical esophagus. Mucoepidermoid and adenoid cystic carcinomas are the most commonly
reported subtypes (Matsuki et al. 1999; De Campora et al. 1987; Tom et al. 1981).Adenoid cystic tumors typically arise in salivary gland tissue and minor salivary glands; however, some authors also suggested their origin in common mucosal glands.When arising in common mucosal glands, as this would be the case in the hypopharynx and cervical esophagus, adenoid cystic carcinomas have been shown to be particular malignant with a high incidence of local recurrence and distant metastatic disease. The cross-sectional imaging findings of adenoid cystic carcinoma arising from the salivary gland tissue or minor salivary glands have been reported; however, it is uncertain if the more aggressive subtype of adenoid cystic carcinoma arising from the common mucosal glands follows the same imaging characteristics. Mucoepidermoid carcinoma is composed of signet-ring and squamous cells. None of the published cases mentions the cross-sectional imaging findings of mucoepidermoid carcinoma of the hypopharynx and/cervical esophagus; however, as these tumors range between low and high grade malignancies their imaging features would be expected to range from a well defined lesion to an aggressive, locally advanced malignancy. The prognosis is also variable and certainly depends upon the grade of the tumor; however, there seems to be also a difference by location with a reported overall 5-year survival rate of 77% for the hypopharyngeal mucoepidermoid carcinoma and 0% 2-year survival rate for the esophagus (Matsuki et al. 1999; Damiani et al. 1981).
5.3.2
Squamous Cell Malignancies
5.3.2.1
Risk Factors
Chronic tobacco and alcohol abuse represent the main risk factors. Therefore, older males are most commonly involved by this type of tumor, with slowly increasing incidence in females as tobacco use in females is still on the rise. Postcricoid area cancers, however, represent an exception. They occur most commonly in females and are associated with Plummer–Vinson syndrome that is rarely seen in the US or continental Europe, but more commonly encountered in the UK (Zbären and Egger 1997). Postcricoid region hypopharyngeal tumors are hypothesized to be caused by food stasis resulting from hypopharyngeal or esophageal webs as seen with Plummer–Vinson syndrome. In addition, these patients present with iron deficiency anemia.

Neoplasms of the Hypopharynx and Proximal Esophagus |
87 |
5.3.2.2
Clinical Presentation
Most commonly patients with hypopharyngeal and/ or cervical esophageal cancer present with a neck mass, secondary to metastatic nodal involvement, and/or dysphagia, odynophagia, globus sensation and otalgia. Weight loss and a characteristic change in voice to a “hot potato” voice can also be seen. Typically, these cancers present at a locally advanced stage; they also have a high tendency to metastasize to the draining nodal chains early on. Therefore, it is not surprising that up to 75% of patients have nodal metastatic disease at presentation. In addition, elective dissection in patients with clinically N0 neck have shown a high incidence of occult nodal metastasis with a frequency of 30%. Between 20% and 40% of patients also have distant metastasis at the time of presentation (Million 1994; Kraus et al. 1997).
5.3.2.3
Growth Pattern
Hypopharyngeal malignancies like to spread in submucosal fashion that is often undetectable on clinical and/or endoscopic examination (Million 1994; Saleh et al. 1993). Nevertheless, the different subtypes of hypopharyngeal malignancies show distinct grows patterns, as described below.
Postcricoid region cancers like to invade the posterior aspect of the larynx, causing vocal cord paralysis and hoarseness. The cricoarytenoid joint itself is usually not involved. In addition, these tumors have a high propensity to grow posterolateral to involve the pyriform sinuses (100%) and inferiorly to involve the trachea (71%) and/or cervical esophagus (71%) (Aspestrand et al. 1990). Tracheal or esophageal invasion is not detectable by endoscopic evaluation in half of the patients.
The growth pattern of pyriform sinus cancers depends on their site of origin or involvement. Tumors arising from or infiltrating the lateral wall of the pyriform sinus like to invade the posterior aspect of the thyroid cartilage, extend into the soft tissues of the lateral compartment of the neck, and the paraglottic space of the true vocal cord (Fig. 5.8) (Zbären and Egger 1997). Direct infiltration of the intrinsic laryngeal muscles is rarely seen. In contrast, tumors arising from or infiltrating the medial wall of the pyriform sinuses show early laryngeal invasion and vocal cord fixation in 60% of the patients (Figs. 5.9 and 5.10) (Becker 1998; Zbären and Egger 1997; Nowak et al. 1999). They also have a high propensity
for contralateral tumor extension with 87%, higher frequency of submucosal tumor spread than the other tumor subtypes with 56%, and perineural tumor invasion in almost 45% of patients (Figs. 5.9 and 5.10) (Zbären and Egger 1997).
Posterior hypopharyngeal wall cancers like to grow in craniocaudal direction with potential extension from the nasopharynx all the way to the esophagus (Nowak et al. 1999). As the craniocaudal extension of these tumors may solely be superficial, the full extent of the tumor may not be detectable on cross-sectional examination; therefore, correlation with clinical findings is critical for staging and treatment planning purposes. Rarely, these tumors cause infiltration of the prevertebral fascia or musculature at the time of presentation. Even when there is obliteration of the prevertebral fat planes on CT and/or MR studies, the diagnosis of prevertebral fascia or muscle invasion cannot be made as the accuracy of CT in predicting prevertebral musculature involvement has been reported to be low at 55% (Righi et al. 1996). Therefore, surgical exploration has to be done for definitive diagnosis. In contrast, preservation of the prevertebral fat planes is helpful as the negative predicative value for prevertebral musculature involvement is high with 82% (Righi et al. 1996).
Fig. 5.8. Axial contrast-enhanced CT image through the mid thyroid cartilage level shows a large squamous cell carcinoma arising from the pyriform sinus on the right (arrowheads) with huge extension into the lateral compartment of the neck (arrows) causing marked flattening and lateral displacement of the sternocleidomastoid muscle (asterisk on right) when compared to its normal appearance on the left (asterisk on left). In addition, this mass results in complete occlusion of the internal jugular vein on the right when compared to the left side (ij on left). The common carotid artery (c) is also surrounded by the mass on the right (c on right) when compared to its normal appearance on the left (c on left). Please note also the submucosal involvement of the false vocal cord on the right (o)

88 |
I. M. Schmalfuss |
Fig. 5.9. Axial contrast-enhanced CT image through the false vocal cord level shows submucosal extension of a right pyriform sinus tumor (asterisk) into the right false vocal cord (arrows) that is seen as obliteration of the paraglottic fat plane when compared to the normal appearance on the left (arrowheads). This portion of the tumor was not appreciable on endoscopic examination
Fig. 5.10. Axial contrast-enhanced CT image through the true vocal cord level demonstrates a large pyriform sinus cancer on the left (asterisk) that is extending in submucosal fashion into the left true vocal cord (white arrows). The extension into the true vocal cord is slightly higher in density than the normal vocal cord tissues; also the slight widening of the distance between the arytenoid and thyroid cartilage (black arrow), the disorganization of the intrinsic vocal cord musculature and the obliteration of the paraglottic fat plane provide additional clues to the glottic extent of the primary tumor. Note that the normal paraglottic fat plane (arrowheads on right) at the true vocal cord level are significantly thinner than at the false vocal cord level (compare with Fig. 5.9)
Cervical esophageal tumors like to infiltrate adjacent anatomical structures, such as the trachea, TE groove housing the recurrent laryngeal nerve, and adjacent vasculature (Figs. 5.11 and 5.12). In addition, they are inclined to spread in a submucosal fashion to involve the hypopharynx (Fig. 5.12c).
The exact assessment of the craniocaudal extension of hypopharyngeal tumors into the cervical esophagus and vice versa is crucial for planning of surgical resection (limited versus extensive resection) (Fig. 5.12). Since hypopharyngeal tumors can spread in a superficial or submucosal pattern, a combination of clinical examination and cross-sectional study should be used in the treatment planning process.
5.3.2.4
Nodal Chain Involvement
The different hypopharyngeal tumor subtypes and the cervical esophagus have slightly different lymphatic drainage pathways: the postcricoid area tumors primarily drain into group III, IV and VI lymph nodes; the pyriform sinus tumors tend to metastasize into group II, III, and V lymph nodes; the posterior hypopharyngeal wall cancers like to involve the retropharyngeal lymph nodes and secondarily the internal jugular chain lymph nodes. Retropharyngeal lymph nodes are only rarely involved with the other hypopharyngeal cancer subtypes and seen in 15% of patients, however, only when there is concomitant involvement of the lateral nodal chain groups (Million 1994). Cervical esophageal cancer drains into group VI and mediastinal lymph nodes. The group VI lymph nodes are involved in 71% of patients at presentation (Weber et al. 1993).
5.3.2.5
TNM Classification
The staging system of the primary hypopharynx and cervical esophageal cancers and associated nodal metastatic disease is outlined in Tables 5.1 and 5.2, respectively (American Joint Committee on Cancer 2002). The recommended staging of cervical esophageal lesions is identical to that of the intrathoracic esophagus.
5.3.3
Secondary Involvement by Other Tumors
Infiltration of the hypopharynx and cervical esophagus by surrounding tumors is rare. It may occur

Neoplasms of the Hypopharynx and Proximal Esophagus |
89 |
a 
 b
b
Fig. 5.11a,b. Axial non-enhanced T1- (a) and contrast enhanced T1- (b) weighted images through the upper esophagus show lack of patent esophageal lumen caused by an esophageal cancer that is difficult to appreciate on the non-enhanced T1-weighted image (a). The contrast-enhanced T1-weighted image clearly shows gross involvement of the common wall of the trachea and esophagus (arrowheads) that enhances in comparison to the non-enhancing normal tracheal wall (arrows); this provides critical clues to the correct diagnosis
a |
b |
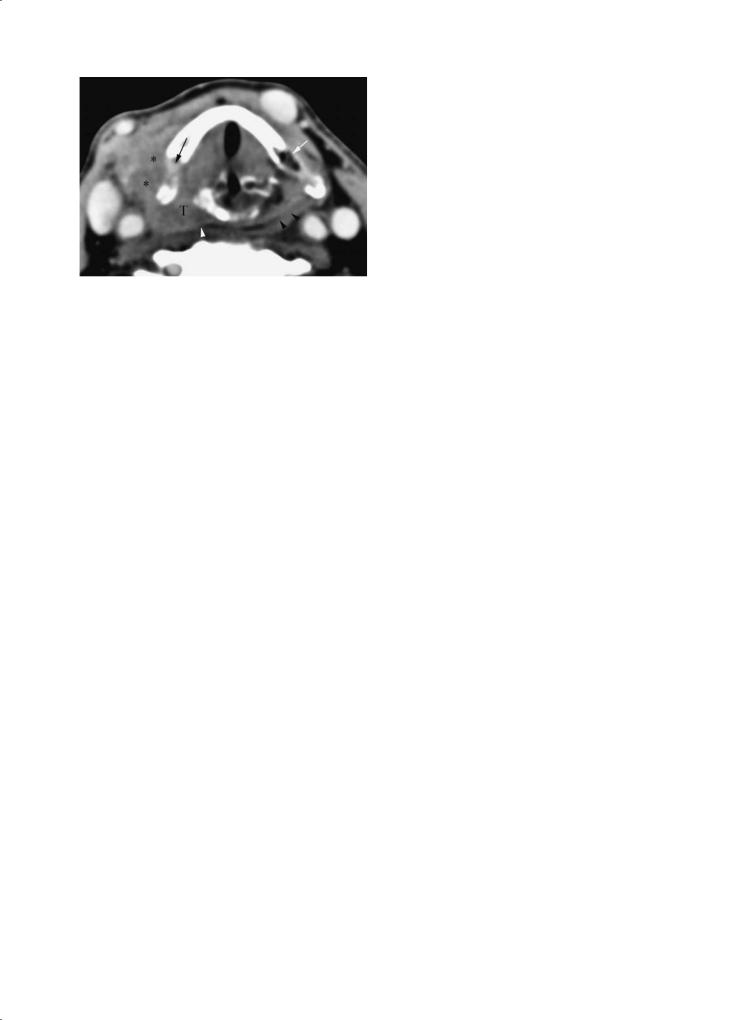
Fig. 5.12a–c. Axial |
contrast-enhanced CT images through |
the cervical esophagus (a), esophageal verge (b) and postcricoid level (c) show marked wall thickening of the upper esophagus caused by a large esophageal cancer with clear signs of tumor growth beyond the serosal layer, delineated as indistinct appearance of the outer esophageal margin
(arrowhead in a), “dirty” appearance of the paraesophageal |
|
fat on right (white arrow) and gross extension into the TE |
|
groove on the right (black arrows in a). Superiorly, the tumor |
|
is involving the esophageal verge which is slightly larger in |
|
anteroposterior diameter (between arrowheads in b) than |
|
typically seen. In addition, there is partial obscuration of the |
|
left-sided surrounding fat plane (arrow in b) consistent with |
|
extra-esophageal tumor growth, providing an additional clue |
|
for involvement of the esophageal verge. The tumor contin- |
|
ues superiorly to involve the post-cricoid region on the left |
|
(arrows in c), when compared to the normal appearance on |
|
the right (arrowhead in c) |
c |

90 |
I. M. Schmalfuss |
Table 5.1. Staging of primary tumors of the hypopharynx (American Joint Committee on Cancer 2002) |
|
|
|
Primary tumor |
|
|
|
Tis |
Carcinoma in situ |
T1 |
Tumor limited to one subsite of hypopharynx and 2 cm or less in greatest dimension |
T2 |
Tumor invades more than one subsite of hypopharynx or an adjacent site, or measures more than 2 cm |
|
but not more than 4 cm in greatest diameter without fixation of hemilarynx |
T3 |
Tumor more than 4 cm in greatest dimension or with fixation of the hemilarynx |
T4 |
Tumor invades thyroid/cricoid cartilage, hyoid bone, thyroid gland, esophagus, or central compart- |
|
ment soft tissuesa |
Regional lymph nodes |
|
NX |
Regional lymph nodes cannot be assessed |
N0 |
No regional lymph node metastasis |
N1 |
Metastasis in a single ipsilateral lymph node, 3 cm or less in greatest dimension |
N2 |
|
N2a |
Metastasis in a single ipsilateral lymph node more than 3 cm but not more than 6 cm in greatest |
|
dimension |
N2b |
Metastasis in multiple ipsilateral lymph nodes, none more than 6 cm in greatest dimension |
|
Metastasis in bilateral or contralateral lymph nodes, none more than 6 cm in greatest dimension |
N2c |
|
N3 |
Metastasis in a lymph node more than 6 cm in greatest dimension |
aCentral compartment soft tissues includes prelaryngeal strap muscles and subcutaneous fat.
Table 5.2. Staging of primary tumors of the cervical esophagus (American Joint Committee on Cancer 2002)
Primary tumor
Tis |
Carcinoma in situ |
T1 |
Tumor invades the lamina propria or |
|
submucosa |
T2 |
Tumor invades muscularis propria |
T3 |
Tumor invades adventitia |
T4 |
Tumor invades adjacent structures |
Regional lymph nodes |
|
NX |
Regional lymph nodes cannot be |
|
assessed |
N0 |
No regional lymph node metastasis |
N1 |
Regional lymph node metastasis |
|
|
with advanced head and neck tumors, thyroid tumors, tracheal and bronchogenic carcinomas (Roychowdhury et al. 2000). MR is more sensitive than CT for detection of hypopharyngeal and/or esophageal invasion by an adjacent malignancy due to its better soft tissue definition. Focal areas of increased T2 signal intensity raise the suspicion for invasion (Fig. 5.13). Focal enhancement following contrast administration might also be a sign of infiltration; however, it is not as specific as the T2 changes (Fig. 5.13b,c). Circumferential mass at the level of the cervical esophagus has been reported to be the most sensitive and specific sign of invasion (accuracy, 100%). In contrast, intact adjacent fat planes, absence of wall thickening, and normal T2 wall signal intensity indicate no invasion with a very high
degree of confidence (Fig. 5.1) (Roychowdhury et al. 2000).
5.4
Cross-Sectional Imaging
Cross-sectional imaging with CT and MR is critical in the evaluation of patients with hypopharyngeal and/or cervical esophagus malignancies (Wenig et al. 1995;
Becker 1998; Aspestrand et al. 1990; Nowak et al. 1999; Prehn et al. 1998; Thabet et al. 1996). Overall, it has been shown that the clinical tumor stage increases in up to 90% of patients with cross-sectional imaging. Changes in T-stage account for two thirds of primary tumor up-staging due to detection of lateral soft tissue involvement in 88%, and bone or cartilage invasion in 23% of patients. In one third of patients the N-stage was responsible for the tumor up-staging. Comparison of the accuracy of tumor staging with pathological findings revealed that the clinical examination is less accurate with 58% than CT and MR imaging with 80% and 85% accuracy, respectively. These facts emphasize the essential role of cross-sectional imaging in staging of hypopharyngeal and esophageal cancer. Interestingly, none of the other cancers of the head and neck region shows such a significant impact of cross-sectional imaging upon staging.
CT and MR imaging is, however, only helpful when performed with an appropriate protocol covering the potential sites of tumor spread, utilizing the appro-

Neoplasms of the Hypopharynx and Proximal Esophagus |
91 |
a 
 b
b
Fig. 5.13a–c. Axial non-contrasted T1- (a), contrast-enhanced T1- (b) and T2- (c) weighted images show a large mass arising from the left thyroid lobe (M). This mass is invading the left hypopharynx which is not well see on the non-contrasted T1-weighted image (a) as there is no significant infiltration of the submucosal fat planes on the left when compared to their normal appearance on the right (arrows in a). The enhanced T1- (b) and the T2- (c) weighted images clearly show the invasion by the thyroid cancer as the muscular layers are obscured
by an enhancing or hyperintense lesion, respectively, when |
|
compared to the normal appearance of the hypopharyngeal |
|
musculature on the right (arrowheads in b and c). t, Normal |
|
right lobe of the thyroid gland |
c |
priate imaging study, sequence and window display. Although each radiologist has personal preferences and there are vendor related variations in hardware and software, the subsequent generic imaging guidelines should be followed:
1.Image the patient in supine position with the neck slightly hyperextended to elongate the airway. Use dedicated neck coil for MR imaging to improve the spatial resolution and signal-to-noise ratio.
2.Perform images in axial plane aligned parallel to the true vocal cords from the body of the mandible to the thoracic inlet. Increase the upper extent to the skull base if posterior pharyngeal wall cancer is suspected to capture the entire possible extent of the tumor and to include all retropharyngeal lymph nodes.
3.Utilize a slice thickness of ≤ 3 mm for CT and contiguous 3-mm images for MR imaging for adequate display of the pertinent anatomical structures. Consider even thinner slices for CT if multi-planar reformations are desired.
4.Use a field-of-view of ≤ 16 cm through the neck. Additional reconstructions of the CT images
through the hypopharynx with a field-of-view of 10 cm are recommended to increase spatial resolution. Magnification of the images performed with the larger field-of-view are not sufficient as the special resolution will stay the same.
5.Use image matrix of at least 256×256 for MR and 512×512 for CT for optimal spatial resolution.
6.Inject intravenous contrast for better tumor border delineation and detection of nodal metastatic foci.
7.MRI: A minimum of non-contrasted and contrast T1-weighted images and fast spin-echo T2weighted images should be performed to emphasize soft tissue detail. Other sequences may be included to better evaluate certain structures such as the intramural fat planes (see Sect. 5.2.2).
8.CT: Reconstruction of the images through the laryngeal cartilages in bone algorithm is helpful for detection of subtle cartilage destruction and or sclerosis.
9.Utilize the multi-planar capabilities of both imaging modalities to facilitate the assessment of craniocaudal tumor extension.

92 |
I. M. Schmalfuss |
5.5
Radiologist’s Role
5.5.1 Pre-treatment
The radiologist’s pre-treatment role is multifold: detection of the subsite of origin of the primary tumor, delineation of the extent of the primary tumor, assessment of the nodal status and detection of a second primary cancer. When the full extent of the primary tumor is assessed and reported, the following pertinent issues have to be emphasized as they may influence the T staging of the tumor:
5.5.1.1 Submucosal Spread
As mentioned before, hypopharyngeal and or esophageal cancers like to grow in a submucosal fashion and, therefore, remain undetectable in a significant number of patients on clinical and endoscopic examination (Saleh et al. 1993). Occasionally, the entire tumor is submucosal in location and difficult or impossible to biopsy endoscopically. In such cases, the radiologist may offer percutaneous biopsy under CT guidance.
5.5.1.2
Cartilage Involvement
Cartilage involvement may be studied with CT and MR. Both modalities struggle with the problem of lack of ossification of the different cartilages in the younger patient and inhomogeneous as well as variable ossification with advanced age (Yeager et al. 1982). This is in particular true for the thyroid cartilage. Since the different cartilages tend to ossify in a symmetric fashion, asymmetric attenuation might be a helpful hint for presence of cartilage invasion and needs to be included in the pre-treatment assessment of CT and or MR studies (Fatterpekar et al. 2004).
The role of CT and MR in detection of cartilage involvement has been studied extensively in the past decade as it has been shown that non-removal of an abnormal-appearing cartilage carries a risk of 50%–60% of leaving tumor behind. The overall consensus is that MR is the most sensitive imaging modality in detection of cartilage involvement; however, it suffers from low specificity as inflammation, edema and sclerosis can show similar MR findings as tumor invasion (Wenig et al. 1995; Becker 1998;
Becker et al. 1995; Castelijns et al. 1988; Zbären et al. 1996). For CT, the reported sensitivity is lower but the overall specificity is higher than for MR (Becker et al. 1997). Therefore, a combination of both studies might be the most effective strategy in the evaluation process of cartilage invasion by cancer (Yousem and Tufano 2002). In addition, the specificity of both imaging modalities depends upon the cartilage type. The thyroid cartilage has the lowest specificity due to its variable ossification and the arytenoid cartilage has the highest. Therefore, the diagnosis of thyroid cartilage involvement by tumor should only be made with caution with both imaging modalities.
Cartilage involvement can manifest as cartilage sclerosis (Fig. 5.14), cortical erosions or lysis (Fig. 5.15) and bone marrow replacement (Fig. 5.16). Cartilage sclerosis is discernible as increased density on CT and decreased attenuation on all MR sequences with lack of enhancement following contrast administration (Fig. 5.14). It has been shown to be the most sensitive criterion for cartilage invasion; however, it often corresponds to “benign” reactive inflammation caused by the adjacent tumor or occasionally to a normal anatomical variation as reported for the arytenoid cartilage (Schmalfuss et al. 2000; Becker et al. 1997; Munoz et al. 1993). Therefore, it is not surprising that the positive predictive value of cartilage sclerosis for tumor invasion has been reported to be only about 50%. Cartilage erosion or lysis manifests as serpiginous or gapping cartilage contour while bone marrow replacement shows increased density on CT and decreased signal intensity on T1-weighted images in relation to the uninvolved fatty replaced bone marrow seen in older patients with marked enhancement following contrast administration (Figs. 5.15 and 5.16). None of the criteria alone showed sufficient sensitivity and specificity for cartilage invasion and therefore, the highest degree of accuracy could only be reached when combining sclerosis, erosions or lysis and extralaryngeal tumor extension together. Since not all of these criteria are present in each patient simultaneously, a significant false negative rate would be expected. Nevertheless, cross-sectional imaging is valuable as an excellent negative predictor for cartilage invasion with reported high negative predictive values of 92%–100% (Becker 1998; Castelijns et al. 1988; Becker et al. 1995; Zbären et al. 1996).
5.5.1.3
Tumor Volume
In recent years, focus has been placed on stratifying patients in highor low-risk groups to help with the

Neoplasms of the Hypopharynx and Proximal Esophagus |
93 |
a |
b |
Fig. 5.14a–c. Axial contrast-enhanced CT images displayed in |
|
soft tissue (a) and bone (b) windows show a large pyriform |
|
sinus mass on the left (T) that is causing subtle sclerosis of |
|
the left cricoid cartilage (white arrow in a and b). The T2- |
|
weighted (c) image at the same level confirms the sclerosis as |
|
the normally seen high signal intensity of the cricoid cartilage |
|
(arrowhead in c) is replaced by dark signal intensity on the |
|
left (arrow in c). In addition, this mass partially obliterates |
|
the left lateral surrounding fat plane (white arrowheads on |
|
left in a) when compared to its normal appearance on the |
|
right (white arrowhead on right in a). There is also oblit- |
|
eration of the normally seen fat plane around the common |
|
carotid artery (c in a) on the left when compared to its normal |
|
appearance on the right (black arrowheads in a) |
c |
a 
 b
b
Fig. 5.15a,b. Axial contrast-enhanced CT images displayed in soft tissue (a) and bone (b) windows show severe foreshortening of the posterior thyroid cartilage caused by extensive pyriform sinus cancer (T) involvement on the right, when compared to its normal length on the left (arrow)
selection of the most optimal treatment plan based on outcome measures. Beside cartilage invasion, tumor volume and amount of disease at the pyriform sinus apex have been identified to be critical prognostic factors in patients with T1 and T2 stage pyri-
form sinus cancer (Pameijer et al. 1998). A tumor volume of 6.5 ml demarcated the threshold between favorable and non-favorable to reach control at the primary site with radiation therapy alone. Similar threshold criteria were also detected in regard to
94 |
I. M. Schmalfuss |
Fig. 5.16. Axial contrast-enhanced CT image through the arytenoid cartilage level shows replacement of the normally seen fatty bone marrow (white arrow) by soft tissue density (black arrow) caused by bone marrow replacement of this portion of the thyroid cartilage by a pyriform sinus cancer on the right (T). Note the abrupt cut-off of the submucosal fat planes caused by the tumor on the right (white arrowhead) when compared to their normal appearance on the left (black arrowheads). The tumor also wraps around the posterior border of the thyroid cartilage to involve the strap muscles (asterisks)
pyriform sinus apex involvement. A tumor diameter of < 10 mm at the level of the base of the arytenoid cartilage and upper 3 mm of the cricoid cartilage (= “minimal apical disease”) has been shown to have a favorable prognosis to reach control at the primary site with radiation therapy alone, in contrast to tumor diameter of ≥ 10 mm (= “bulky apical disease”) (Pameijer et al. 1998). The results of tumor volume and apical disease combined, classified the patients in different risk groups with the following criteria and local control rates if treated with radiation therapy alone:
•Low-risk group: Tumor volume < 6.5 ml and no or minimal pyriform apex disease resulted in a control rate of 94% (Fig. 5.17).
•Moderate risk group: Tumor volume of < 6.5 ml and bulky apical disease or tumor volume ≥ 6.5 ml and no or minimal pyriform apex disease demonstrated local control rates of 50% (Fig. 5.18).
•High-risk group: Tumor volume of ≥ 6.5 ml and bulky apical disease yielded a local control rate of 0% (Fig. 5.19).
Therefore, tumor volume and extent of disease at the pyriform apex level should be included in the radiological report for all T1 and T2 stage pyriform sinus cancers. Thresholds for tumor volume and/or extent of pyriform apex disease for other types of hypopharyngeal and/or other T stages are still unknown.
5.5.2
During Treatment
At present, the radiologist is only rarely involved during the treatment phase of patients with hypopharyngeal or cervical esophageal cancer, unless the patient develops complications related to the therapy, such as fistula and abscess formation or vascular rupture requiring percutaneous intervention. Advances in current, and development of new, treatment regimes will, however, require that the radiologist assumes a more active role in the therapy delivery in the foreseeable future. Intra-arterial administration of supradose of Cisplatin directly into the tumor bed combined with concurrent radiation therapy (“RADPLAT protocol”) has already been shown to be a promising treatment option in patients with advanced head and neck cancer (Robbins et al.2000).The preliminary results show a significantly higher rate of local control in advanced head and neck tumors (80%) and an improved 5-year disease-specific and overall survival rate (54% and 39%, respectively). The results of RADPLAT applied specifically to pyriform sinus cancer demonstrated a complete local response rate of 92% and 76% at the nodal site with a 5-year disease-specific and overall survival rate of 50% and 23%, respectively (Samant et al. 1999). Although these survival rates are similar or only slightly higher than reported for other treatment regimes, RADPLAT has shown a higher organ preservation rate (88%) with adequate voice preservation and acceptable swallowing abilities. A shift of the disease progression from local recurrence to distant metastasis has been noted in patients with head and neck cancers treated with RADPLAT protocol (Samant et al. 1999)42. No data regarding other sites of the hypopharynx or cervical esophagus are currently available.
5.5.3
Post Treatment
As it is true for the pretreatment evaluation of patients with hypopharyngeal or cervical esophageal cancer, cross-sectional imaging plays a crucial role in the detection of recurrent cancer. It has been reported that up to 40% of recurrent tumors are detected with cross-sectional imaging prior to their discovery on clinical examination (Hermans et al. 2000). This is on the one side due to the similarity of post-ra- diotherapy changes to recurrent tumor on clinical examination, and on the other side due to potential submucosal location of recurrent tumors. Therefore,