

Virtuoso AMS Environment User Guide
Quick-Start Tutorial
The model file opens so you can review the values that characterize thenmos4 and pmos4 components. When you are done looking, close the file without saving.
6. In the AMS Analog Models form, click OK.
Elaborating and Simulating the Design
Now that you have netlisted and compiled the entire design, you are ready to elaborate and simulate it. The AMS elaborator, ncelab, resolves disciplines, inserts interface elements, and creates a simulation snapshot of your design. The AMS simulator, ncsim, then runs the simulation.
Some of the steps for this tutorial have been done for you. At this point in your own designs, you will probably want to choose AMS – Global Signals from the hierarchy editor menu and ensure that the form is filled in as necessary.
Specifying a Tcl File to Set SimVision Breakpoints
To prepare for the elaboration and simulation,
1.In the hierarchy editor, choose AMS – Options – Simulator.
The AMS Options form appears, displaying the Simulator pane.
2.Click the Browse button.
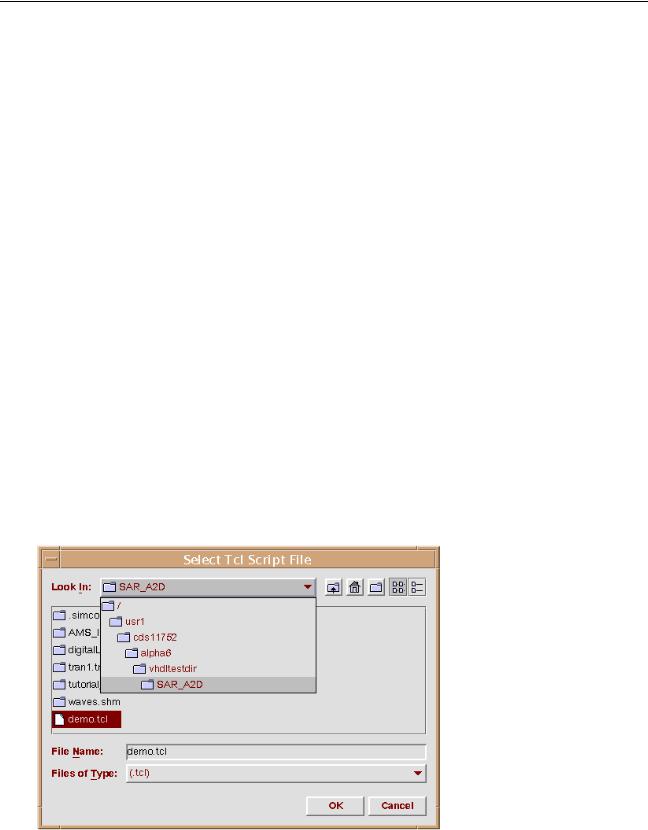
The Select Tcl Script File browser appears.
April 2004 |
43 |
Product Version 5.3 |
Virtuoso AMS Environment User Guide
Quick-Start Tutorial
3.Select the demo.tcl file in the directory where you typed theicms command to open the CIW.
4.Click OK to close the browser.
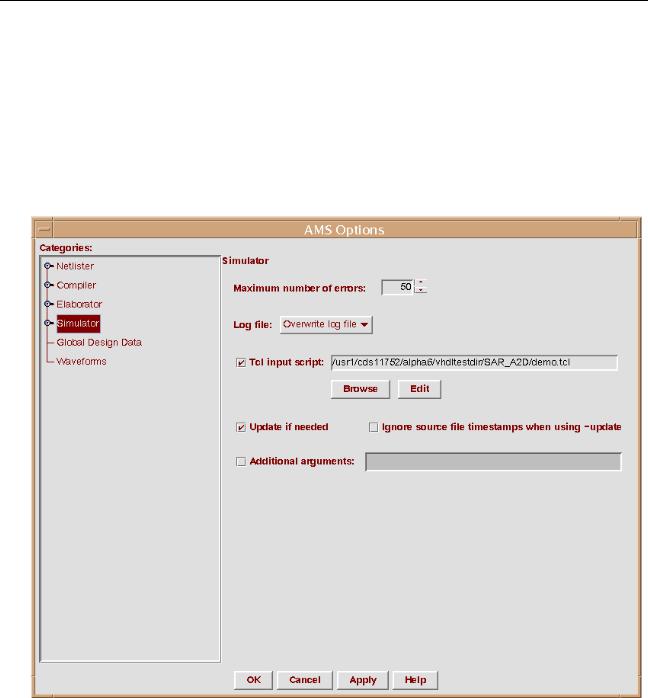
The full path to your demo.tcl file appears in theTcl input script field of theSimulator pane.
This file sets a breakpoint to be used when SimVision runs. After these steps, the Simulator pane looks like this:
5.Click Apply.
The AMS Options form, which you use in the next section of the tutorial, remains open.
April 2004 |
44 |
Product Version 5.3 |
Virtuoso AMS Environment User Guide
Quick-Start Tutorial
Specifying the Simulation Analysis
The steps in this section illustrate how you can use the graphical user interface to specify the simulation analysis.
1.In the AMS Options form Categories pane, click Simulator – Analog Solver – Tran
Analysis.
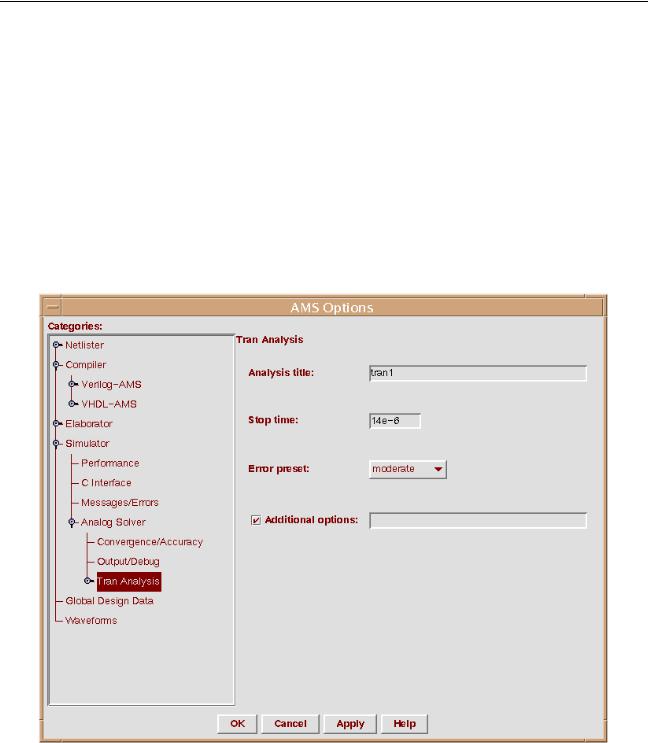
The Tran Analysis pane appears.
2.In the Analysis title field, typetran1.
3.In the Stop time field, type14e-6.
After these steps, the Tran Analysis pane looks like this:
4.In the Categories pane, click Simulator – Analog Solver – Tran Analysis –
Convergence/Accuracy.
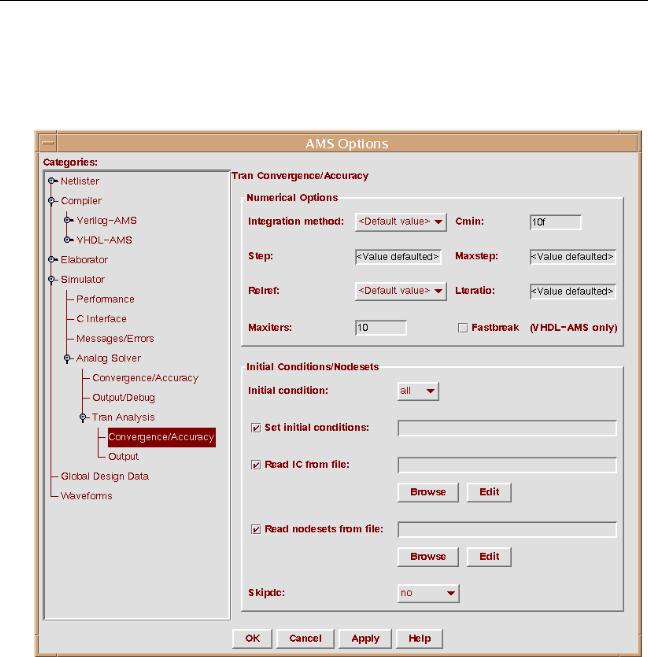
The Tran Convergence/Accuracy pane appears.
April 2004 |
45 |
Product Version 5.3 |
Virtuoso AMS Environment User Guide
Quick-Start Tutorial
5.In the Maxiters field, type10.
6.In the Cmin field, type10f.
After these steps, the Tran Convergence/Accuracy pane looks like this:
7.Click OK.
The AMS Options form closes.
Specifying Values to Save and Plot
This section of the tutorial illustrates how to designate the information to be saved and plotted during the simulation.
April 2004 |
46 |
Product Version 5.3 |
Virtuoso AMS Environment User Guide
Quick-Start Tutorial
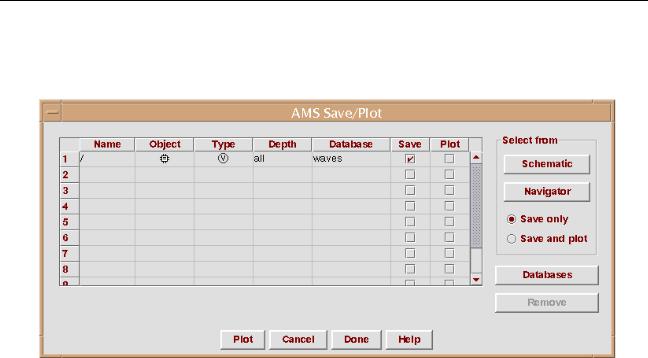
1.In the hierarchy editor, choose AMS – Save/Plot.
The AMS Save/Plot form appears.
The first row in the table is a default setting that saves waveforms for the entire design. The tutorial design is small but in a larger design you might want to remove the check mark from the Save column for this default row and use other rows to save only the information you need.
2.Turn on Save and plot.
With this selection, rows that are added to the table in the future have check marks in both the Save and Plot columns. Having check marks in these two columns means that the waveforms are plotted as soon as they are calculated during simulation.
3.Click Schematic.
The Virtuoso Schematic Editing window becomes active. It has a message at the bottom indicating that you can select objects to be saved and plotted.
April 2004 |
47 |
Product Version 5.3 |
Virtuoso AMS Environment User Guide
Quick-Start Tutorial
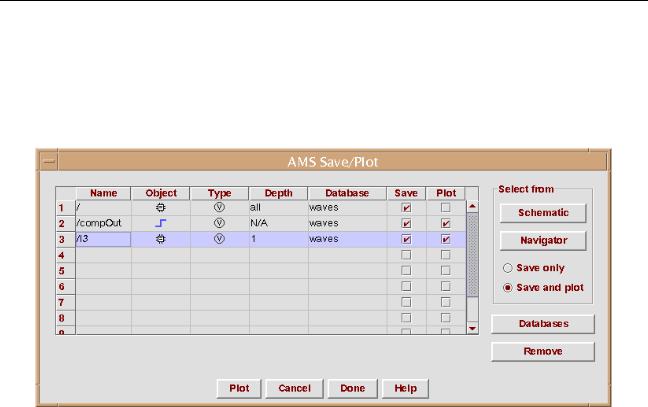
4.In the Schematic Editing window, select the compOut net on the right side of the comparator.
A new row appears for the /compOut net in the AMS Save/Plot form. Notice how both the Save and Plot columns have check marks.
5.Press Escape while you are still in the Virtuoso Schematic Editing window to end the selection of objects.
The object selection message disappears from the Schematic Editing window and from the AMS Save/Plot form.
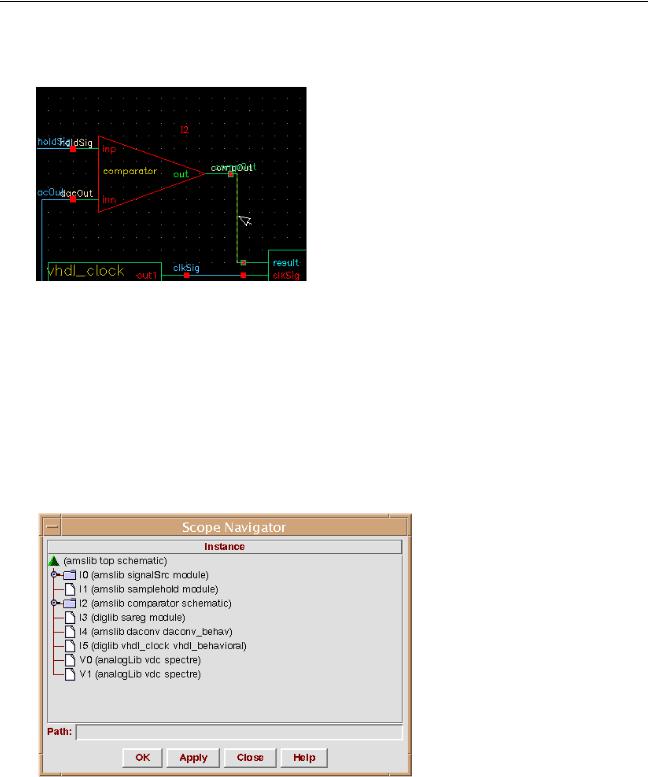
6.In the AMS Save/Plot form, click Navigator.
The Scope Navigator form appears, displaying a hierarchical view of the design.
7.Highlight the I3 instance.
The path to the instance appears in the Path field.
April 2004 |
48 |
Product Version 5.3 |
Virtuoso AMS Environment User Guide
Quick-Start Tutorial
8.Click OK.
The Scope Navigator form closes. A new row appears in the AMS Save/Plot form with the path to the instance and default information for a new probe.
After these steps, the AMS Save/Plot form looks like this:
9.Click Done.
The AMS Save/Plot form closes.
Elaborating and Simulating the Design
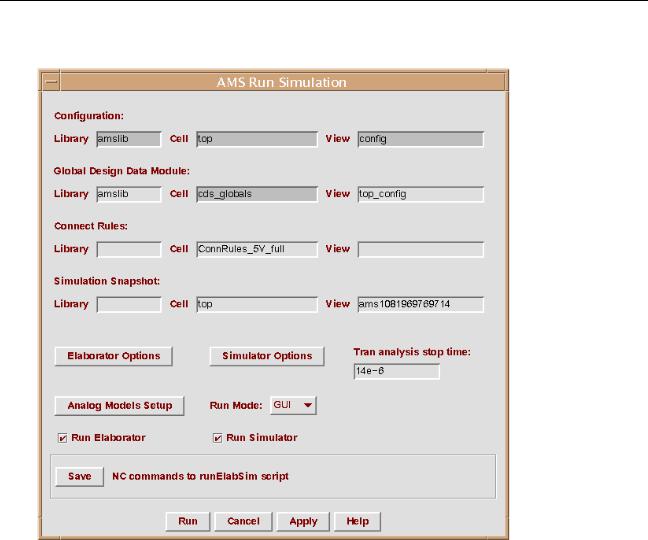
1. In the hierarchy editor window, choose AMS – Run Simulation.
April 2004 |
49 |
Product Version 5.3 |
Virtuoso AMS Environment User Guide
Quick-Start Tutorial
The AMS Run Simulation form appears.
Depending on the simulator you are using, the Cell field forConnect Rules specifies either mixedsignal or ConnRules_5V_full. These names are associated with the different sets of connect modules shipped with various releases of the simulator.
The information specified in this form is passed as command options to the elaborator and simulator.
2.Be sure that both Run Elaborator and Run Simulator are turned on.
3.Click Run to elaborate the design and start the AMS simulator in GUI (interactive) mode, using the SimVision windows.
April 2004 |
50 |
Product Version 5.3 |
Virtuoso AMS Environment User Guide
Quick-Start Tutorial
Using the SimVision Windows
As the simulator starts, it opens the Console, Design Browser, and Waveform windows. This tutorial exercises only some of the basic features of SimVision. For detailed information, see
SimVision User Guide.
1.In the Console window, choose File – Close Window. (The tutorial does not use this window.)
2.In the Design Browser window, choose Windows – New – Source Browser. The Source Browser appears, showing the Verilog-AMS netlist for the top design.
Finding the Values of Objects in the Design
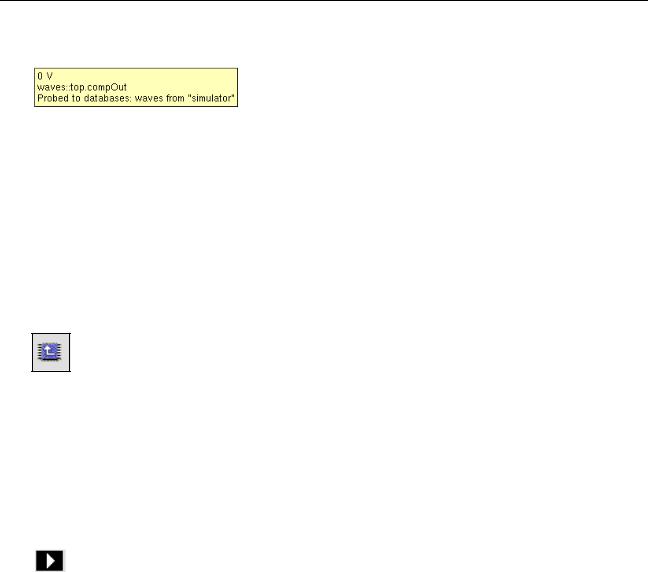
You can hover over objects such as signals and see their values. For example,
In the Source Browser, hold your cursor over compOut at about line 23.
April 2004 |
51 |
Product Version 5.3 |
Virtuoso AMS Environment User Guide
Quick-Start Tutorial
Initially this analog value is zero, shown as follows:
Traversing the Hierarchy in the Source Browser
You can traverse the hierarchy by double-clicking on an instance. For example,
In the Source Browser, double click on I5 to descend into the vhdl_behavioral view of the VHDL clock.
To return to top,
Click the Scope Up button, which is just to the right of the Scope field.
Running the Simulation
The Waveform window already contains the name of the compOut net and of all the nets associated with instance I3 because you used the AMS Save/Plot form earlier to specify them. You are now ready to run the simulation and plot the waveform.
1.In the Waveform window, click the Run button
and run the simulation until it ends at about simulation time 14000ns. (You have to click Run more than once to get past the breakpoint.)
The waveforms appear as soon as they are calculated and continue marching during the remainder of the simulation.
2.Choose View – Zoom – Full X and View – Zoom – Full Y to fit the waveforms into the available room in the Waveform window.
3.Position the cursor over the name of the result waveform, right-click to open the popup menu, and choose Cut.
The result waveform disappears from the Waveform window.
4.Choose Edit – Paste.
April 2004 |
52 |
Product Version 5.3 |

Virtuoso AMS Environment User Guide
Quick-Start Tutorial
The result waveform reappears at the bottom of the window.
5.Position the cursor over the name of the compOut waveform, right-click to open the popup menu, and choose Cut.
The compOut waveform disappears from the Waveform window.
6.Choose Edit – Paste.
Now the result and compOut waveforms are together at the bottom of the window.
7.Compare the analog waveform of compOut with the corresponding digital waveform, result.
These two signals are connected by an automatically inserted connect module.
8.When you are done examining the waveforms, choose File – Exit SimVision.
April 2004 |
53 |
Product Version 5.3 |
Virtuoso AMS Environment User Guide
Quick-Start Tutorial
Plotting Waveforms After the Simulation Ends
In this section, you select and plot waveforms that were saved during the simulation. You might do this, for example, if you decide to replot waveforms you have already seen or if you simulated in batch mode and now want to see the results.
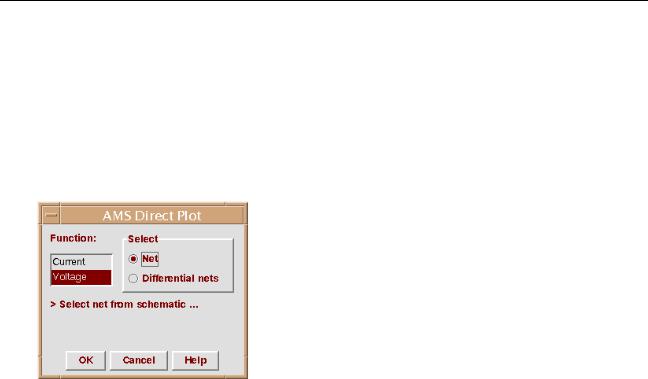
1.In the hierarchy editor, choose AMS – Direct Plot. The AMS Direct Plot form appears.
2. Ensure that Function is set to Voltage and that Select is set to Net.
These choices mean that the voltage is plotted each time you select a net from the schematic. The message
Select net from schematic ...
appears at the bottom of the Virtuoso Schematic Editing window.
3.In the Virtuoso Schematic Editing window, select the dacOut net from the schematic. A plot of the voltage for the net appears in a Waveform window.
4.In the Waveform window, choose View – Zoom – Full X.
5.From the schematic, select the inSig net.
The waveform is added to the Waveform window.
6.In the AMS Direct Plot form, change Select to Differential nets.
The message
Select positive net from schematic ...
appears at the bottom of the Schematic Editing window.
7.From the schematic, select the dacOut net. The message
April 2004 |
54 |
Product Version 5.3 |