


Virtuoso AMS Environment User Guide
Elaborating, Simulating, and Plotting Results
The NCBrowse window appears.
2.Highlight one of the messages in the Messages pane.
Detailed information about that message appears in the Message Detail pane. For more information about the NCBrowse window, see the NCBrowse Message Browser User Guide.
Plotting Waveforms After Simulation Ends
Earlier sections in this chapter describe how to plot waveforms while the simulator is running. The following sections describe how, if the waveforms are saved during the simulation, you
April 2004 |
290 |
Product Version 5.3 |
Virtuoso AMS Environment User Guide
Elaborating, Simulating, and Plotting Results
can also plot them after the simulation ends. You might want to do this, for example, to compare the results of earlier and later simulations.
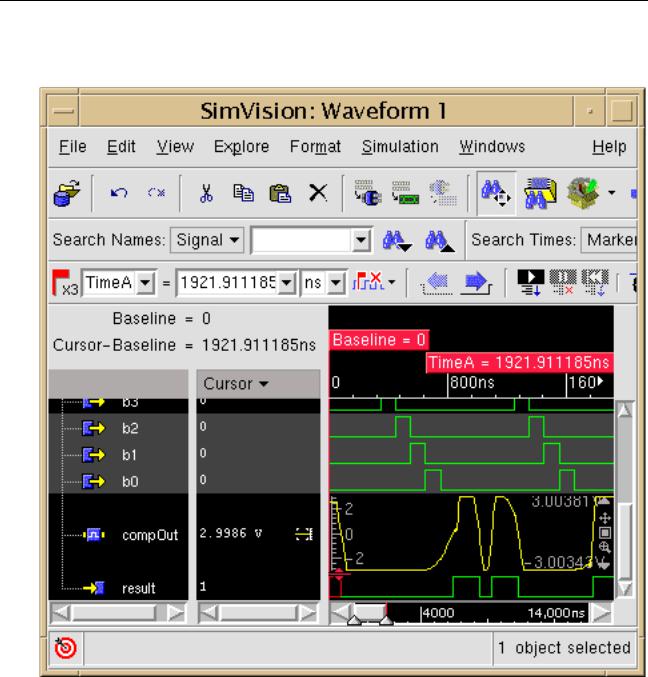
Starting the SimVision Waveform Viewer
To use the capabilities of the SimVision Waveform Viewer to select and plot waveforms,
1.From the Cadence hierarchy editor, choose AMS – Waveform Viewer.
A new SimVision Waveform window appears. A waveform window opened in this way does not communicate with AMS Designer and operates independently. To open or
April 2004 |
291 |
Product Version 5.3 |
Virtuoso AMS Environment User Guide
Elaborating, Simulating, and Plotting Results
reuse a Waveform window that communicates with AMS Designer, either click Plot on the AMS Save/Plot form, or in the hierarchy editor, choose AMS – Direct Plot.
2.Open the waveform data base.
The waveform data is located in the waves.shm subdirectory of the run directory.
For a brief example of using the SimVision Waveform viewer, see Chapter 2, “Quick-Start Tutorial.” For detailed information about the viewer, see the SimVision Waveform Viewer User Guide.
April 2004 |
292 |
Product Version 5.3 |
Virtuoso AMS Environment User Guide
Elaborating, Simulating, and Plotting Results
Plotting Waveforms Selected on a Schematic (Direct Plot)
With the AMS direct plot capability, you can select nets on schematics and have the corresponding waveforms automatically plotted in the waveform window. This approach works only if the necessary waveforms are saved during the simulation, otherwise the required data are not available to be plotted.
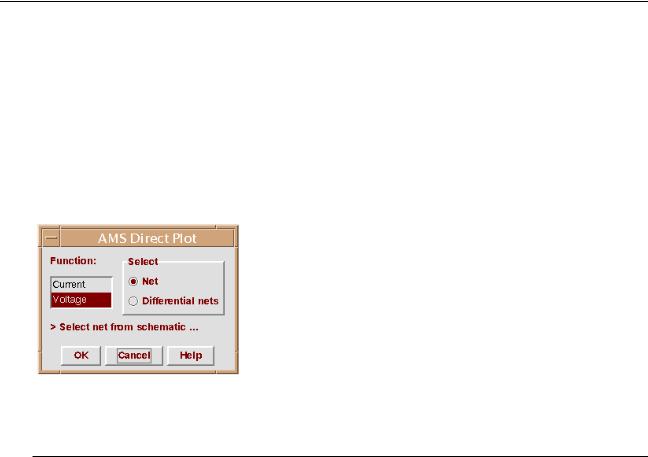
1.In the Cadence hierarchy editor, choose AMS – Direct Plot. The AMS Direct Plot window appears.
The schematic editing window also appears.
2. Use the fields in the form to specify the information to be plotted.
Field |
Effect |
|
|
Function |
|
Current |
Plots the current for the net you select on the schematic. |
Voltage |
Plots the voltage for the net you select on the schematic. |
Select |
|
Net |
Specifies that each selection of a net on the schematic is |
|
complete by itself and that either the voltage or current for |
|
that net is to be returned. |
Differential nets |
Specifies that each selection consists of two nets and that the |
|
plot is to display the difference of those two nets. |
|
|
As you switch between Net or Differential nets, the message in the AMS Direct Plot window changes accordingly.
3.Select nets in the schematic editing window.
The corresponding waveforms appear in the waveform window.
April 2004 |
293 |
Product Version 5.3 |

Virtuoso AMS Environment User Guide
Elaborating, Simulating, and Plotting Results
4. Press the Escape key when you are done selecting objects.
April 2004 |
294 |
Product Version 5.3 |