Yang Fluidization, Solids Handling, and Processing
.pdf


Fluidized Bed Scale-up |
17 |
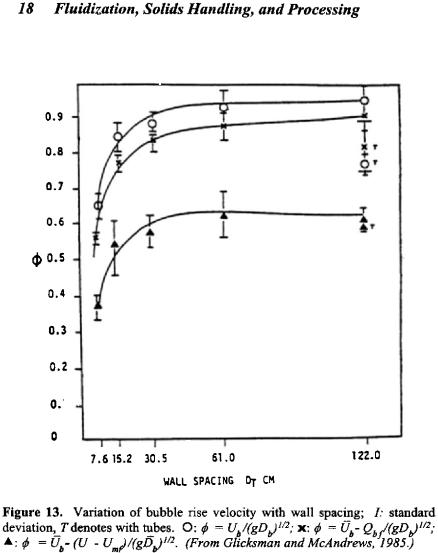
Glicksman and McAndrews (1985) determined the effect of bed width on the hydrodynamics of large particle bubbling beds. Sand particles with a mean diameter of 1 mm were fluidized by air at ambient conditions. The bed width ranged from 7.6 cm to 122 cm while the other cross sectional dimension remained constant at 122 cm. Most experiments were carried out with an open bed. The bubble rise velocity increased with the bed width, in the representation of bubble velocity as
Eq. (2) |
ub = uo - umf +φ gdB |
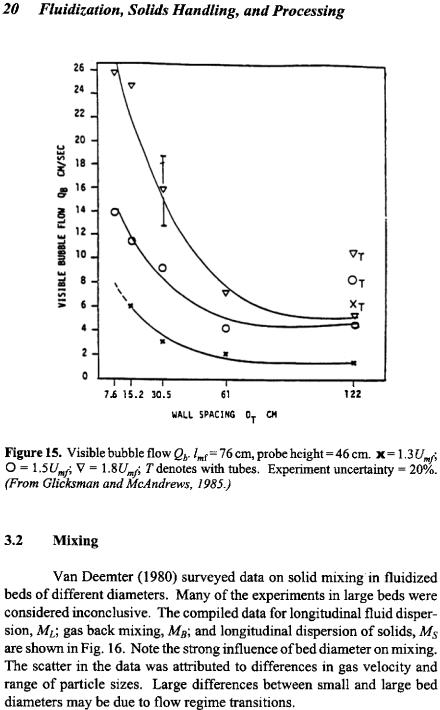
the value of φ varied from 0.4 in a two-dimensional bed to 0.6 in the three dimensional bed (Fig. 13). The mean vertical chord length of bubbles decreased with bed width (Fig. 14). The visible bubble flow decreased dramatically with an increase of bed width at a fixed superficial velocity (Fig. 15). The gas throughflow coefficient m, used to represent the total gas flow,
Eq. (3) |
uo = Qb +(1 - δ )umf + m δ umf |
increased from a mean value of 3.6 for the two dimensional bed to a mean value of 11.7 for the largest, 1.22 × 1.22 m bed cross section. The bed depths at minimum fluidization were 46 cm and 76 cm in the tests. For these rather shallow beds there were no observable preferred bubble tracks; the location of erupting bubbles was random across the bed surface. For the cases observed, with uo  umf varying from 1.3 to 1.8, the influence of the wall was absent when the bubble diameter was roughly 1/5 the bed width or less. For deeper beds or higher gas velocity, the ratio of bubble diameter to bed width is expected to be the best criterion for determining when wall effects will be negligible. For one test series, five staggered rows of horizontal tubes with a horizontal center-to- center spacing of 15.2 cm were placed in the 1.22 m square bed. The tube bed results are shown in Figs. 13–15 with a T symbol. The behavior of bubbles in the bed with the tube bank resembled that of an open bed with smaller width.


22 Fluidization, Solids Handling, and Processing
the larger beds. The porous plates give a better quality of fluidization, e.g., smaller bubbles, for shallow beds and beds of moderate depth (Rowe and Stapleton, 1961).
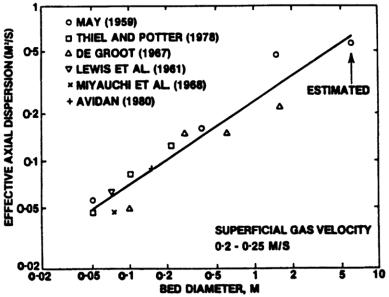
Yerushalmi and Avidan (1985) suggest that the axial dispersion coefficient of solids in slugging and turbulent flow varies approximately linearly with the bed diameter, similar to Thiel and Potter (1978). The data are shown in Fig. 17 although May’s results are probably in the bubbling fluidization regime rather than turbulent flow.
Figure 17. The effect of bed diameter on solid mixing. (From Yerushalmi & Avidan, 1985.)
3.3Influence of Bed Diameter on Circulating Fluidized Beds
Arena et al. (1988) measured the hydrodynamic behavior of two circulating fluidized beds (CFB) with riser diameters of 0.041 m and 0.12 m ID, respectively, of roughly the same height. At the same superficial gas velocity and solid recirculation rate, the larger diameter column had a higher solids fraction. The average slip velocities derived from this data are also higher for the large diameter riser (see Hartge et al. 1985). Yerushalmi and Avidan (1985) found a similar trend when comparing

Fluidized Bed Scale-up |
23 |
15.2 cm and 7.6 cm columns. Noymer et al. (1995) also compared two columns of 5.08 cm and 7.68 cm diameter of the same height which were used to simulate larger pressurized fluidized bed combustors. They found higher solids loading for the larger diameter riser at equal gas velocity and solid recirculation. In addition, the fraction of the wall covered by clusters was higher for the larger diameter column when the two beds had equal solids flow and when the two beds had equal cross section averaged solids concentration.
Rhodes et al. (1992) compared the solids flux profiles across the cross sections of a 0.152 m and 0.305 m diameter circulating bed riser. They found a region where the solid profile, given by the ratio of local flux to average flux, had a similar variation over the cross section, which was insensitive to the level of solid flux. The variation of the local solids flux over the radius was a function of the gas velocity and the riser diameter. In the larger riser, the profiles were somewhat flatter and the thickness of the downflowing region relative to the bed radius was smaller. The comparisons were not exact since the cross sections compared for the two beds were at different heights.
Zhang, Tung and Johnsson (1991) carried out investigations with three different fast bed systems with diameters of 32, 90 and 300 mm, respectively. They found that the radial voidage distribution, as a ratio of the cross sectional average, was independent of bed diameter and solids recycle rate (Fig. 18). The similarity does not hold at transition to the turbulent regime. The results are for the center of the riser excluding the entrance and exit regions. It would be interesting to determine if the similar voidage profiles hold for larger diameter risers.
Figure 18. Comparison of radial voidage profiles calculated by correlation with experimental data in the three different beds used (FCC/air). (From Zhang et al., 1991.)

