

Biomedical EPR Part-B Methodology Instrumentation and Dynamics - Sandra R. Eaton
.pdf170 |
LOWELL D. KISPERT |
1.2Reviews
The use of the ELDOR (also known as DEER or PELDOR) technique has been detailed in books, book chapters and in various reviews. They are summarized here.
The early instrumentation, principles, and applications of CW ELDOR measurements to radical systems in crystals, powders and solution were detailed in a book by Kevan and Kispert (1976) and this is a good start for the beginner in double resonance methods. Early reviews were given of the published literature by Atherton (1972, 1974, and 1976), by Hyde (1974), and Moebius (1977 and 1979). A book edited by Dorio and Freed (1979) covered the use of ELDOR measurements to study organic radicals in ironsulfur proteins (Sands, 1979), crystals (Kispert, 1979), disordered matrices (Kevan, 1979), polymers (Dorio, 1979), instrumentation (Leniart, 1979) and examples of biological interest (Sarna, 1979). In crystalline systems, Kispert, (1979), showed that it is possible to use ELDOR measurements to study the reaction mechanism of radical formation in irradiated organic crystals. Additional reviews were published by Moebius (1981), Evans and Rowlands (1984), Hyde and Feix (1989) and Sarna (1979).
Following Freed’s (1979) suggestion to use spin echoes in the study of slow motions coupled with the availability of fast microwave switches, amplifiers and loop gap resonators, Hornak and Freed (1983) developed the spin-echo ELDOR technique and applied it to slow motions. The literature that followed was summarized and the essential features detailed in Chapter 3 by Gorcester et al. (1990) in a book entitled “Modern Pulsed and Continuous-Wave Electron Spin Resonance” edited by Kevan and Bowman (1990). For those needing to learn more about 2D-ELDOR techniques and in general 2D EPR techniques and spectral analysis – this chapter is highly recommended reading. More recently the DEER experiments have been summarized and the essential features explained by Jeschke et al. (2000) in Chapter 11 (Vol. 19) of the Book on Biological Magnetic Resonance. In the same book in Chapter 10, the “2 + 1” pulse sequence is detailed and examples provided by Raitsimring (2000), while in Chapter 9, Multiple Quantum ELDOR has been clearly explained by Borbat and Freed (2000). Pulsed ELDOR has been discussed in some detail in Chapter 13 of a book by Schweiger and Jeschke (2001). These chapters are highly recommended for reading before attempting to read the literature in these areas. They provide the best up-to-date analysis of these techniques.
ELECTRON-ELECTRON DOUBLE RESONANCE |
171 |
2.INSTRUMENTAL TECHNIQUES
A brief summary of the instrumentation used to carry out ELDOR measurements and the applications of ELDOR measurements to the solution of various problems is given below. In general the CW measurements require low-power microwave devices while high-power TWT amplifiers are required for pulse measurements.
2.1Field Swept CW ELDOR
Because field modulation is used to detect EPR, it has been shown (van der Drift, 1975) that during the field sweep, the magnetic field  and the pumping frequency
  must be coupled together by the resonance condition of the pumped line so that a correct value for the ELDOR reduction factor, extrapolated to infinite pumping power, is obtained. Other recording schemes (a)
  swept and
  equal to the hyperfine distance in the spectrum and held constant during the sweep as well as (b)
  is swept and
  is a constant and
  is set either at the center of the observed line or at the top of the first derivative line, yield incorrect relaxation parameters. Recording schemes (a) and (b) cause the R(ELDOR reduction) factor to contain the effect of the pumping upon the modulated observing signal and secondly the effect of modulating the pumping line upon the observing absorption signal. However, by fixing the two microwave frequencies at the desired separation and sweeping the field an R value nearly independent of modulation at infinite power can be achieved. The value of R determined this way is technically simpler: two spectra are obtained, one at zero pump power and one at the desired pump power, permitting immediate determination of R. This method is normally referred to as field-swept ELDOR.
2.2Modulation Scheme for CW ELDOR
To achieve an R factor that is independent of the modulation field, one method is to program a computer to control both the magnetic field sweep and the pump frequency sweep using the g factor of the pumped line. In another method the resonance condition is held by locking the pump frequency to the resonance signal of the pumped EPR line which requires the introduction of extra pump power. This can introduce false ELDOR signals. A scheme has been developed out (Mehlkopf et al., 1983) where the pump power and the magnetic field modulation amplitude can be independently optimized for the lock signal and the ELDOR spectrum and the frequencies
172 |
LOWELL D. KISPERT |
of the false ELDOR signals are limited to even multiples of the frequency of the wanted ELDOR signal. These are then easily eliminated.
2.3Loop-Gap Resonator for ELDOR
A significant improvement in the signal-to-noise ratio by a factor of 20 on a molar basis was achieved when the bimodal cavity used in CW experiments up to 1985 at the X-band frequency was replaced by a loop-gap resonator at the X-band in a configuration designed by Hyde et al. (1985). On a number-of-spins basis the improvement was a factor of 70 due to the smaller volume of the resonator. When the separation between the pump and observing frequencies exceeds 100 MHz other resonators designed by Froncisz and Hyde; a bimodal loop-gap resonator with a total tuning range of 500 MHz (Tsapin et al., 1992) and doubly-tuned resonators (Mehdizadeh et al., 1983) are preferable. The loop-gap resonators with a low Q and high field factor are more practical than the earlier used bimodal cavity resonators (Hyde et al., 1968) because they had a high Q which made it more difficult to tune and decouple. More recently, a bimodal loop-gap resonator consisting of two identical one-loop-one gap resonators in coaxial juxtaposition was designed (Piasecki et al., 1996) for use at S band (1-3 GHz). This bimodal resonator could be used to carry out saturation recovery, modulation of saturation, CW ELDOR, CW EPR of a spin-label line sample and probing field distribution with DPPH, features that other loop-gap resonators could not attain. The resonator is characterized by a very high filling factor, a low quality factor and a high microwave field. It is a two-port resonant structure supporting two modes. The currents in two loops are parallel and in the other antiparallel. Adding capacitors between the loops, the frequencies of the two loops can be made to coincide. The bimodal loop-gap resonator has a very high filling factor relative to a bimodal cavity resonator. Details have been worked out concerning variable coupling to each mode, tuning the resonant frequency of one mode to that of the other, and how to adjust the isolation between modes. A crossed-loop resonator for ELDOR at S-band (Rinard et al., 1996) and L-band (Rinard et al., 2000) has been described and provider exceptional isolation between the microwave modes.
2.4Magnetic Field-Pulsed ELDOR Spectroscopy
An early attempt to carry out ELDOR measurements utilizing a pulsed EPR spectrometer was made by Rengan et al., 1979 to operate in the saturation-recovery mode. The spectrometer was used for measurements of electron spin-lattice relaxation times. The procedure was to saturate one of
ELECTRON-ELECTRON DOUBLE RESONANCE |
173 |
the hyperfine lines by a pulse of high microwave power. At the end of the microwave pulse, the magnetic field was shifted within a time shorter than the electronic  to the resonant value of another hyperfine component. The saturation transfer that had taken place was measured by monitoring the EPR signal intensity as a function of time as is usually done in a saturation - recovery experiment - measured as a function of microwave pulse width and peak saturating pulse. The response time of the spectrometer was
  and it was possible to study transients on the order of
  was possible to study.
2.52-D Pulsed ELDOR
The advent of the spin-echo technique made it possible to perform ELDOR measurements with a spin-echo spectrometer. Rapid stepping of the dc magnetic field between pumping and observing resonant positions generated a two-dimensional spectrum. Use of Fourier transform (FT) ESR techniques made it possible to record 2D ELDOR spectra analogous to 2D NMR displays. Special instrumenta-tion and techniques are needed to carry out such experiments. Gorcester and Freed (1986, 1988) designed a spectrometer with a flexible design making it possible to display both 2D FT and 2D field swept systems.
The 2D FT experiment permits the display of motional magnetization transfer. The 2D FT experiment allows for the recording of ELDOR spectra (Hornak and Freed, 1983) with only a single frequency source since the spectral band produced by a finite pulse is coherently related.
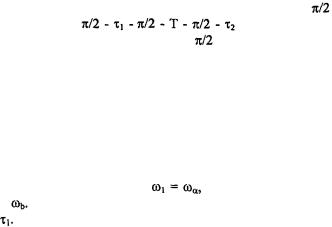
2D ELDOR technique (Gorcester et al., 1990) makes use of the
pulses applied in the sequence |
with the mixing |
time T held constant. The initial or preparation |
pulse generates the |
initial transverse magnetization. The phase of this pulse determines the phase of the amplitude modulation during the subsequent evolution period,  The second
  pulse is the beginning of the mixing period where the longitudinal magnetization components associated with each EPR line can be exchanged. This provides a mechanism whereby different components are mixed carrying different processional - frequency information such as motional magnetization - transfer. Applying the third
 pulse rotates the magnetization into the xy plane. Components that were
initially processing with angular frequency |
now process at a new |
||
frequency equal to |
The pulse sequence is repeated for a series of equally |
||
spaced values of |
The FID is collected, the phase of the preparation pulse |
||
is advanced by 90° followed by collecting a second FID. |
|||
Examples |
of |
2D ELDOR have been reported (Gorcester and Freed, |
|
1986, 1988; |
Patyal et al., 1990). Magnetization |
transfer induced by |
|
174 |
LOWELL D. KISPERT |
Heisenberg spin exchange during the mixing period gives rise to crosscorrelations that appear as cross-peaks. A direct measure of the Heisenberg exchange (HE) rates can be deduced from the relative intensities of the peaks in the 2 D ELDOR spectrum. The quantitative determination of the exchange rates was detailed. It is also possible to distinguish between HE and electron-electron dipolar (EED) relaxation between probe molecules (Gorcester et al., 1990). Considerable improvement in signal-to-noise was accomplished by using time-domain data-processing techniques based upon linear prediction with singular value decomposition (LPSVD) (Gorcester and Freed, 1988). Details and examples have been reported (Gorcester and Freed). The 2D ELDOR approach yields the relaxation rates directly while the CW ELDOR measurements yield only ratios such as  where
where  is the electron spin-flip rate and
  is the exchange rate. The advantage of 2D-ELDOR experiments over spin echo (SE) experiments is that the SE experiments require the use of substantially larger volumes to obtain adequate sensitivity (the signal voltage) for the SE is an order of magnitude less intense than the FID’s in the 2D ELDOR experiments. Also a determination of
  and
and  is obtained directly from the 2D ELDOR experiments while extensive least square fitting is required to obtain this information from SE measurements.
2.62-D Spectrometer X, Ku
A four fold improvement in signal-to-noise at 17.35 GHz occurred with the construction of a two-dimensional Fourier transform ESR (2D FT ESR), operating at 9.25 (X) and 17.35 GHz (Ku), (Borbat, Crepeau and Freed, 1997). A discussion is given of the technical problems associated with multifrequency 2D FT spectroscopy. The Ku bridge consists of an efficient heterodyne system wherein 9.25 GHz is the intermediate frequency. The sensitivity at the Ku-band is increased by almost an order of magnitude. A full 2D ELDOR spectrum could be collected in less than 20 min. for samples containing 0.5 to 5 mmol of nitroxide spin-probe in the slow-motional regime. Use is made of a bridged loop-gap resonator (BLGR) and a dielectric ring resonator (DR) to obtain broad spectral coverage at the Ku band. By using shorter microwave pulses of about 3 ns duration, a more uniform spectra excitation is observed. Successful simulation of the 2D ELDOR spectra at both 9.25 and 17.35 GHz for spin-labeled phospholipid probes in DMPG membrane vesicles using the same set of model parametry at both frequencies was achieved even though the spectra were very different in appearances at the two frequencies. Improved sensitivity and shorter dead-time at the  band made it possible to obtain orientation dependent 2D
ELECTRON-ELECTRON DOUBLE RESONANCE |
175 |
ELDOR of the cholestane spin probe. Details of the technical problems associated with the 2D FT spectrometer were given.
2.7DEER Technique
The three-pulse DEER experiment consists of a two-pulse echo sequence  (Hahn echo) at a fixed observer microwave frequency and an additional microwave
  pulse at a fixed pump frequency at time
  after the
  pulse whose position is varied between the positions of the two observer pulses (Milov et al., 1981; Milov et al., 1984). Bimodal loop-gap resonators as well as the overcoupled monomodal resonator available with the commercial Bruker pulsed spectrometer (Jeschke et al., 2000) are used. A complete review of the principle behind this pulse sequence and its application to the measurements of distances in the range between 1.5 and 8 nm has been given by Jeschke et al., 2000. Conformational distributions limit the precision using the three-pulse sequence in non-crystalline systems. To remedy this situation, a four-pulse DEER method has been devised to determine spin pairs with a broad distribution of small (< 1.5 nm) and intermediate (1.5 - 2.5 nm) distances. In this case, the signal contributions to the spin echo decay almost completely within a few tens of nanoseconds. In practice a dead time of at least three times the microwave pulse length can hardly be avoided so the three pulse sequence is extended by one more observer pulse (Pannier et al., 2000). The four-pulse sequence consists of a refocussed echo sequence
  at the observer frequency and a
  pulse at the pump frequency at time
  after the first
  pulse at the observer sequence. Time
  is varied,
  and
and  are fixed. Limitation and comparisons to other methods have been detailed and reviewed by Jeschke et al., 2000. A review has also been given of the use of DEER in the study of nitroxides and cluster sizes and intercluster distances in monomers.
Both the three-pulse and four-pulse DEER experiment require either an ELDOR extension of a commercial pulse EPR spectrometer like the Bruker E-580 FT-EPR machine or a home built pulse ELDOR spectrometer.
2.8“2 + 1 Pulse Sequence”
Constructed similar to the DEER technique is the “2 + 1” pulse sequence (Kurshev et al., 1988, 1989) also configured for probing dipolar interactions. In the DEER technique the first and third pulse produce a primary spin echo signal at  which is detected while the position of the second pulse applied at
  placed between the first and third is varied. In contrast, the “2 + 1” technique operates with all three pulses at the same carrier frequency.
176 |
LOWELL D. KISPERT |
However, DEER techniques are better for measurements than the “2+1” approach because unwanted echoes remain coherent when the same microwave source using the same frequency is used for all three pulses.
This problem never occurs in DEER. Raitsimring et al. (2000) suggested using a different source for the “+1” pulse to simplify phase cycling. In other words use the same spectrometer as for DEER. If this change is used for the “2+1” method it is an ELDOR experiment with coinciding frequencies.
The “2 + 1” technique has been used to measure dipolar interactions between similar paramagnetic centers where the EPR spectral width (< 60 G) is similar to the pulse amplitude so spectrum may be excited by a single pulse (~30 G). The pulse DEER technique is more useful for determining distances of paramagnetic centers with well separated EPR spectra. One of the centers can be designated as the observed spin and the other as the pumped spin. Details of how the various phases of the echo signal are handled in both techniques have been reported by Raitsimring (2000). The “2 + 1” technique allows for rigorous manipulation of the dipolar interactions.
2.9Multiquantum ESR (MQ-ESR)
In multiquantum ESR (MQ-ESR) spectroscopy (Mchaourab et al., 1991; Hyde et al., 1995), two microwave frequencies generated from a common oscillator irradiate a sample. The two frequencies are usually separated by 10 kHz, selected to be much less than the homogeneous linewidth. Adsorption and emission of photons at both frequencies leads to oscillation of the spin population at  and to the production of intermodulation sidebands at
 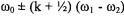 where
where  is the average frequency and k is a positive integer. These new microwave frequencies, generated by the spin system, are recorded. This requires spectrally-pure irradiation sources with spurious signals at 70 db. It has been shown (Mchaourab et al., 1991; Christides et al., 1996; Mchaourab, 1994; Hyde et al., 1995) that using the MQ-ESR approach has several advantages. (1) Detection of pure absorption lines, not derivative-like shapes, (2) spectral intensities proportional to
  and (3) reduced linewidths. For the ELDOR measurement, the effect of pumping one transition by a pair of frequencies is observed by detecting sidebands generated on another transition using a weak observing microwave field. These MQ-ELDOR experiments have become technically feasible because of the development of loop-gap resonators. The measurement provides a signal that is a measure of the transfer of magnetization and not a reduction factor as measured in a field-swept

ELECTRON-ELECTRON DOUBLE RESONANCE |
177 |
ELDOR. The magnetization is coded by sinusoidal modulation and its steady-state spectral diffusion is monitored.
2.10Spin Label Oximetry
The term spin label oximetry refers to the use of nitroxide radical spin labels to monitor oxygen transport. Both the longitudinal  and transverse
  relaxation times of the spin label are altered by bimolecular collisions with oxygen. Various experiments can be used to observe these effects. Particular examples described by Hyde et al. (1990) include (a) saturationrecovery time-domain EPR using high observing power from a S band saturation-recovery apparatus and (b) ELDOR as an oxygen sensitive display. The ELDOR method is a simpler approach since the saturationrecovery time-domain requires a pulse instrument in the laboratory.
Introduction of molecular oxygen shortens the effective  and diminishes the ELDOR effect. To observe oxygen transport, conditions must exist to give a strong ELDOR effect in the absence of oxygen. For example a
  M concentration of the spin label CTPO (3-carbamoyl- 2,2,5,5-tetramethyl-3-pyrrolin-1-yloxy) in water is optimum to observe strong ELDOR signals. Oxygen transport is studied by controlled introduction of various oxygen mixtures such as 30% and 40% molecular oxygen and studying ELDOR reductions. A plot of
  vs.
vs.  concentration will yield a straight line where the extrapolated intercept at 0%
 equals
  and the slope equals
  Here
Here  factor at infinite microwave power,
  constant for Heisenberg exchange between oxygen and the spin label,
  is the bimolecular collision rate of oxygen with spin labels, and
  Studying oximetry using ELDOR has an advantage in that only changes in
  affect the ELDOR signal when bimolecular collisions take place. Changes in
  do not enter the problem nor does one need to know about the
  of the spin label. The effect depends only on transfer of saturation and analysis of the
  component of magnetization using the rate equation
2.11Time locked subsampling
Time locked subsampling (TLSS) has been used in three forms of pulsed EPR measurement at X-band frequency; saturation recovery, pulsed ELDOR and free induction decay. It was developed very recently (Froncisz et al., 2001) to monitor bimolecular collisions of oxygen with spin labels. This
178 |
LOWELL D. KISPERT |
method involves (1) the translation of the signal from a microwave carrier to an intermediate frequency (IF) carrier where the IF offset between the signal oscillator and local oscillator was synthesized (2) sampling the IF carrier four times in an odd number of cycles, (3) signal averaging for best signal- to-noise ratio, (4) separating the even and odd digitized words into two separate signal channels; signals in-phase and in-quadrature (Q) with respect to the IF carrier, and (5) detecting the envelope of I and Q by changing the signs of alternate words in each of the two channels.
A central advantage of TLSS detection of pulsed ELDOR is the ability to acquire both the dispersion and the absorption simultaneously with essentially perfect relative phasing. It is now possible with computer control of the spectrometer and acquisition and storage of transient signals to record spectra continuously as a function of magnetic field across the entire spectrum. This will enable one to study the superposition of two spin label spectra with different motions and different accessibilities to oxygen for site directed spin labeling. Such three - dimensional data could permit the sorting out of the oxygen accessibility of each spin label environment. These measurements would require specialized modification to existing pulsed ELDOR equipment and is available at the National Biomedical EPR Center, Medical College of Wisconsin, Milwaukee, Wisconsin.
2.12Power Saturation Method-SR-ELDOR
Power saturation methods by Haas, (1993) have been described and used along with SR-ELDOR (saturation recovery ELDOR) measurements to extract multiple rates from recovery curves. It is not possible to separate
 and the characteristic rotational correlation rate from one another
with SR-EPR measurements alone when multicomponent exponential decays occur. However use of SR-ELDOR techniques, these rates are measured directly.
2.13Pulsed ESR/Pulsed ELDOR
A pulsed ELDOR method was devised by Schosseler, Wacker and Schweiger, (1994) to excite allowed and forbidden transitions, thereby burning spectral holes into the EPR line. The holes caused by excitation of the forbidden transitions correspond to nuclear transition frequencies of the spin system. This makes it possible to determine small hyperfine couplings in disordered systems.
ELECTRON-ELECTRON DOUBLE RESONANCE |
179 |
2.142D-Correlation Spectroscopy
A pulsed 2-dimensional (2D) Fourier transform ESR spectrometer has been described by Gorcester and Freed (2001) and its application to study motionally narrowed nitroxides using a two-pulse experiment (COSY) or a three-pulse experiment (2D ELDOR). Cross correlations between hyperfine lines were observed. Heisenberg exchange rates deduced by this method for PD-tempone agreed with those deduced by spin echo  measurements as a functions of nitroxide concentration. This broadband irradiation of the entire spectrum offers substantial savings in data acquisition time and potentially yields more information than the analogous field-swept experiment.
2.152D-Techniques Theory
A comprehensive theory as sophisticated as that used for analyzing CWEPR spectra has been published by Lee, Budil and Freed (1994) for interpreting two-dimensional Fourier Transform (2-D-FT). The theory includes motional rates from fast to slow motions, and microscopic as well as macroscopic molecular ordering. The theory is appropriate for COSY, SECSY and 2-dimensional-ELDOR where either the free-induction decay (FID) or echo decay is sampled. This theory has been applied to simulated experiments of nitroxide spin labels in membrane vesicles where microscopic molecular ordering but macroscopic disorder (MOMD) applies. Recovery of homogenous linewidths from FID-based COSY experiments on complex fluids was also demonstrated. Application to nitroxide probes illustrated that rotational correlation times as slow as milliseconds can be measured.
Employing 2-D-ELDOR measurements, Maresch et al. (1992) showed it was possible to measure magnetization transfer (electron spin diffusion, nuclear relaxation and slow rotational diffusion) throughout the EPR spectrum by using a narrow-band microwave excitation pulse followed by a rapid magnetic field step. Both the pumping and detecting fields were swept. It was observed that the magnetization transfer between states with close molecular orientations but different nitrogen nuclear spin projections dominated. A formalism developed by Gamliel and Freed (1990) for computing 2D ESR lineshapes with nuclear modulation (ESR-COSY, ESRSECSY and 2D ELDOR) has been reported for polycrystalline and singlecrystal samples. The method gives more detailed structural information than the corresponding ESEEM spectra.