

Biomedical EPR Part-B Methodology Instrumentation and Dynamics - Sandra R. Eaton
.pdfEPR INTERFACED TO RAPID MIXING |
59 |
oximetry thus presented a novel method for studying oxygen-limited kinetics in the submicromolar oxygen regime where rapid kinetic methods had not been previously applied.
Figure 4. This trace provides the details of oxygen consumption by  cytochrome c oxidase in the presence of excess ferrocytochrome reductant after the point in time, which was about 7.5 s after mixing, where oxygen became rate limiting; concentration of CTPO was
  The line
  above the baseline is the estimate of the point where the slope went to half its initial value and where oxygen itself became rate limiting. (Figure reprinted with permission from Jiang et al., 1992; Copyright 1992 American Chemical Society.)
2.2Application of LGR-Based Stopped-Flow EPR to Time-Resolved Spin Trapping of Hydroxyl Radicals
Hydrogen peroxide in the presence of ferrous ion had long been known as a strong oxidizing agent (Fenton, 1894). Fenton’s reagent  generated highly reactive oxidizing hydroxyl radicals (Buettner, 1987), and toxicity from oxidative stress has been attributed to the highly reactive hydroxyl radical (Halliwell and Gutteridge, 1989). The overall reaction: had been proposed as a major source of reactive, short-lived, toxic radicals, especially the
  that damage membranes and DNA (Tullius, 1988).
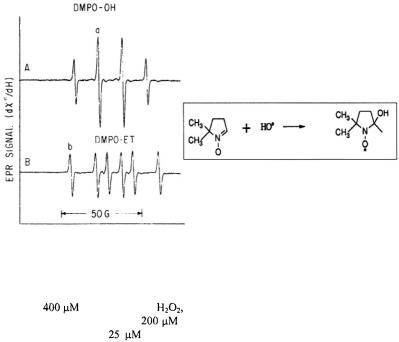
  radical can be identified by spin trapping since its spin-trap adduct shown in Figure 5 give a characteristic, stable EPR signal. The upper spectrum in Figure 5A is that of the spin-trapped DMPO-OH adduct following its reaction with
60 |
CHARLES P. SCHOLES |
Figure 5. This figure provides traces of the spin trapped DMPO-OH and DMPO-ET, which are respectively the spin adducts of  and the ethanol a-radical as taken approximately 1 min after mixing reactants. Spectrum A resulted from 1:1 mixing of a solution containing 40
mM DMPO, |
EDTA, 1.2 mM |
in 40 mM pH 7.4 phosphate buffer, 150 mM KCl |
|
with a second solution containing |
|
ferrous ammonium sulfate in 150 mM KCl. This |
|
spectrum contained |
about |
DMPO-OH spin adduct. Spectrum B is from the spin |
|
trapped DMPO-ET adduct; reactants to create DMPO-ET were the same as those of DMPOOH except that the solution after mixing contained 1.65 M ethanol. This spectrum contained  DMPO-ET. (Figure reprinted with permission from Jiang et al., 1993; Copyright 1993 American Chemical Society.)
When they are trapped, other reactive secondary radicals also instigated by Fenton chemistry give their own characteristic signatures as shown for DMPO-ET in Figure 5B, where DMPO-ET is the DMPO spin trapped adduct of the ethanol  (Yamazaki and Piette, 1990). Fe(II)-EDTA in the presence of
  provided a source of hydroxyl radicals whose rapid kinetic creation ended in less than a second [Jiang, 1993 #12]. These kinetic changes were followed by observing the change of the derivative peak of the appropriate DMPO spin adduct. Thus time resolved spin trapping using the LGR system provided evidence for rapid trapping of Fenton radicals such as shown in Figure 6A. With ability to directly detect kinetics of radical creation in a time regime not previously studied, we measured the initial rates of radical production and avoided the complications of later chain and side reactions (with which Fenton chemistry is replete). The initial rate of trapped
  radical production was linearly dependent on both the initial Fe(II)-EDTA concentration and on the initial
  concentration so that a second-order rate constant for production of trapped
  was easily

EPR INTERFACED TO RAPID MIXING |
61 |
determined (Jiang et al., 1993). A comparison of the DMPO-OH trapping (trace 6A on a 1 s time scale) with DMPO-ET (trace 6B on a 3.5 s time scale) showed that the build-up of DMPO-ET took longer than that of DMPO-OH and did not simply parallel the production of trapped hydroxyl radical. In summary, stopped-flow EPR carried out with the LGR-based stopped-flow system gave time resolution to follow in well under 100 ms the initial kinetics of spin trapped adducts at micromolar concentrations and in microliter samples.
Figure 6. Kinetic transients obtained by spin trapping. (A) Time resolved spin trapped  from DMPO-OH as it appeared from a solution after mixing that contained 150 mM KCl, 20 mM pH 7.4 phosphate buffer, 20 mM DMPO,
  Fe(II),
  EDTA, and
 (B) Time resolved spin trapped ethanol radical from DMPO-ET as it appeared over 3.5 s. Concentrations of reactants were as in A except that the solution contained 1.65 M ethanol. (Figure reprinted with permission from Jiang et al., 1993; Copyright 1993 American Chemical Society.)

62 |
CHARLES P. SCHOLES |
3.DIELECTRIC RESONATOR-BASED STOPPEDFLOW EPR
3.1Technical Development
Richtmyer (Richtmyer, 1939) first pointed out that unmetallized dielectric objects can function as resonators. By the late 1970’s low loss barium tetra-titanate materials with high temperature stability in resonance frequency were becoming available (Cohn, 1968; Plurde et al., 1975; Plurde
and Ren, 1981) A disk-shaped dielectric resonator (DR) |
operating in the |
mode will have a vertical microwave magnetic field |
extending up |
through its center where the sample is located and will confine the electric field  within the dielectric disk. Several different versions of DR-based EPR resonators were reported (Dykstra and Markham, 1986; Walsh and Rupp, 1986; Bromberg and Chan, 1992), most notably the EPR application of Dykstra and Markham (1986) which, when applied to small point and liquid samples, yielded more than two orders of magnitude higher EPR signals than a standard
  EPR cavity.
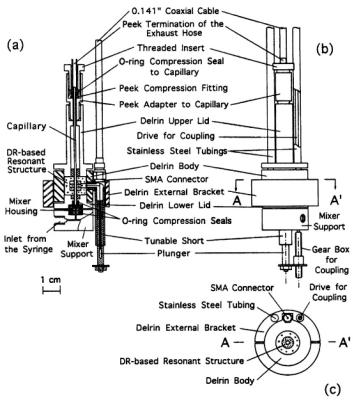
The DRs which formed the heart of the microwave resonant probe, developed by (Sienkiewicz et al., 1994) and shown in Figure 7, were lossfree, high dielectric ceramics made of zirconium titanate  MuRata Inc., DRT series). Incorporating small size and a high sample filling factor, they were toroids, of 6 mm o.d. and 2.5 mm height with a 1-2 mm sample hole. The DRs were enclosed in a cylindrical shield consisting of silvered Rexolite 1422 plastic (C-LEC Plastic, Inc., Beverly, NJ) with top and bottom lids of copper foil and a top and bottom sample tube guidance provided by brass inserts. (We have recently discovered that the Q of the resonant structure can be increased several fold by using high conductivity silver foil as an outer shield rather than silver paint; with this procedure adequate field modulation is admitted via fine slits around the circumference of the shield.) Our primary resonator consisted of two stacked ceramic DRs separated by a (nonsilvered) spacer of low dielectric Rexolite; varying the size of the spacer varied the resonator frequency and provided a larger EPR active zone. We called this DR configuration a double-stacked DR. A critical feature of any resonant structure for EPR is its coupling to the microwave transmission line. Stopped-flow experiments involve rapid sample movement through the sample capillary and concomitant vibrations; thus the coupling and matching structures needed to be remote from the sample capillary to avoid microphonic disturbance of them. To couple magnetically to the
  mode of the DR, we used an antenna loop oriented with its plane perpendicular to axis of the cylindrical dielectric shield. The coupling loop was connected by a short section of semi-rigid coax to a modified SMA connector, which in
EPR INTERFACED TO RAPID MIXING |
63 |
turn formed the center of a T-shaped structure whose three arms were the incoming microwave transmission line, the coupling loop, and our coaxial tuner. The latter tuner, based on a smoothly adjustable short, modified the coupling between resonator and microwave line. The resonant structure and the tuning drive were rigidly fastened by a plastic (Delrin) support to standard X-band wave guide so that the probe could directly replace a typical microwave cavity in a conventional EPR spectrometer. Separate 100 KHz external modulation coils (Medical Advances) were initially used, and more recently, 100 KHz modulation coils were incorporated into the Delrin support structure.
Figure 7. DR-based EPR probe for stopped-flow showing: (a) The cross-sectional view of the Delrin body and of the DR-based resonant structure including the coupler. (b) Front view of the EPR probe showing the supporting stainless steel tubing, the microwave line (0.141 in. coaxial cable), the Delrin bracket, and the gearbox for tuning. (c) Horizontal cross section (A - A’) with the location of the supporting stainless steel tubings and of the central part of the SMA connector. Figure reprinted with permission from Sienkiewicz et al. (1994).
64 |
CHARLES P. SCHOLES |
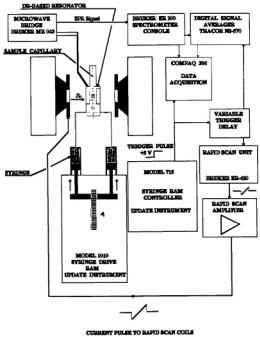
Our initial EPR probe contained a commercially available Wiskind grid mixer and mixer support (Update Instrument, Madison, WI,) similar in design, dead volume, and location to that used with the LGR system of Hubbell et al. (1987). The liquid mixer and mixer support system were attached to the resonator body by brass screws, and in later versions, coils for coolant were integrated into the mixer support. The overall schematic of the system which also includes rapid field scan coils is shown in Figure 8.
Figure 8. Schematic of the flow and stopped-flow probe interfaced to a Bruker ER-200 D- SRC EPR spectrometer and to a data collection system based on Scientific Software Services Systems software. Figure reprinted from Sienkiewicz et al. (1999) with permission from Elsevier Science Publishers.
The unloaded Q of the DR probe was ~1800 and the loaded Q with an aqueous  TEMPO sample (0.6 mm i.d. 0.84 mm o.d. sample tube, EPR active volume
  was ~1000. The EPR signal from the double stacked DR was compared with that from a standard Bruker
  cavity with the same sample, at the same incident non-saturating microwave power, and with the same field modulation (Jaworski et al., 1997). For a point DPPH sample the signal from the DR was fifty-fold larger and for a TEMPO line sample 3 cm long the signal from the DR was thirty-fold larger.

EPR INTERFACED TO RAPID MIXING |
65 |
Calculations of Jaworski et al. (1997) showed that the filling factor for the
DR was two orders of magnitude larger than for the |
cavity because the |
DR highly concentrated the microwave magnetic field, |
on the sample. In |
a comparison of saturation behavior of TEMPO in DR devices and the LGR as well to that in the  cavity (Sienkiewicz et al., 1994), the TEMPO EPR signal reached its maximum amplitude at about 5 mW in the DR and
LGR and at about 100 mW in the |
The implication is that the |
field |
|
in the former two devices was 4-5 times larger than in the |
at the same |
||
microwave power. The maximum amplitude saturable TEMPO signal at ~5 mW from the DR was about 1.7 times bigger than the maximum amplitude signal from the  at ~100 mW. Because of its higher Q and comparable filling factor, the signal-to-noise in the absorption mode from the DR was ~25-50 % higher than that from the LGR. (See Table I of Sienkiewicz et al. (1994).) Under such absorption conditions, detector noise is the limiting noise source. On the other hand the signal-to-noise for high power dispersion
  EPR was better for the LGR whose low Q makes it a less sensitive demodulator of klystron FM noise.
For small liquid samples of the size and shape used in stopped-flow measurements, the EPR sensitivity and ease of DR operation in the commonly used AFC-locked absorption mode represented an advantage for the DR. The DR isolated the sample from the electric part of the microwave field and concentrated the microwave magnetic field on the sample. Compared to the LGR, which has fringing electric fields near its gap, such a DR offered a better separation of  away from the sample position. The resonator frequency shift for the DR upon insertion of the water-filled EPR tube was only 3 MHz vs >100 MHz for the LGR; this was practical proof of the isolation of the microwave electric field from the sample. This isolation contributed to the insensitivity of the DR to flow and stopped-flow-induced sample tube movements. We consider the LGR-based stopped-flow system of Hubbell et al. (1987) as the seminal step in mini resonator design for flow and stopped-flow, but in relation to our aim of elucidating kinetics on the sub-10 ms time scale, we concluded that that the DR-based system was less sensitive to flow-induced transients. (See Figure 6 of Sienkiewicz et al. (1994).)
In summary, the major benefits of the DR system were: 1) It incorporated a small, high sensitivity resonator system that was insensitive to stoppedflow induced noisy transients. 2) The DR system was cheap, robust, and easily assembled. 3) It contained a microwave coupling scheme based on an adjustable short and coupling loop that provided finesse in tuning and freedom from microphonics. It is this system which we subsequently used in our first application to protein folding (Qu et al., 1997), whose frequency and loss characteristics we have modeled (Jaworski et al., 1997), and which we have modified with rapid field scan in order to obtain more complete information on overall spectra (Sienkiewicz et al., 1999).
66 |
CHARLES P. SCHOLES |
3.2Application of DR-Based Stopped-Flow EPR to the Folding of Cysteine-Specifically Labeled Cytochrome c
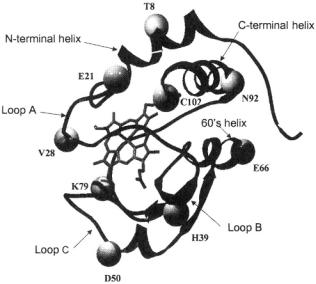
Cytochrome c is a globular heme protein of 12.5 kDa molecular weight which has been a paradigm subject for folding. Yeast iso-1-cytochrome c (iso-1-cyt c), which is the explicit system we study, has a known crystal structure, shown by the ribbon diagram of Figure 9.
There are three helices, termed the N-terminal, C-terminal, and 60’s helices (Louie and Brayer, 1990), and four omega loops, A, B, C, and D (Leszczynski and Rose, 1986; Fetrow et al., 1989). Using stopped-flow methods, the folding of cytochromes was first followed from optical changes at the heme and from heme-induced tryptophan fluorescence quenching emanating from the sole Trp59. Fluorescence quenching reported overall compacting of the cytochrome structure (Tsong, 1976; Nall and Landers, 1981; Brems and Stellwagen, 1983).
Figure 9. This figure is a ribbon diagram of yeast iso-1-cyt c showing loop and helical regions and the positions where we have recently (DeWeerd et al., 2001) created cysteine-directed labeling positions. (Note loop D happens to be hidden in this presentation.) C102 is the naturally occurring cysteine that was initially labeled. Figure reprinted with permission from DeWeerd et al. (2001); Copyright 2001 American Chemical Society.
EPR INTERFACED TO RAPID MIXING |
67 |
NMR-monitored deuterium-hydrogen exchange following quenched-flow provided evidence for folding-induced formation of stable secondary helical structures (Roder et al., 1988). These stopped-flow and quenched flow techniques using standard rapid mixers routinely had millisecond or longer dead times. There were at least three exponential phases observable by all these techniques (Nall and Landers, 1981; Brems and Stellwagen, 1983; Colón et al., 1996): a fast phase in the 5-100 ms range, an intermediate phase in the 0.5-1 s range, and a minor slow phase in the 5-25 s range. NMR-monitored deuterium-hydrogen exchange of amide protons subsequent to a quenched-flow procedure indicated that the 5-100 ms phase represented nucleation-collapse of the N-C terminal helices (Roder et al., 1988; Elöve et al., 1992; Elöve et al., 1994; Englander et al., 1998). The intermediate 0.5-1 s phase was attributed to states trapped with improper heme-histidine ligation that convert into properly folded protein following dissociation of the non-native histidine iron ligands (Sosnick et al., 1994; Colón et al., 1997). The slowest 5-25 s phase is most likely due to cis/trans isomerization of prolyl peptide bonds (Osterhout and Nall, 1985). These previous findings have in many cases not provided information on the particular sites where we have recently attached labels at position in Figure 9 above and Table 1 below (DeWeerd et al., 2001), and the information which we have obtained from these labelling sites goes beyond just amplifying pre-existing information.
There also were changes occurring within the dead time of a standard rapid mixer, too early explicitly to be measured. What was initially called a “burst” stage  of folding was suggested to be formation of a compact state with incompletely defined helical structure (Creighton, 1994; Colón et al., 1996; Sosnick et al., 1997). The explicit elucidation of very early submillisecond folding/compaction has been the subject of intense investigation (Winkler and Gray, 1998). Folding/compaction may start as early as
  after initiation of folding, although specifically where and how is a subject for our own research. A question fundamental to the protein folding process that we aim to answer by probing at numerous spin labeled sites is whether early folding is simply a response of a polymer to change in solvent quality (Englander et al., 1998) or whether it represents early folding events with specific energy barriers, pathways, and activation energies (Shastry and Roder, 1998; Shastry et al., 1998).
3.3Iso-1-Cyt c Labeled at its Naturally Occurring Cys102 – Characterization and Stopped-Flow
Following the development of dielectric resonator-based stopped flow EPR (Sienkiewicz et al., 1994), we monitored the kinetics of protein folding
68 |
CHARLES P. SCHOLES |
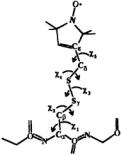
as the folding altered the mobility of a cysteine-specific spin label, methanethiosulfonate spin label, MTSSL in Figure 10 (Qu et al., 1997). The spin label for this initial study was attached at the sole cysteine (Cys102) naturally occurring within the C-terminal helix of yeast iso-1-cyt c. We called the spin labeled wild type iso-1-cyt c C102-SL. The spin label attached to unfolded protein demonstrated sub-nanosecond mobility and
Figure 10. This figure shows the MTSSL spin-label attached to the cysteine sulfur via a disulfide linkage. The angles  are angles about which rotation may occur. In the folded protein it appears that free motion only occurs about
  and
and 
sharp, intense derivative EPR features. The label on the folded protein was more encumbered by its environment and showed broader and less intense derivative EPR features indicating nanosecond or longer tumbling times. (The tumbling time for cytochrome c itself in aqueous buffer at room temperature is ~3 ns.) Figure 11 illustrates the sharpening of the spin label derivative EPR signal under denaturing conditions and compares the signals of folded and chemically or thermally denatured C102-SL.
Stopped-flow EPR of C102-SL revealed a mono-exponential, guanidinium-induced unfolding process; a ~20 ms unfolding time occurred in the presence of 2 M guanidinium (GdnHCl) denaturant, as shown in Figure 12. When this unfolding was compared by stopped-flow EPR of the spin label reporter and by stopped-flow UV-Vis of the heme, a nearly identical single-exponential time dependence was measured by both spin label and UV-Vis spectroscopy (Qu et al., 1997). Unfolding has generally been found to exhibit this global, single exponential unfolding, reported similarly by all types of spectroscopy monitoring different sites.