

Molecular and Cellular Signaling - Martin Beckerman
.pdf154 |
7. Two-Component Signaling Systems |
|
||
TABLE 7.6. Light-sensitive proteins and their distribution. |
|
|||
|
|
|
|
|
Sensor protein |
Chromophore |
lmax (nm) |
Distribution |
|
Rhodopsins |
Retinal |
500 |
Animals |
|
Phytochromes |
Tetrapyrrole |
665, 730 |
Bacteria, protists, plants |
|
Cryptochromes |
Flavins |
400–500 |
Plants, insects, mammals |
|
|
|
|
|
|
tor. If the ligand is not present, the receptor is in an “on” state and sends signals through the MAP3 kinase CTR1. The activated CTR1 proteins negatively regulate transcription of ethylene response genes. When ethylene is present in the environment, the receptor state is “off”, and it can no longer activate CTR1. Turning off CTR1 relieves the repression by CTR1 of transcription of ethylene response genes.
7.12 Role of Growth Plasticity in Plants
Plants retain a great deal of plasticity in their growth and developmental programs and tie these programs to environmental cues such as lighting. In plants, light sensing is used to guide developmental, morphological, and physiological responses, whereas in animals light sensing guides behavioral responses. Plants are responsive not only to light intensity, but also to its orientation and duration, and its spectral properties. Light sensing enables plants to project growth into well-illuminated spaces and away from regions shaded by other plants. Light sensing allows plants to synchronize, or entrain, their growth and developmental rhythms with daily and seasonal cycles. It enables plants to arrive at decisions on when to germinate and when to flower, for example.
Light sensing by plants is an activity distinct from photosynthesis. Sensing of light in plants is achieved using two kinds of photoreceptors— phytochromes and cryptochromes (Table 7.6). These molecules, like the rhodopsin molecules found in the rods of the animal eye, contain a light absorbing group, or chromophore, that alters its conformation upon absorbing light of the appropriate wavelength. The conformational changes are sent on to other signaling elements to complete the transduction of the light signal into intracellular signal events.
7.13 Role of Phytochromes in Plant Cell Growth
Phytochromes are red/far-red photoreceptors that initiate developmental and proximity responses to light. Phytochromes exist in two forms. One form operates as a red photoreceptor with peak absorption at 665 nm, and the other as a far-red photoreceptor with peak absorption at 730 nm. Light absorption triggers the conversion of one form to the other. The red light
7.13 Role of Phytochromes in Plant Cell Growth |
155 |
absorbing form is designated as Pr and the far red light form as Pfr. When the red form (Pr) absorbs light it is converted into the far-red form Pfr, and similarly, when the far-red form (Pfr) absorbs light it is converted to the red form Pr. The ratio of these two forms is a measure of the amount of red light incident on the plant compared to the amount of far red light. Direct sunlight provides more red than far red light, but the light characteristics change when surrounding foliage shades the plant. Then the light shifts towards the far red. Thus, during exposure to direct sunlight Pfr will predominate in the leaves and when shaded Pr will be more abundant.
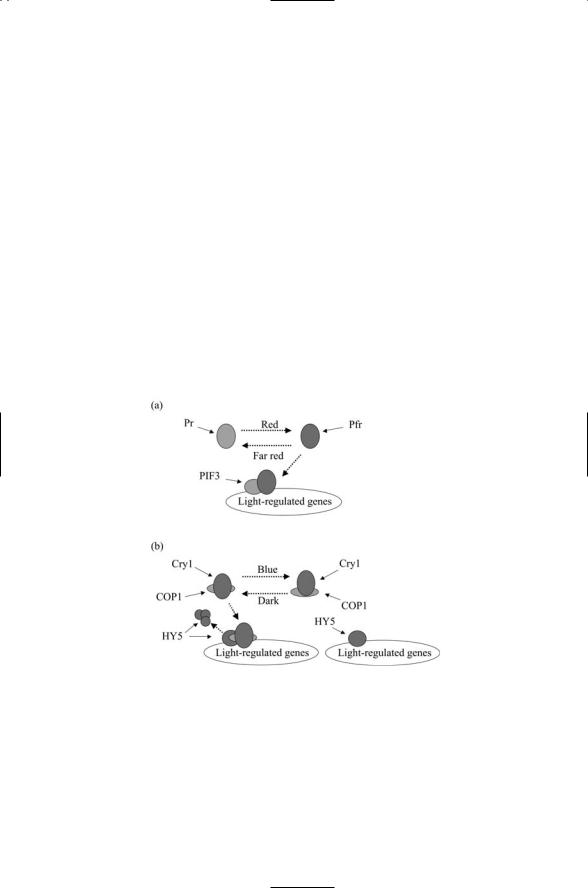
The signaling pathway leading to alterations in gene expression has been explored in Arabidopsis. The pathway is direct and short. Using green fluorescent protein it has been found that the Pfr form, but not the Pr form, translocates to the nucleus. Upon arrival, the Pfr form interacts with a transcription factor PIF3. The interaction of Pfr with PIF3 triggered by the red light influences a large number of cellular signaling and metabolic pathways. As observed using microarrays, some pathways are turned on while others are turned off (Figure 7.8a).
Phytochromes are not limited to plants. They are found in photosynthetic bacteria and in protists (algae). Cyanobacterial phytochromes are histidine
FIGURE 7.8. Phytochrome and cytochrome signal transduction: (a) Phytochrome signaling, in which the active form of the light receptor Pfr acts in conjunction with the transcription factor PIF3 to regulate the expression of light-regulated genes.
(b) Cytochrome signaling, in which expression of (blue) light-sensitive genes is turned off under dark conditions. The blue light receptor in conjunction with the regulator COP1 translocates to the nucleus where COP1 stimulates the proteolysis of the transcription factor HY5. Under blue light conditions the Cry1/COP1 complex remains in the cytosol and COP1 cannot inhibit HY5-mediated transcription.

156 7. Two-Component Signaling Systems
kinases that relay signals to aspartyl response regulators. The plant phytochromes appear to have replaced a histidine kinase activity with a serine/threonine kinase one. The transformed kinases still exhibit many of the characteristics of histidine kinases, supporting the notion of a bacterial origin. These signaling proteins are thus regarded as divergent histidine kinases that along with some of the ethylene receptors lack some of the amino acid residues necessary for histidine kinase activity.
7.14Cryptochromes Help Regulate Circadian Rhythms
Cryptochromes are blue/ultraviolet-A photoreceptors that help regulate circadian rhythms. They have a peak absorption in the range 400 to 500 nm. They are found not only in plants, but also in insects and mammals. The cryptochrome signaling pathways regulate physiological processes such as the setting of period and phase of an organism’s internal circadian clock so that internal body rhythms match those present in the external environment (daily and seasonal). This process is called entrainment.
Like the phytochrome signaling pathway, the cryptochrome signaling pathway is direct and short. The control point at the end of the signaling pathway is one that regulates transcription, but it is not a transcription factor at the promoter site as in the case of the phytochromes. Instead blue light photoreceptors remain bound to a transcription regulator called COP1. The COP1 protein regulates the activity of transcription factor HY5 that stimulates transcription of a large number of genes. When it is activated, COP1 tags HY5 for degradation by proteolytic proteins in the nucleus, and thus COP1 inhibits the ability of the HY5 protein to stimulate transcription.
The C-terminal domain of Cry1, Ctt1 binds to COP1 under both dark and light conditions. In the dark COP1 is localized predominantely in the nucleus and in light it becomes mostly cytosolic. The blue-light transcription factor HY5 is localized in the nucleus under both kinds of illumination. When blue light strikes the Cry1 photocenter, conformational changes occur in COP1 altering its cellular location and turning off its inhibition of HY5. In blue light conditions, HY5 escapes being tagged for destruction, and is then able to stimulate transcription (Figure 7.8(b)).
In this form of regulation, the presence or absence of blue light modulates the effective lifetime of the HY5 protein. This form of regulation is a fairly common one. It is fast because no lengthy protein synthesis steps are required. Rapid modulatory actions in a signaling pathway can take one of several forms. They can involve immobilizing a signal protein at a particular location, or they may involve proteolytic degradation of a signaling element as in the case of cryptochrome signaling. One form of regulation by localization already encountered in this and the previous chapter is the

References and Further Reading |
157 |
sequestering of transcription factors in the cytosol and away from the nucleus until the appropriate signal is received.
References and Further Reading
Histidine Kinases
Bilwes AM, et al. [1999]. Structure of CheA, a signal-transducing histidine kinase. Cell, 96: 131–141.
Mourey L, et al. [2001]. Crystal structure of the CheA histidine phosphotransfer domain that mediates response regulator phosphorylation in bacterial chemotaxis. J. Biol. Chem., 276: 31074–31082.
Response Regulators
Baikalov I, et al. [1996]. Structure of the Escherichia coli response regulator NarL. Biochem., 35: 11053–11061.
Birch C, et al. [1999]. Conformational changes induced by phosphorylation of the FixJ receiver domain. Structure, 7: 1505–1515.
Feher VA, and Cavanagh J [1999]. Millisecond-timescale motions contribute to the function of the bacterial response regulator protein Spo0F. Nature, 400: 289–293.
Kern D, et al. [1999]. Structure of a transiently phosphorylated switch in bacterial signal transduction. Nature, 402: 894–898.
Lewis RJ, et al. [1999]. Phosphorylated aspartate in the structure of a response regulator protein. J. Mol. Biol., 294: 9–15.
Stock J, and Da Re S [2000]. Signal transduction: Response regulators on and off. Curr. Biol., 10: R420–R424.
Volkman BF, et al. [2001]. Two-state allosteric behavior in a single-domain signaling protein. Science, 291: 2429–2433.
Chemotaxis Receptors
Falke JJ, and Hazelbauer GL [2001]. Transmembrane signaling in bacterial chemoreceptors. Trends Biochem. Sci., 26: 257–265.
Mowbray SL, and Sandgren MOJ [1998]. Chemotaxis receptors: A progress report on structure and function. J. Struct. Biol., 124: 257–275.
Ottemann KM, et al. [1999]. A piston model for transmembrane signaling of the aspartate receptor. Science, 285: 1751–1754.
West AH, and Stock AM [2001]. Histidine kinases and response regulator proteins in two-component signaling systems. Trends Biochem. Sci., 26: 369–376.
Volz K [1993]. Structural conservation in the CheY superfamily. Biochem., 32: 11741–11753.
Feedback, Methylation, and Robust Behavior
Barkai N, and Leibler S [1997]. Robustness in simple chemical networks. Nature, 387: 913–917.
Djordjevic S, et al. [1998]. Structural basis for methylesterase CheB regulation by a phosphorylation-activated domain. Proc. Natl. Acad. Sci. USA, 95: 1381–1386.

158 7. Two-Component Signaling Systems
Djordjevic S, and Stock AM [1997]. Crystal structure of the chemotaxis receptor methyltransferase CheR suggests a conserved structural motif for binding S- adenosylmethionine. Structure, 5: 545–558.
Yi TM, Huang Y, Simon MI, and Doyle J [2000]. Robust perfect adaptation in bacterial chemotaxis through integral feedback control. Proc. Natl. Acad. Sci. USA, 97: 4649–4653.
Receptor Clusters and Formation of a Primitive Nose
Liu Y, et al. [1997]. Receptor-mediated protein kinase activation and mechanism of transmembrane signaling in bacterial chemotaxis. EMBO J., 16: 7231–7240.
Levit MN, Liu Y, and Stock JB [1998]. Stimulus response coupling in bacterial chemotaxis: Receptor dimers in signaling arrays. Mol. Microbiol., 30: 459–466.
Duke TAJ, and Bray D [1999]. Heightened sensitivity of a lattice of membrane receptors. Proc. Natl. Acad. Sci. USA, 96: 10104–10108.
Shimizu TS, et al. [2000]. Molecular model of a lattice of signaling proteins involved in bacterial chemotaxis. Nature Cell Biol., 2: 792–796.
Plant His-Asp Signaling
Cashmore AR, et al. [1999]. Cryptochromes: Blue light receptors for plants and animals. Science, 284: 760–765.
Lohrmann J, and Harter K [2002]. Plant two-component signaling systems and the role of response regulators. Plant Physiol., 128: 363–369.
Neff MM, Fankhauser C, and Chory J [2000]. Light: An indicator of time and place. Genes Dev., 14: 257–271.
Smith H [2000]. Phytochromes and light signal perception by plants—An emerging synthesis. Nature, 407: 585–591.
Young MW, and Kay SA [2001]. Time zones: A comparative genetics of circadian clocks. Nat. Rev. Genet., 2: 702–715.
Problems
7.1A significant number of the proteins discussed in the last two chap- ters—kinases, phosphatases, GTPases, and proteases—are enzymes. Catalysts increase the rate of the reactions by many orders of magnitude, but are not themselves altered during catalysis. In their absence the biochemical reactions to be catalyzed are too slow because of unfavorable mixes of positive and negative charges that have to be brought into close proximity at the transition state long enough for the reaction to occur. As was discussed in the chapter, the histidine kinases not only grip and position the ATP in a favorable orientation for transfer of the gamma phosphoryl group, they also modify the electrostatic environment. Negative charges of the phosphoryl group are countered by the positive charges of the divalent magnesium cation; a nucleophile is present to break bonds, and the cleft at the active site in laced with charged residues. These activities help stabilize the transition state, and in the process lower the activation barrier for the transition to the final state. This lowering is depicted schematically in the figure shown below.

Problems 159
FIGURE for Problem 7.1. Uncatalyzed and catalyzed transition states.
The equation shown to the right of the figure defines the three rates involved in the catalytic process. Kinetic equations governing the catalysis can be constructed by applying the law of mass action. The resulting expressions in terms of enzyme and substrate molar concentrations are
d[E] |
= -k1 [E][S]+ k-1 [ES]+ k2 [ES], |
||
dt |
|||
|
|||
d[S] |
|
= -k1 [E][S]+ k-1 [ES], |
|
dt |
|||
|
|||
d[ES] = k1 [E][S] - k-1 [ES] - k2 [ES], dt
where the k’s are the reaction rates.
The amount of enzyme is usually far less than the amount of substrate and is completely bound up by the substrate. As a result one can make the steady state assumption that
d[ES] = 0. dt
Using the above formulas, derive the Michaelis–Menton equation
Vmax [S]
V0 = KM + [S] ,
where Vmax is equal to k2 ·([ E] + [ES]), the Michaelis constant KM = (k1 + k-1)/k2, and the steady state velocity V0 is k2[ES].
Plot V0 versus [S]. What happens at high [S]? It is customary to determine the constants appearing in the Michaelis–Menton equation by making measurements of V0 values at different substrate concentrations [S] and arranging the data in the form 1/V0 versus 1/[S]. What does a plot of 1/V0 versus 1/[S] look like? What is the slope and what is the intercept?

8
Organization of Signal Complexes by Lipids, Calcium, and Cyclic AMP
Cytoplasmic signaling proteins are recruited to the cell plasma membrane in response to signals sent from other cells. The recruited signal molecules are organized into modules and complexes, and the first steps in converting the extracellular signals into cellular responses are taken. Several kinds of small signaling molecules, most notably, lipids, calcium, and cyclic adenosine monophosphate (cyclic AMP, or cAMP), act as signaling intermediaries. They tie together events taking place subsequent to ligand binding by helping to recruit and organize the proteins that function as the primary intracellular signal transducers. Because of their role as signaling intermediaries, the small molecules are commonly termed “second messengers,” the first messengers being the extracellular signal molecules, and the third messengers being the large protein kinases and phosphatases that are recruited to the plasma membrane.
Localization plays an important role in the organization of signaling pathways, especially those that lead from the cell surface and end at control points at the nucleus, cytoskeleton, and elsewhere. First, second, third and higher order messengers do not diffuse about the cell but rather act in restricted portions of space. The plasma membrane contributes to the localization. It does far more than simply separate outside from inside and provide a fluid medium for the insertion, uniform lateral movement, and tethering of proteins; it assumes an active role in the signaling processes taking place.
In the first part of this chapter, the composition and organization of the plasma membrane will be examined. This exploration will be followed by a discussion of how lipid, calcium, and cAMP second messengers are generated. Second messengers stimulate the activities of serine /threonine kinases belonging to the AGC family. Signaling by these kinases will be explored in the third part of the chapter.
161

162 8. Organization of Signal Complexes by Lipids, Calcium, & Cyclic AMP
8.1 Composition of Biological Membranes
Biological membranes are composed of phospholipids, glycolipids and cholesterol. Membrane lipids are linked together through the cooperative effects of multiple weak noncovalent interactions such as van der Waals forces and hydrogen bonds,and as a result there is considerable fluidity of movement within the membrane—the constituents are free to diffuse laterally and rotationally. The overall structure is that of a fluid of lipids and membraneassociated proteins undergoing Brownian motion. The motions of the molecules are not completely unrestricted, but instead are limited to specific regions of the membrane, giving rise to a mosaic of membrane compartments.
Three classes of lipids are found in biological membranes—phospholipids, glycolipids, and cholesterol. Phospholipids are the primary constituents. The four most common phospholipids are listed in Table 8.1. Phosphoglycerides contain a glycerol backbone that is linked to a phosphoryl group bonded to a phosphorylated alcohol group. A different backbone component, sphingosine, is used in the sphingolipids. Of the four commonly occurring phospholipids, all except phosphatidylserine have uncharged head groups. Phosphatidylserine has a negatively charged head group and is found exclusively in the cytoplasmic leaflet. Phosphatidylinositol is of special importance in metazoans. It is reversibly phosphorylated at one or more OH sites on the inositol ring by lipid kinases to generate lipid signal molecules that coordinate a number of cellular processes including cytoskeleton control and motility, insulin signaling (glucose and lipid metabolism), and growth factor-promoted cell survival.
The glycolipids, like the phospholipids, have a backbone connected to fatty acyl chains. They differ from the phospholipids in that they contain one or more sugar groups in place of the phosphoryl-alcohol bearing headgroup of the phospholipids (Figure 8.1). Glycolipids are found in the exoplasmic leaflet of the plasma membrane, and are believed to promote cell-to-cell recognition. The sugar residues that form the hydrophilic head extend out from the cell surface.
TABLE 8.1. Lipid constituents of the plasma membrane: Exoplasmic—Outer; Cytoplasmic—Inner.
Type |
Lipid |
Comments |
Phospholipids |
Phosphatidylcholine (PC) |
Exoplasmic leaflet |
|
Phosphatidylethanolamine |
Cytoplasmic leaflet |
|
Phosphatidylserine |
Cytoplasmic leaflet, negatively charged head |
|
Sphingomyelin |
group |
|
Phosphatidylinositol |
Exoplasmic leaflet, sphingosine backbone |
|
|
Major role in signaling |
Glycolipids |
|
Exoplasmic leaflet, cell-to-cell recognition |
Cholesterol |
|
Influences fluidity and membrane organization |
|
|
|
8.2 Microdomains and Caveolae in Membranes |
163 |
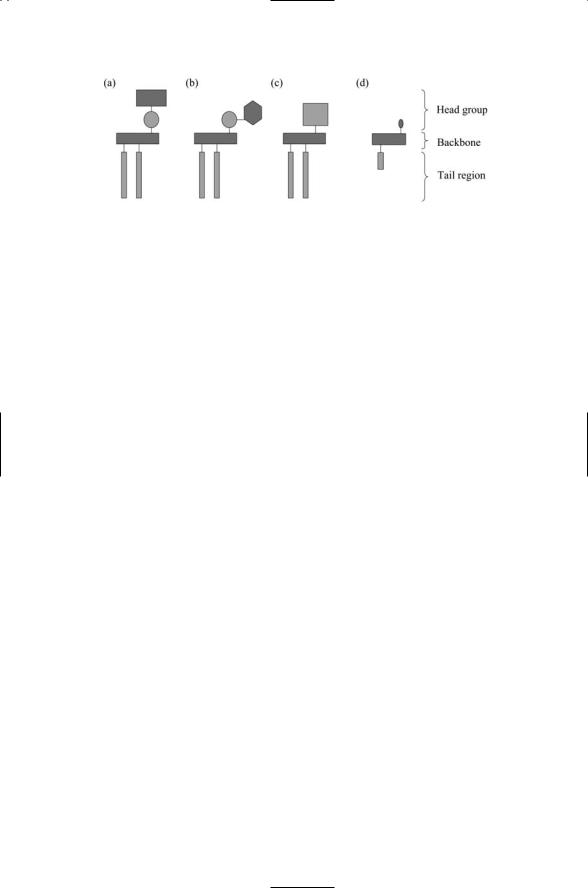
FIGURE 8.1. Schematic representations of phosphoand glycolipids and cholesterol:
(a) A phospholipid such as PC consisting of a pair of acyl chains in the tail region, a backbone, which in this case is glycerol, and a head region consisting of a phosphoryl group (circle) plus an alcohol group (rectangle). (b) A phosphatidylinositol molecule consisting of a tail region, a glycerol backbone, and a phosphoryl group coupled to a hexagonal inositol ring in the head region. (c) A glycolipid in which the head group consists of one or more sugar groups (square). (d) A cholesterol molecule is composed of a fatty acyl tail connected to a rigid steroid ring assembly with an OH group at the terminus that serves as its polar head.
8.2 Microdomains and Caveolae in Membranes
Biological membranes contain microdomains and caveolae specialized for signal transduction. Lipids found in biological membranes vary in chain length and degree of saturation. Chains vary in length, having an even number of carbons typically between 14 and 24, with 16, 18, and 20 most common in phospholipids and glycolipids. Chains with one or more double bonds are unsaturated. These bonds are rigid and introduce kinks in the chain. In a fully saturated acyl chain the carbon-carbon atoms are covalently linked by single bonds. Each carbon atom in such a chain can establish a maximum possible number of bonds with hydrogen atoms, hence the term “saturated.” Such chains are free to rotate about their carbon-carbon bonds, and can be packed tightly. In contrast, the kinks present in an array of unsaturated lipids cause irregularities or voids to appear in the array; these molecules cannot be packed as tightly.
The degree of saturation of the acyl chains and the cholesterol content influence the melting point and fluidity of the lipids in the membrane. This point can be illustrated by some everyday examples. Fats, oils, and waxes are examples of lipids. Butter, a saturated lipid, is a solid gel at room temperature, while corn oil, an unsaturated lipid, is a liquid at the same temperature. Cholesterol plays an important role in determining the fluidity of the membrane compartments. It is smaller than the phosphoand glycolipids and is distributed between both leaflets. As the concentration of cholesterol increases, the lipid membrane becomes less disordered, gel-like and more like an ordered liquid in which the lipids are more tightly packed together, especially when saturated sphingolipids are present (Figure 8.2).
164 8. Organization of Signal Complexes by Lipids, Calcium, & Cyclic AMP
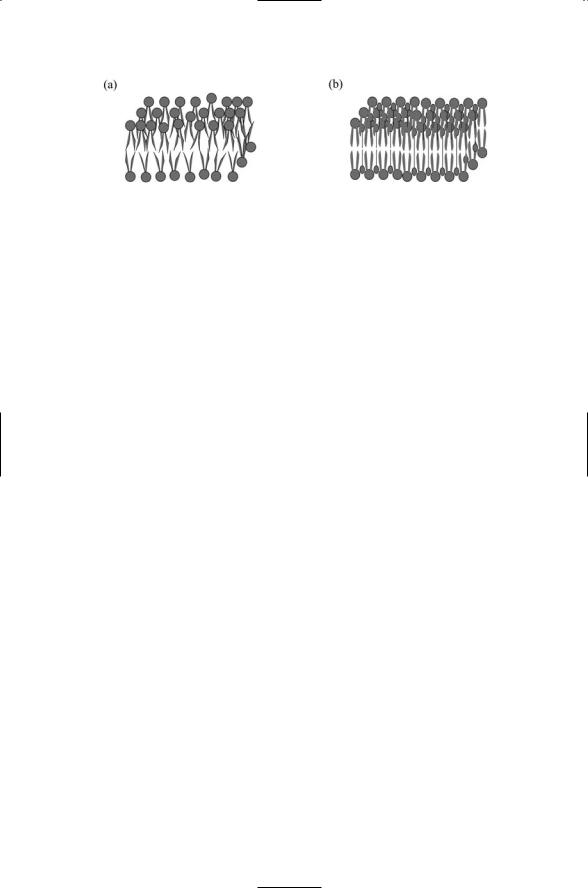
FIGURE 8.2. Lipids and the lipid bilayer: (a) Membrane bilayers contain a mixture of amphipathic lipids. Each lipid molecule has a hydrophilic (polar) head region and a two-pronged hydrophobic tail region oriented as shown. Tails are fatty acyl chains, hydrocarbon chains with a carboxylic acid (COOH) group at one end and (usually) a methane group at the other terminus. In cells, the polar head of each lipid molecule is surrounded by water molecules and thus is hydrated. The density of water molecules drops off rapidly in the hydrophobic interior. (b) Small cholesterol molecules are situated in between the larger lipid molecules. Lipids differ from one another in the number, length, and degree of saturation of the acyl chains, and in the composition of their head groups. The overall packing density is greater in (b) than in (a) due to the presence of cholesterol and of lipids with straighter saturated acyl chains. Signaling proteins (not shown) carrying a GPI anchor attach to the exoplasmic leaflet while signaling proteins bearing acetyl and other kinds of anchors attach to the cytoplasmic leaflet. These proteins congregate in cholesterol and sphingolipid-enriched membrane compartments.
The plasma membranes of eukaryotes are not uniform, but rather contain several kinds of lipid domains, each varying somewhat in its lipid composition. Compartments enriched in cholesterol and/or sphingolipids contain high concentrations of signaling molecules: GPI-anchored proteins in their exoplasmic leaflet and a variety of anchored proteins in their cytoplasmic leaflet. Two kinds of compartments—caveolae and lipid rafts—enriched in cholesterol and glycosphingolipids, are specialized for signaling.
Caveolae (little caves) are detergent-insoluble membrane domains enriched in glycosphingolipids, cholesterol, and lipid-anchored proteins. Caveolae are tiny flask-shaped invaginations in the outer leaflet of the plasma membrane. They play an important role in signaling as well as in transport. Caveolae may be flat, vesicular, or even tubular in shape, and may be either open or closed off from the cell surface. They are detergent insoluble and are enriched in coatlike materials, caveolins, which bind to cholesterol. Cholesteroland sphingolipid-enriched microdomains can float within the more diffuse lipid bilayer.
The second kind of cholesteroland sphingolipid-enriched compartment is a lipid raft. It does not have a cave-like shape and does not contain caveolins, but instead is rather flat in shape. The fluid and detergent-insoluble properties of both the rafts and the caveolae arise from the tight packing of the acyl chains of the sphingolipids and from the high cholesterol content. The cholesterol molecules not only rigidify the compartment but