

Biomechanics Principles and Applications - Schneck and Bronzino
.pdf
11
Cardiac Biomechanics
|
11.1 |
Introduction ..................................................................... |
163 |
|
11.2 |
Cardiac Geometry and Structure.................................... |
163 |
|
|
Ventricular Geometry • Myofiber Architecture • |
|
|
|
Extracellular Matrix Organization |
|
|
11.3 |
Cardiac Pump Function .................................................. |
170 |
|
|
Ventricular Hemodynamics • Ventricular Pressure–Volume |
|
|
|
Relations and Energetics |
|
|
11.4 |
Myocardial Material Properties....................................... |
174 |
|
|
Muscle Contractile Properties • Resting Myocardial |
|
Andrew D. McCulloch |
|
Properties |
|
University of California San Diego |
11.5 |
Regional Ventricular Mechanics: Stress and Strain ....... |
180 |
11.1 Introduction
The primary function of the heart, to pump blood through the circulatory system, is fundamentally mechanical. In this chapter, cardiac function is discussed in the context of the mechanics of the ventricular walls from the perspective of the determinants of myocardial stresses and strains (Table 11.1). Many physiological, pathophysiological, and clinical factors are directly or indirectly affected by myocardial stress and strain (Table 11.2). Of course, the factors in Tables 11.1 and 11.2 are interrelated—most of the factors affected by myocardial stress and strain in turn affect the stress and strain in the ventricular wall. For example, changes in wall stress due to altered hemodynamic load may cause ventricular remodeling, which in turn alters geometry, structure, and material properties. This chapter is organized around the governing determinants in Table 11.1, but mention is made where appropriate of some of the factors in Table 11.2.
11.2 Cardiac Geometry and Structure
The mammalian heart consists of four pumping chambers, the left and right atria and ventricles, communicating through the atrioventricular (mitral and tricuspid) valves, which are structurally connected by chordae tendineae to papillary muscles that extend from the anterior and posterior aspects of the right and left ventricular lumens. The muscular cardiac wall is perfused via the coronary vessels that originate at the left and right coronary ostia located in the sinuses of Valsalva immediately distal to the aortic valve leaflets. Surrounding the whole heart is the collagenous parietal pericardium that fuses with the diaphragm and great vessels. These are the anatomical structures that are most commonly studied in the field of cardiac mechanics. Particular emphasis in this chapter is given to the ventricular walls, which are the most important for the pumping function of the heart. Most studies of cardiac mechanics have focused on the left ventricle, but many of the important conclusions apply equally to the right ventricle.
0-8493-1492-5/03/$0.00+$.50 © 2003 by CRC Press LLC

164 |
Biomechanics: Principles and Applications |
TABLE 11.1 Basic Determinants of Myocardial Stress and Strain
|
Geometry and Structure |
3D shape |
Wall thickness |
|
Curvature |
|
Stress-free and unloaded reference configurations |
Tissue structure |
Muscle fiber architecture |
|
Connective tissue organization |
|
Pericardium, epicardium, and endocardium |
|
Coronary vascular anatomy |
|
Boundary/Initial Conditions |
Pressure |
Filling pressure (preload) |
|
Arterial pressure (afterload) |
|
Direct and indirect ventricular interactions |
|
Thoracic and pericardial pressure |
Constraints |
Effects of inspiration and expiration |
|
Constraints due to the pericardium and its attachments |
|
Valves and fibrous valve annuli, chordae tendineae |
|
Great vessels, lungs |
|
Material Properties |
Resting or passive |
Nonlinear finite elasticity |
|
Quasilinear viscoelasticity |
|
Anisotropy |
|
Biphasic poroelasticity |
Active dynamic |
Activation sequence |
|
Myofiber isometric and isotonic contractile dynamics |
|
Sarcomere length and length history |
|
Cellular calcium kinetics and metabolic energy supply |
|
|
TABLE 11.2 Factors Affected by Myocardial Stress and Strain
Direct Factors |
Regional muscle work |
|
Myocardial oxygen demand and energetics |
|
Coronary blood flow |
Electrophysiological responses |
Action potential duration (QT interval) |
|
Repolarization (T wave morphology) |
|
Excitability |
|
Risk of arrhythmia |
Development and morphogenesis |
Growth rate |
|
Cardiac looping and septation |
|
Valve formation |
Vulnerability to injury |
Ischemia |
|
Arrhythmia |
|
Cell dropout |
|
Aneurysm rupture |
Remodeling, repair, and adaptation |
Eccentric and concentric hypertrophy |
|
Fibrosis |
|
Scar formation |
Progression of disease |
Transition from hypertrophy to failure |
|
Ventricular dilation |
|
Infarct expansion |
|
Response to reperfusion |
|
Aneurysm formation |
|
|
Cardiac Biomechanics |
|
|
165 |
|||
|
TABLE 11.3 |
Representative Left Ventricular Minor-Axis Dimensionsa |
|
|
|
|
|
|
|
Inner |
Outer |
Wall Thickness: |
|
|
Species |
Comments |
Radius (mm) |
Radius (mm) |
Inner Radius |
|
|
|
|
|
|
|
|
|
Dog (21 kg) |
Unloaded diastole (0 mmHg) |
16 |
26 |
0.62 |
|
|
|
Normal diastole (2–12 mmHg) |
19 |
28 |
0.47 |
|
|
|
Dilated diastole (24–40 mmHg) |
22 |
30 |
0.36 |
|
|
|
Normal systole (1–9 mmHg EDP) |
14 |
26 |
0.86 |
|
|
|
Long axis, apex-equator (normal diastole) |
42 |
47 |
0.12 |
|
|
Young rat |
Unloaded diastole (0 mmHg) |
1.4 |
3.5 |
1.50 |
|
|
Mature rat |
Unloaded diastole (0 mmHg) |
3.2 |
5.8 |
0.81 |
|
|
Human |
Normal |
24 |
32 |
0.34 |
|
|
|
Compensated pressure overload |
27 |
42 |
0.56 |
|
|
|
Compensated volume overload |
32 |
42 |
0.33 |
|
|
|
|
|
|
|
|
a Dog data from Ross et al. [1967] and Streeter and Hanna [1973]. Human data from Grossman et al. [1975] and Grossman [1980]. Rat data from unpublished observations in the author’s laboratory.
Ventricular Geometry
From the perspective of engineering mechanics, the ventricles are three-dimensional thick-walled pressure vessels with substantial variations in wall thickness and principal curvatures both regionally and temporally through the cardiac cycle. The ventricular walls in the normal heart are thickest at the equator and base of the left ventricle and thinnest at the left ventricular apex and right ventricular free wall. There are also variations in the principal dimensions of the left ventricle with species, age, phase of the cardiac cycle, and disease (Table 11.3). But, in general, the ratio of wall thickness to radius is too high to be treated accurately by all but the most sophisticated thick-wall shell theories [Taber, 1991].
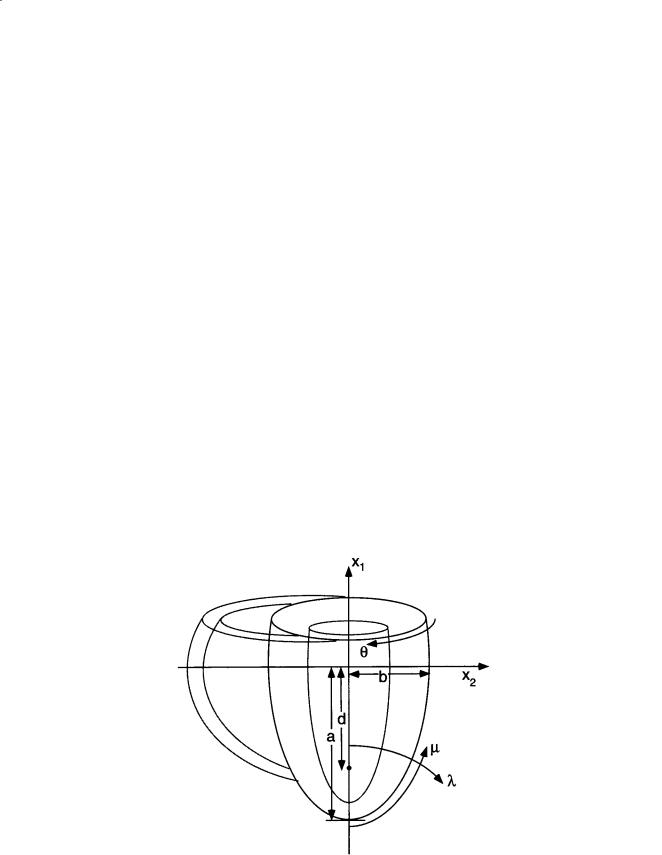
Ventricular geometry has been studied in quantitative detail in the dog heart [Streeter and Hanna, 1973; Nielsen et al., 1991]. Geometric models have been very useful in the analysis, especially the use of confocal and nonconfocal ellipses of revolution to describe the epicardial and endocardial surfaces of the left and right ventricular walls (Fig. 11.1). The canine left ventricle is reasonably modeled by a thick
FIGURE 11.1 Truncated ellipsoid representation of ventricular geometry, showing major left ventricular radius (a), minor radius (b), focal length (d), and prolate spheroidal coordinates (λ, µ, θ).

166 Biomechanics: Principles and Applications
ellipsoid of revolution truncated at the base. The crescentic right ventricle wraps about 180° around the heart wall circumferentially and extends longitudinally about two-thirds of the distance from the base to the apex. Using a truncated ellipsoidal model, left ventricular geometry in the dog can be defined by the major and minor radii of two surfaces, the left ventricular endocardium, and a surface defining the free wall epicardium and the septal endocardium of the right ventricle. Streeter and Hanna [1973] described the position of the basal plane using a truncation factor, fb, defined as the ratio between the longitudinal distances from equator-to-base and equator-to-apex. Hence, the overall longitudinal distance from base to apex is (1 + fb) times the major radius of the ellipse. Since variations in fb between diastole and systole are relatively small (0.45 to 0.51), they suggested a constant value of 0.5.
The focal length d of an ellipsoid is defined from the major and minor radii (a and b) by d 2 = a2 – b2, and varies only slightly in the dog from endocardium to epicardium between end-diastole (37.3 to 37.9 mm) and end-systole (37.7 to 37.1 mm) [Streeter and Hanna, 1973]. Hence, within the accuracy that the boundaries of the left ventricular wall can be treated as ellipsoids of revolution, the assumption that the ellipsoids are confocal appears to be a good one. This has motivated the choice of prolate spheroidal (elliptic–hyperbolic–polar) coordinates (λ, µ, θ) as a system for economically representing ventricular geometries obtained postmortem or by noninvasive tomography [Nielsen et al., 1991; Young and Axel, 1992]. The Cartesian coordinates of a point are given in terms of its prolate spheroidal
coordinates by: |
|
|
x1 = d cosh λ cosµ, |
|
|
x2 |
= d sinh λ sinµ cosθ, |
(11.1) |
x3 |
= d sinh λ sinµ sinθ. |
|
Here, the focal length d defines a family of coordinate systems that vary from spherical polar when d = 0 to cylindrical polar in the limit when d → ∞. A surface of constant transmural coordinate λ (Fig. 11.1) is an ellipse of revolution with major radius a = d coshλ and minor radius b = d sinhλ. In an ellipsoidal model with a truncation factor of 0.5, the longitudinal coordinate µ varies from zero at the apex to 120° at the base. Integrating the Jacobian in prolate spheroidal coordinates gives the volume of the wall or cavity:
d3 |
2∫π µ∫2 λ∫2 |
[(sinh2 λ + sin2 µ)sinh λ sin µ]d λ d µ d θ = |
|
|
|||
|
0 0 λ1 |
|
|
|
|
|
|
|
|
3 |
|
(1 − cos µ2 )cosh3 λ − (1 − cos 3 µ2 )cosh λ |
|
λ |
|
|
|
|
2πd |
|
|
||
|
|
|
|
|
|
||
|
|
|
3 |
|
λ |
||
|
|
|
|
|
|
||
(11.2)
2
1
The scaling between heart mass MH and body mass M within or between species is commonly described by the allometric formula:
MH = kMα |
(11.3) |
Using combined measurements from a variety of mammalian species with M expressed in kilograms, the coefficient k is 5.8 g and the power α is close to unity (0.98) [Stahl, 1967]. Within individual species, the ratio of heart weight to body weight is somewhat lower in mature rabbits and rats (about 2 g/kg) than in humans (5 g/kg) and higher in horses and dogs (8 g/kg) [Rakusan, 1984]. The rate α of heart growth with body weight decreases with age in most species but not humans. At birth, left and right ventricular weights are similar, but the left ventricle is substantially more massive than the right by adulthood.
Cardiac Biomechanics |
167 |
Myofiber Architecture
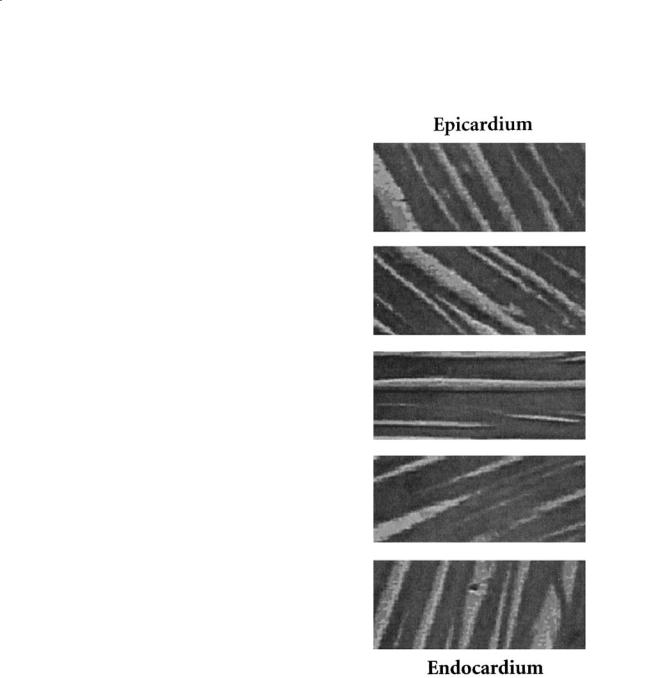
The cardiac ventricles have a complex three-dimen- sional muscle fiber architecture (for a comprehensive review see Streeter [1979]). Although the myocytes are relatively short, they are connected such that at any point in the normal heart wall there is a clear predominant fiber axis that is approximately tangent with the wall (within 3 to 5° in most regions, except near the apex and papillary muscle insertions). Each ventricular myocyte is connected via gap junctions at intercalated disks to an average of 11.3 neighbors, 5.3 on the sides, and 6.0 at the ends [Saffitz et al., 1994]. The classical anatomists dissected discrete bundles of fibrous swirls, though later investigations showed that the ventricular myocardium could be unwrapped by blunt dissection into a single continuous muscle “band” [Torrent-Guasp, 1973]. However, more modern histological techniques have shown that in the plane of the wall, the muscle fiber angle makes a smooth transmural transition from epicardium to endocardium (Fig. 11.2). Similar patterns have been described for humans, dogs, baboons, macaques, pigs, guinea pigs, and rats. In the human or dog left ventricle, the muscle fiber angle typically varies continuously from about –60° (i.e., 60° clockwise from the circumferential axis) at the epicardium to about +70° at the endocardium. The rate of change of fiber angle is usually greatest at the epicardium, so that circumferential (0°) fibers are found in the outer half of the wall, and begins to slowly approach the inner third near the trabeculata–compacta interface. There are also small increases in fiber orientation from end-diastole to systole (7 to 19°), with greatest changes at the epicardium and apex [Streeter et al., 1969].
Regional variations in ventricular myofiber orienta- |
|
|
tions are generally smooth except at the junction |
|
|
between the right ventricular free wall and septum. A |
|
|
detailed study in the dog that mapped fiber angles |
|
|
throughout the entire right and left ventricles described |
FIGURE 11.2 Cardiac muscle fiber orientations |
|
the same general transmural pattern in all regions |
||
vary continuously through the left ventricular wall |
||
including the septum and right ventricular free wall, |
||
from a negative angle at the epicardium to near zero |
||
but with definite regional variations [Nielsen et al., |
(circumferential) at the midwall and to increasing |
|
1991]. Transmural differences in fiber angle were about |
positive values toward the endocardium. (Micro- |
|
120 to 140° in the left ventricular free wall, larger in the |
graphs of canine myocardium from the author’s |
|
septum (160 to 180°), and smaller in the right ventri- |
laboratory, courtesy of Dr. Deidre MacKenna). |
|
cular free wall (100 to 120°). A similar study of fiber |
|
angle distributions in the rabbit left and right ventricles has recently been reported [Vetter and McCulloch, 1998]. For the most part, fiber angles in the rabbit heart were very similar to those in the dog, except on the anterior wall, where average fiber orientations were 20 to 30° counterclockwise of those in the dog.
The locus of fiber orientations at a given depth in the ventricular wall has a spiral geometry that may be modeled as a general helix by simple differential geometry. The position vector x of a point on a helix
168 |
Biomechanics: Principles and Applications |
inscribed on an ellipsoidal surface that is symmetric about the x1 axis and has major and minor radii, a and b, is given by the parametric equation,
x = a sint e1 + b cost sinwt e2 + b cost coswt e3 |
(11.4) |
where the parameter is t, and the helix makes w/4 full turns between apex and equator. A positive w defines a left-handed helix with a positive pitch. The fiber angle or helix pitch angle η, varies along the arc length:
|
a2 cos2 t + b2 sin2 t |
|
sin η = |
(a2 + b2w2 )cos2 t + b2 sin2 t |
(11.5) |
If another, deformed configuration, xˆ, is
extension ratio dsˆ associated with a change
-----
ds
derived from:
defined in the same way as Eq. (11.4), the fiber segment in the ellipsoid geometry [McCulloch et al., 1989] can be
|
|
d sˆ |
|
ˆ |
|
|
|
||
|
|
|
d x |
|
|
|
|||
ˆ |
|
|
|
|
d t |
|
|
|
|
d t |
|
|
|
|
|||||
d s |
= |
= |
|
|
(11.6) |
||||
d s |
|
|
|
d s |
|
|
|
d x |
|
|
|
|
|
d t |
|
|
|
|
|
|
|
|
|
|
|
|
d t |
|
|
|
|
|
|
|
|
|
|
|
|
Although the traditional notion of discrete myofiber bundles has been revised in view of the continuous transmural variation of muscle fiber angle in the plane of the wall, there is a transverse laminar structure in the myocardium that groups fibers together in sheets an average of 4 ± 2 myocytes thick (48 ± 20 µm), separated by histologically distinct cleavage planes [Spotnitz et al., 1974; Smaill and Hunter, 1991; LeGrice et al., 1995]. LeGrice and colleagues investigated these structures in a detailed morphometric study of four dog hearts [LeGrice et al., 1995]. They describe an ordered laminar arrangement of myocytes with extensive cleavage planes running approximately radially from endocardium toward epicardium in transmural section. Like the fibers, the sheets also have a branching pattern with the number of branches varying considerably through the wall thickness.
The fibrous architecture of the myocardium has motivated models of myocardial material symmetry as transversely isotropic. The transverse laminae are the first structural evidence for material orthotropy and have motivated the development of a model describing the variation of fiber, sheet, and sheet-normal axes throughout the ventricular wall [LeGrice et al., 1997]. This has led to the idea that the laminar architecture of the ventricular myocardium affects the significant transverse shears [Waldman et al., 1985] and myofiber rearrangement [Spotnitz et al., 1974] described in the intact heart during systole. By measuring three-dimensional distributions of strain across the wall thickness using biplane radiography of radiopaque markers, LeGrice and colleagues [LeGrice et al., 1995] found that the cleavage planes coincide closely with the planes of maximum shearing during ejection, and that the consequent reorientation of the myocytes may contribute 50% or more of normal systolic wall thickening.
A detailed description of the morphogenesis of the muscle fiber system in the developing heart is not available but there is evidence of an organized myofiber pattern by day 12 in the fetal mouse heart that is similar to that seen at birth (day 20) [McLean et al., 1989]. Abnormalities of cardiac muscle fiber patterns have been described in some disease conditions. In hypertrophic cardiomyopathy, which is often familial, there is substantial myofiber disarray, typically in the interventricular septum [Maron et al., 1987; Karlon et al., 1998].
Cardiac Biomechanics |
169 |
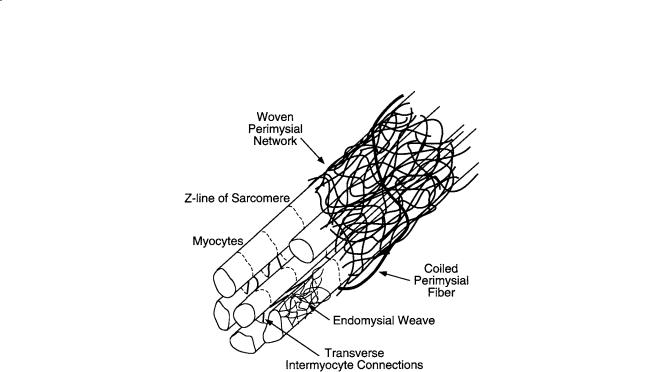
FIGURE 11.3 Schematic representation of cardiac tissue structure showing the association of endomysial and perimysial collagen fibers with cardiac myocytes. (Courtesy of Dr. Deidre MacKenna.)
Extracellular Matrix Organization
The cardiac extracellular matrix consists primarily of the fibrillar collagens, type I (85%) and III (11%), synthesized by the cardiac fibroblasts, the most abundant cell type in the heart. Collagen is the major structural protein in connective tissues but only comprises 2 to 5% of the myocardium by weight, compared with the myocytes, which make up 90% [Weber, 1989]. The collagen matrix has a hierarchical organization (Fig. 11.3), and has been classified according to conventions established for skeletal muscle into endomysium, perimysium, epimysium [Caulfield and Borg, 1979; Robinson et al., 1983]. The endomysium is associated with individual cells and includes a fine weave surrounding the cell and transverse structural connections 120 to 150 nm long connecting adjacent myocytes, with attachments localized near the z-line of the sarcomere. The primary purpose of the endomysium is probably to maintain registration between adjacent cells. The perimysium groups cells together and includes the collagen fibers that wrap bundles of cells into the laminar sheets described above, as well as large coiled fibers typically 1 to 3 µm in diameter which are composed of smaller collagen fibrils (40 to 50 nm) [Robinson et al., 1988]. The helix period of the coiled perimysial fibers is about 20 µm and the convolution index (ratio of fiber arclength to midline length) is approximately 1.3 in the unloaded state of the ventricle [MacKenna et al., 1996; MacKenna et al., 1997]. These perimysial fibers are most likely to be the major structural elements of the collagen extracellular matrix though they probably contribute to myocardial strain energy by uncoiling rather than stretching [MacKenna et al., 1996]. Finally, a thick epimysial collagen sheath surrounds the entire myocardium forming the protective epicardium (visceral pericardium) and endocardium.
Collagen content, organization, and ratio of types I to III change with age and in various disease conditions including myocardial ischemia and infarction, hypertension, and hypertrophy (Table 11.4). Changes in myocardial collagen content and organization coincide with alterations in diastolic myocardial stiffness [MacKenna and McCulloch, 1996]. Hence the collagen matrix plays an important role in determining the elastic material properties of the resting ventricular myocardium.

170 |
|
Biomechanics: Principles and Applications |
||
TABLE 11.4 Changes in Ventricular Collagen Structure and Mechanics with Age and Disease |
|
|||
|
|
|
|
|
Condition |
Collagen Morphology |
Types and Crosslinking |
Passive Stiffness |
Other |
|
|
|
|
|
Pressure |
Hydroxyproline: – |
Type III: [Mukherjee |
Chamber: – [Jalil |
Perivascular fibrosis: |
overload |
[Medugorac, 1980; Weber et al., |
and Sen, 1990] |
et al., 1988; Weber |
[Weber et al., |
hypertrophy |
1988] |
Crosslinks: no change |
et al., 1988] |
1988] |
|
Area fraction: [Jalil et al., |
[Harper et al., 1993] |
Tissue: [Omens |
Focal scarring: [Silver |
|
1988; Weber et al., 1988] |
|
et al., 1995] |
et al., 1990; Contard |
|
|
Crosslinks: [Iimoto |
Chamber: [Corin |
et al., 1991] |
Volume |
Hydroxyproline: no |
Parallel changes |
||
overload |
change– [Michel et al., 1986; |
et al., 1988; Harper |
et al., 1991] |
|
hypertrophy |
Iimoto et al., 1988] |
et al., 1993] |
Tissue: no change/ |
|
|
Area fraction: no change |
Type III/I: [Iimoto |
[Corin et al., 1991] |
|
|
[Medugorac, 1980; Weber |
et al., 1988] |
|
|
|
et al., 1990] |
|
|
|
Acute ischemia/ |
Hydroxyproline: Charney, |
|
early [Forrester |
Collagenase activity: |
stunning |
1992] |
|
et al., 1972] |
[Takahashi et al., |
|
Light microscopy: no change/ |
|
late [Pirzada et al., |
1990; Charney et al., |
|
[Whittaker et al., 1991] |
|
1976] |
1992] |
|
endomysial fibers [Zhao |
|
|
|
|
et al., 1987] |
|
|
|
Chronic |
Hydroxyproline: |
Type III: [Jensen et al., |
Chamber: early |
Organization: – |
myocardial |
[Connelly et al., 1985; Jugdutt |
1990] |
[Pfeffer et al., 1991] |
[Whittaker et al., |
infarction |
and Amy, 1986] |
|
Chamber: late |
1991; Holmes et al., |
|
Loss of birefringence |
|
[Pfeffer et al., 1991] |
1994] |
|
[Whittaker et al., 1989] |
|
|
|
Age |
Hydroxyproline: – |
Type III/I: [Medugorac |
Chamber: [Borg |
Lightmicroscopy: fibril |
|
[Eghbali et al., 1989; Takahashi |
and Jacob, 1983] |
et al., 1981] |
diameter [Eghbali |
|
et al., 1990] |
Crosslinks: |
Papillary muscle: |
et al., 1989] |
|
Collagen fiber diameter |
[Medugorac and Jacob, |
[Anversa et al., 1989] |
|
|
[Eghbali et al., 1989] |
1983] |
|
|
|
|
|
|
|
11.3 Cardiac Pump Function
Ventricular Hemodynamics
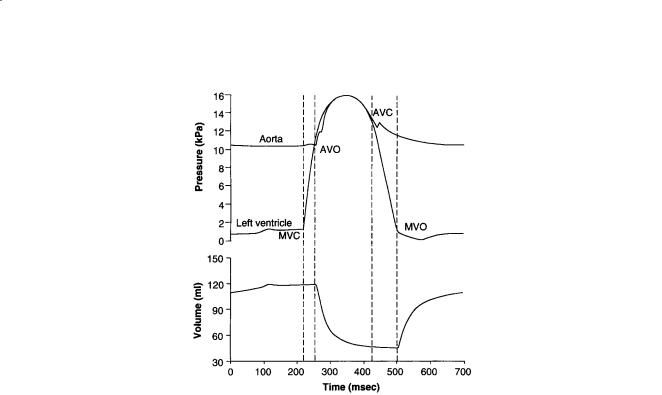
The most basic mechanical parameters of the cardiac pump are blood pressure and volume flowrate, especially in the major pumping chambers, the ventricles. From the point of view of wall mechanics, the ventricular pressure is the most important boundary condition. Schematic representations of the timecourses of pressure and volume in the left ventricle are shown in Fig. 11.4. Ventricular filling immediately following mitral valve opening (MVO) is initially rapid because the ventricle produces a diastolic suction as the relaxing myocardium recoils elastically from its compressed systolic configuration below the resting chamber volume. The later slow phase of ventricular filling (diastasis) is followed finally by atrial contraction. The deceleration of the inflowing blood reverses the pressure gradient across the valve leaflets and causes them to close (MVC). Valve closure may not, however, be completely passive, because the atrial side of the mitral valve leaflets, which unlike the pulmonic and aortic valves are cardiac in embryological origin, have muscle and nerve cells and are electrically coupled to atrial conduction [Sonnenblick et al., 1967].
Ventricular contraction is initiated by excitation, which is almost synchronous (the duration of the QRS complex of the ECG is only about 60 msec in the normal adult) and begins about 0.1 to 0.2 sec after atrial depolarization. Pressure rises rapidly during the isovolumic contraction phase (about 50 msec in adult humans), and the aortic valve opens (AVO) when the developed pressure exceeds the aortic pressure (afterload). Most of the cardiac output is ejected within the first quarter of the ejection phase before the pressure has peaked. The aortic valve closes (AVC) 20 to 30 msec after AVO when the ventricular
Cardiac Biomechanics |
171 |
FIGURE 11.4 Left ventricular pressure, aortic pressure, and left ventricular volume during a single cardiac cycle showing the times of mitral valve closure (MVC), aortic valve opening (AVO), aortic valve closure (AVC), and mitral valve opening (MVO).
pressure falls below the aortic pressure owing to the deceleration of the ejecting blood. The dichrotic notch, a characteristic feature of the aortic pressure waveform and a useful marker of aortic valve closure, is caused by pulse wave reflections in the aorta. Since the pulmonary artery pressure against which the right ventricle pumps is much lower than the aortic pressure, the pulmonic valve opens before and closes after the aortic valve. The ventricular pressure falls during isovolumic relaxation, and the cycle continues. The rate of pressure decay from the value P0 at the time of the peak rate of pressure falls until the mitral valve opening is commonly characterized by a single exponential time constant, i.e.,
P(t) = P |
e–t/τ + P |
∞ |
(11.7) |
0 |
|
|
where P∞ is the (negative) baseline pressure to which the ventricle would eventually relax if MVO were prevented [Yellin et al., 1986]. In dogs and humans, τ is normally about 40 msec, but it is increased by various factors including elevated afterload, asynchronous contraction associated with abnormal activation sequence or regional dysfunction, and slowed cytosolic calcium reuptake to the sarcoplasmic reticulum associated with cardiac hypertrophy and failure. The pressure and volume curves for the right ventricle look essentially the same, however the right ventricular and pulmonary artery pressures are only about a fifth of the corresponding pressures on the left side of the heart. The intraventricular septum separates the right and left ventricles and can transmit forces from one to the other. An increase in right ventricular volume may increase the left ventricular pressure by deformation of the septum. This direct interaction is most significant during filling [Janicki and Weber, 1980].
The phases of the cardiac cycle are customarily divided into systole and diastole. The end of diastole—the start of systole—is generally defined as the time of mitral valve closure. Mechanical endsystole is usually defined as the end of ejection, but Brutsaert and colleagues proposed extending systole until the onset of diastasis (see the review by Brutsaert and Sys [1989]) since there remains considerable myofilament interaction and active tension during relaxation. The distinction is important from the point of view of cardiac muscle mechanics: the myocardium is still active for much of diastole and may never be fully relaxed at sufficiently high heart rates (over 150 beats per minute). Here, we will retain