

Biomechanics Principles and Applications - Schneck and Bronzino
.pdf102 |
|
|
|
|
|
|
Biomechanics: Principles and Applications |
|||||||
|
TABLE 5.4 Architectural Properties of Human Lower Limba,b |
|
|
|
|
|
|
|||||||
|
|
Muscle |
Muscle |
Fiber |
Pennation |
Cross-Sectional |
|
|
|
|||||
|
Muscle |
Mass (g) |
Length (mm) |
Length (mm) |
Angle (°) |
Area (cm2) |
FL/ML Ratio |
|||||||
|
|
|
|
|
|
|
|
|
|
|
|
|
|
|
|
RF (n = 3) |
84.3 |
± 14 |
316 |
± 5.7 |
66.0 |
± 1.5 |
5.0 |
± 0.0 |
12.7 |
± 1.9 |
0.209 |
± 0.002 |
|
|
VL (n = 3) |
220 |
± 56 |
324 |
± 14 |
65.7 |
± 0.88 |
5.0 |
± 0.0 |
30.6 |
± 6.5 |
0.203 |
± 0.007 |
|
|
VM (n = 3) |
175 |
± 41 |
335 |
± 15 |
70.3 |
± 3.3 |
5.0 |
± 0.0 |
21.1 |
± 4.3 |
0.210 |
± 0.005 |
|
|
VI (n = 3) |
160 |
± 59 |
329 |
± 15 |
68.3 |
± 4.8 |
3.3 |
± 1.7 |
22.3 |
± 8.7 |
0.208 |
± 0.007 |
|
|
SM (n = 3) |
108 |
± 13 |
262 |
± 1.5 |
62.7 |
± 4.7 |
15 |
± 2.9 |
16.9 |
± 1.5 |
0.239 |
± 0.017 |
|
|
BFl (n = 3) |
128 |
± 28 |
342 |
± 14 |
85.3 |
± 5.0 |
0.0 |
± 0.0 |
12.8 |
± 2.8 |
0.251 |
± 0.022 |
|
|
BFs (n = 3) |
|
|
271 |
± 11 |
139 |
± 3.5 |
23 |
± 0.9 |
|
|
0.517 ± 0.032 |
|
|
|
ST (n = 2) |
76.9 |
± 7.7 |
317 |
± 4 |
158 |
± 2.0 |
5.0 |
± 0.0 |
5.4 |
± 1.0 |
0.498 |
± 0.0 |
|
|
SOL (n = 2) |
215 (n = 1) |
310 |
± 1.5 |
19.5 |
± 0.5 |
25 |
± 5.0 |
58.0 (n = 1) |
0.063 ± 0.002 |
|
|||
|
MG (n = 3) |
150 |
± 14 |
248 |
± 9.9 |
35.3 |
± 2.0 |
16.7 |
± 4.4 |
32.4 |
± 3.1 |
0.143 |
± 0.010 |
|
|
LG (n = 3) |
|
|
217 |
± 11 |
50.7 |
± 5.6 |
8.3 |
± 1.7 |
|
|
0.233 ± 0.016 |
|
|
|
PLT (n = 3) |
5.30 |
± 1.9 |
85.0 |
± 15 |
39.3 |
± 6.7 |
3.3 |
± 1.7 |
1.2 |
± 0.4 |
0.467 |
± 0.031 |
|
|
FHL (n = 3) |
21.5 |
± 3.3 |
222 |
± 5.0 |
34.0 |
± 1.5 |
10.0 |
± 2.9 |
5.3 |
± 0.6 |
0.154 |
± 0.010 |
|
|
FDL (n = 3) |
16.3 |
± 2.8 |
260 |
± 15 |
27.0 |
± 0.58 |
6.7 |
± 1.7 |
5.1 |
± 0.7 |
0.104 |
± 0.004 |
|
|
PL (n = 3) |
41.5 |
± 8.5 |
286 |
± 17 |
38.7 |
± 3.2 |
10.0 |
± 0.0 |
12.3 |
± 2.9 |
0.136 |
± 0.010 |
|
|
PB (n = 3) |
17.3 |
± 2.5 |
230 |
± 13 |
39.3 |
± 3.5 |
5.0 |
± 0.0 |
5.7 |
± 1.0 |
0.170 |
± 0.006 |
|
|
TP (n = 3) |
53.5 |
± 7.3 |
254 |
± 26 |
24.0 |
± 4.0 |
11.7 |
± 1.7 |
20.8 |
± 3 |
0.095 |
± 0.015 |
|
|
TA (n = 3) |
65.7 |
± 10 |
298 |
± 12 |
77.3 |
± 7.8 |
5.0 |
± 0.0 |
9.9 |
± 1.5 |
0.258 |
± 0.015 |
|
|
EDL (n = 3) |
35.2 |
± 3.6 |
355 |
± 13 |
80.3 |
± 8.4 |
8.3 |
± 1.7 |
5.6 |
± 0.6 |
0.226 |
± 0.024 |
|
|
EHL (n = 3) |
12.9 |
± 1.6 |
273 |
± 2.4 |
87.0 |
± 8.0 |
6.0 |
± 1.0 |
1.8 |
± 0.2 |
0.319 |
± 0.030 |
|
|
SAR (n = 3) |
61.7 |
± 14 |
503 |
± 27 |
455 |
± 19 |
0.0 |
± 0.0 |
1.7 |
± 0.3 |
0.906 |
± 0.017 |
|
|
GR (n = 3) |
35.3 |
± 7.4 |
335 |
± 20 |
277 |
± 12 |
3.3 |
± 1.7 |
1.8 |
± 0.3 |
0.828 |
± 0.017 |
|
|
AM (n = 3) |
229 |
± 32 |
305 |
± 12 |
115 |
± 7.9 |
0.0 |
± 0.0 |
18.2 |
± 2.3 |
0.378 |
± 0.013 |
|
|
AL (n = 3) |
63.5 |
± 16 |
229 |
± 12 |
108 |
± 2.0 |
6.0 |
± 1.0 |
6.8 |
± 1.9 |
0.475 |
± 0.023 |
|
|
AB (n = 3) |
43.8 |
± 8.4 |
156 |
± 12 |
103 |
± 6.4 |
0.0 |
± 0.0 |
4.7 |
± 1.0 |
0.663 |
± 0.036 |
|
|
PEC (n = 3) |
26.4 |
± 6.0 |
123 |
± 4.5 |
104 |
± 1.2 |
0.0 |
± 0.0 |
2.9 |
± 0.6 |
0.851 |
± 0.040 |
|
|
POP (n = 2) |
20.1 |
± 2.4 |
108 |
± 7.0 |
29.0 |
± 7.0 |
0.0 |
± 0.0 |
7.9 |
± 1.4 |
0.265 |
± 0.048 |
|
|
|
|
|
|
|
|
|
|
|
|
|
|
|
|
aData from Wickiewicz et al. [1983].
bAB, adductor brevis; AL, adductor longus; AM, adductor magnus; BF1, biceps femoris, long head; BFS, biceps femoris, short head; EDL, extensor digitorum longus; EHL, extensor hallucis longus; FDL, flexor digitorum longus;
GR, gracilis; FHL, flexor hallucis longus; LG, lateral gastrocnemius; MG, medial gastrocnemius; PEC, pectineus; PB, peroneus brevis; PL, peroneus longus; PLT, plantaris; POP, popliteus; RF, rectus femoris; SAR, sartorius; SM, semimembranosus; SOL, soleus; ST, semitendinsus; TA, tibialis anterior; TP, tibialis posterior; VI, vastus intermedius; VL, vastus lateralis; VM, vastus medialis, FL, fiber length; ML, muscle length.
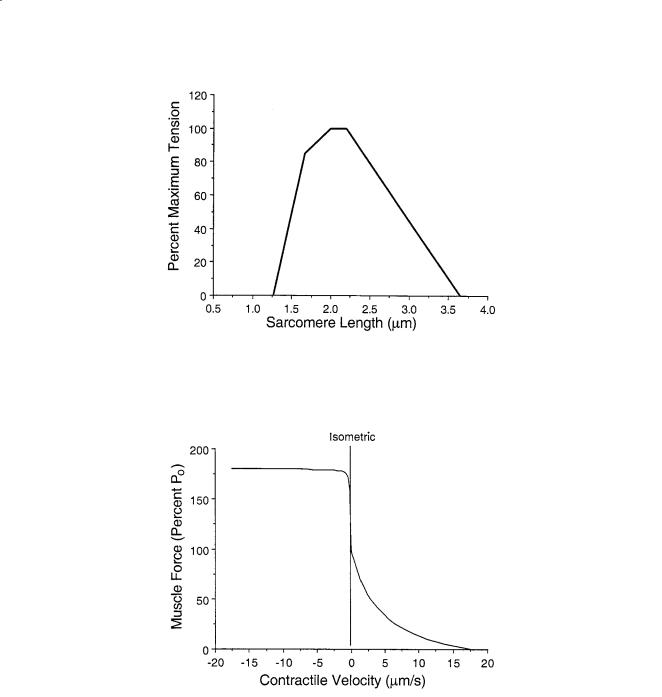
all species is approximately 1.6 µm and actin filament length varies (Table 5.6), optimal sarcomere length and maximum sarcomere length are calculated using these values. For optimal force generation, each half-myosin filament must completely overlap a half-actin filament, without opposing actin filaments overlapping. No active force is produced at sarcomere spacings shorter than the myosin filament length nor longer than the sum of actin and myosin filament lengths. The range of operating sarcomere lengths varies between muscles, but generally spans the range of optimal length ± 20% (Fig. 5.3).
Muscle Force–Velocity Relationship
Under conditions of constant contractile load the relationship between muscle force and velocity is given by the Hill equation [Hill, 1938]. The behavior of muscle is quite different when it is allowed to shorten (often termed “concentric” contraction) compared to when it is forced to lengthen (often termed “eccentric” contraction) and thus, the shortening force-velocity relation can be described by:
(P + a)v = b(Po − P) |
(5.1) |

Musculoskeletal Soft Tissue Mechanics |
|
|
103 |
|||||
|
TABLE 5.5 Architectural Properties of Human Foot Musclesa,b |
|
||||||
|
|
Muscle |
Muscle |
Fiber |
Cross-Sectional |
|||
|
Muscle |
Volume (cm3) |
Length (mm) |
Length (mm) |
Area (cm2) |
|||
|
ABDH |
15.2 |
± 5.3 |
115.8 |
± 4.9 |
23.0 ± 5.5 |
6.68 ± 2.07 |
|
|
ABDM |
8.8 |
± 4.7 |
112.8 |
± 19.0 |
23.9 ± 7.4 |
3.79 ± 1.83 |
|
|
ADHO |
9.1 |
± 3.1 |
67.4 |
± 4.6 |
18.6 ± 5.3 |
4.94 ± 1.36 |
|
|
ADHT |
1.1 |
± 0.6 |
24.8 |
± 4.2 |
18.7 ± 5.2 |
0.62 ± 0.26 |
|
|
DI1 |
2.7 |
± 1.4 |
51.0 |
± 4.9 |
16.1 ± 4.4 |
1.70 ± 0.64 |
|
|
DI2 |
2.5 |
± 1.4 |
49.9 |
± 5.1 |
15.3 ± 4.0 |
1.68 ± 0.80 |
|
|
DI3 |
2.5 |
± 1.2 |
44.3 |
± 5.6 |
15.6 ± 5.4 |
1.64 ± 0.58 |
|
|
DI4 |
4.2 |
± 2.0 |
61.4 |
± 4.5 |
16.0 ± 4.8 |
2.72 ± 1.33 |
|
|
EDB2 |
2.1 |
± 1.2 |
69.8 |
± 16.8 |
28.0 ± 6.5 |
0.79 ± 0.43 |
|
|
EDB3 |
1.3 |
± 0.7 |
82.2 |
± 20.7 |
26.4 ± 5.1 |
0.51 ± 0.30 |
|
|
EDB4 |
1.0 |
± 0.7 |
70.4 |
± 21.1 |
23.1 ± 3.8 |
0.44 ± 0.29 |
|
|
EHB |
3.6 |
± 1.5 |
65.7 |
± 8.5 |
27.9 ± 5.7 |
1.34 ± 0.66 |
|
|
FDB2 |
4.5 |
± 2.3 |
92.9 |
± 15.0 |
25.4 ± 4.5 |
1.78 ± 0.79 |
|
|
FDB3 |
3.2 |
± 1.5 |
98.8 |
± 18.1 |
22.8 ± 4.0 |
1.49 ± 0.71 |
|
|
FDB4 |
2.6 |
± 1.0 |
103.0 |
± 9.2 |
20.8 ± 4.5 |
1.26 ± 0.47 |
|
|
FDB5 |
0.7 |
± 0.3 |
83.2 |
± 3.0 |
18.2 ± 2.2 |
0.35 ± 0.16 |
|
|
FDMB |
3.4 |
± 1.7 |
51.0 |
± 5.3 |
17.7 ± 3.8 |
2.00 ± 1.02 |
|
|
FHBL |
3.4 |
± 1.4 |
65.3 |
± 7.1 |
16.5 ± 3.4 |
2.12 ± 0.84 |
|
|
FHBM |
3.1 |
± 1.3 |
76.0 |
± 19.8 |
17.5 ± 4.8 |
1.80 ± 0.75 |
|
|
LB2 |
0.6 |
± 0.4 |
53.9 |
± 11.8 |
22.4 ± 6.5 |
0.28 ± 0.17 |
|
|
LB3 |
0.5 |
± 0.4 |
45.2 |
± 8.7 |
22.3 ± 6.7 |
0.28 ± 0.09 |
|
|
LB4 |
0.6 |
± 0.4 |
37.3 |
± 19.9 |
21.1 ± 9.3 |
0.30 ± 0.32 |
|
|
LB5 |
0.4 |
± 0.4 |
41.0 |
± 12.1 |
16.2 ± 7.0 |
0.18 ± 0.13 |
|
|
PI1 |
1.5 |
± 0.5 |
46.2 |
± 4.0 |
13.6 ± 3.7 |
1.23 ± 0.65 |
|
|
PI2 |
1.9 |
± 0.7 |
56.6 |
± 6.6 |
13.9 ± 3.5 |
1.41 ± 0.48 |
|
|
PI3 |
1.8 |
± 0.6 |
48.8 |
± 9.9 |
14.2 ± 5.9 |
1.38 ± 0.55 |
|
|
QPL |
2.4 |
± 1.2 |
55.3 |
± 3.9 |
23.4 ± 7.1 |
1.00 ± 0.41 |
|
|
QPM |
5.6 |
± 3.4 |
81.3 |
± 20.1 |
27.5 ± 7.0 |
1.96 ± 0.94 |
|
|
|
|
|
|
|
|
|
|
aData from Kura et al. [1997].
bABDH, abductor hallucis; ABDM, abductor digiti minimi; ADHO, adductor hallucis oblique; ADHT, adductor hallucis transverse; DI, dorsal interosseous; EDB, extensor digitorum brevis; EHB, extensor hallucis brevis; FDB, flexor digitorum brevis; FDMB, flexor digiti minimi brevis; FHBL, flexor hallucis brevis lateralis; FHBM flexor hallucis brevis medialis; LB, lumbrical; PI, plantar interosseous; QPL, quadratus plantaris lateralis; QPM, quadratus plantaris medialis.
where a and b are constants derived experimentally (usually about 0.25, Table 5.2), P is muscle force, Po is maximum tetanic tension, and v is muscle velocity. The lengthening relation can be described by:
F = 1.8 − 0.8 |
Vmax |
+V |
||
|
|
|
. |
|
|
|
|
||
Vmax |
− 7.6 V |
|||
The dynamic parameters (a, b, and Vmax) vary with species and fiber type (Table 5.2).
Tendon Biomechanics
Tendons, as most biological structures, have highly nonlinear stress–strain properties. This tissue is composed of a network of collagen fibrils in a hydrated matrix of elastin and proteoglycans. At rest, the collagen fibrils are significantly crimped or wavy so that initial loading acts primarily to straighten these fibrils. At higher strains, the straightened collagen fibrils must be lengthened which requires greater stress.
104 |
Biomechanics: Principles and Applications |
FIGURE 5.1 Sarcomere length-tension curve elucidated for isolated frog skeletal muscle fibers by Gordon, Huxley, and Julian [1966]. This demonstrates the length dependence of skeletal muscle on isometric strength.
FIGURE 5.2 Force-velocity relationship for isolated skeletal muscle for shortening and lengthening. These data are plots of Eqs. 5.1 and 5.2 normalized for the maximum contraction velocity of the muscle.
As a result, tendons are more compliant at low loads and less compliant at high loads. The highly nonlinear low-load region has been referred to as the “toe” region and occurs up to approximately 3% strain and 5 MPa [Butler et al., 1979; Zajac, 1989]. Typically tendons have linear properties from about 3% strain until ultimate strain which is approximately 10% (Table 5.7). The tangent modulus in this linear region is approximately 1.5 GPa. Ultimate tensile stress reported for tendons is approximately 100 MPa (Table 5.7). Tendons operate physiologically at stresses of approximately 5 to 10 MPa (Table 5.7). Thus, tendons operate with a safety factor of 10 to 20 MPa.
Musculoskeletal Soft Tissue Mechanics |
105 |
|||
|
TABLE 5.6 Actin Filament Lengths |
|
|
|
|
|
|
|
|
|
Species |
1/2 Actin Filament Length (µm) |
Ref. |
|
|
|
|
|
|
|
Human |
1.18 |
Lieber et al. [1994] |
|
|
Cat |
1.12 |
Herzog et al. [1992] |
|
|
Rat |
1.09 |
Herzog et al. [1992] |
|
|
Rabbit |
1.09 |
Herzog et al. [1992] |
|
|
Frog |
0.98 |
Page and Huxley [1963] |
|
|
Monkey |
1.16 |
Walker and Schrodt [1973] |
|
|
Human |
1.27 |
Walker and Schrodt [1973] |
|
|
Hummingbird |
1.75 |
Mathieu-Costello et al. [1992] |
|
|
Chicken |
0.95 |
Page [1969] |
|
|
Wild rabbit |
1.12 |
Dimery [1985] |
|
|
Carp |
0.98 |
Sosnicki et al. [1991] |
|
|
|
|
|
|
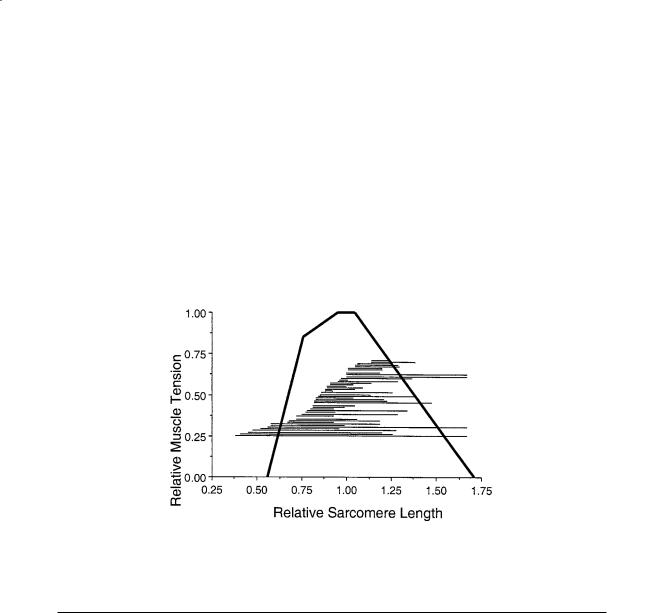
FIGURE 5.3 Sarcomere length excursion range during normal movement summarized from 48 different scientific studies. Since thin filament length varies among species, these lengths were normalized to the thin filament plus the thick filament length. Thick filaments are 1.65 µm long while thin filament length varies from 2.0 to 2.5 µm.
TABLE 5.7 Tendon Biomechanical Properties
|
Ultimate |
Ultimate |
Stress |
Strain |
Tangent |
|
|
Stress |
Strain |
under Normal |
under Normal |
Modulus |
|
Tendon |
(MPa) |
(%) |
Loads (MPa) |
Loads (%) |
(GPa) |
Ref. |
|
|
|
|
|
|
|
Swine |
40 |
9 |
|
|
|
Woo et al. [1980] |
Wallaby |
|
|
15–40 |
|
1.56 |
Bennett et al. [1986] |
Porpoise |
|
|
|
|
1.53 |
Bennett et al. [1986] |
Dolphin |
|
|
|
|
1.43 |
Bennett et al. [1986] |
Deer |
|
|
28–74 |
|
1.59 |
Bennett et al. [1986] |
Sheep |
|
|
|
|
1.65 |
Bennett et al. [1986] |
Donkey |
|
|
22–44 |
|
1.25 |
Bennett et al. [1986] |
Human leg |
|
|
53 |
|
1.0–1.2 |
Bennett et al. [1986] |
Cat leg |
|
|
|
|
1.21 |
Bennett et al. [1986] |
Pig tail |
|
|
|
|
0.9 |
Bennett et al. [1986] |
Rat tail |
|
|
|
|
0.8–1.5 |
Bennett et al. [1986] |
Horse |
|
|
|
4–10 |
|
Ker et al. [1988] |
Dog leg |
|
|
84 |
|
|
Ker et al. [1988] |
Camel ankle |
|
|
18 |
|
|
Ker et al. [1988] |
Human limb (various) |
60–120 |
|
|
|
|
McElhaney et al. [1976] |
Human calcaneal |
55 |
9.5 |
|
|
|
McElhaney et al. [1976] |
Human wrist |
52–74 |
11–17 |
3.2–3.3 |
1.5–3.5 |
|
Loren and Lieber [1994] |
|
|
|
|
|
|
|

106 |
Biomechanics: Principles and Applications |
References
Butler, D.L., Grood, E.S., Noyes, F.R., and Zernicke, R.F. 1979. Biomechanics of ligaments and tendons.
Exer. Sport Sci. Rev. 6:125–181.
Gans, C. 1982. Fiber architecture and muscle function. Exer. Sport Sci. Rev. 10:160–207.
Hill, A.V. 1938. The heat of shortening and the dynamic constants of muscle. Proc. R. Soc. Lond. [Biol]. 126:136–195.
Huxley, A.F. 1957. Muscle structure and theories of contraction. Prog. Biophys. Mol. Biol. 7:255–318. Kura, H., Luo, Z., Kitaoka, H.B., and An, K. 1997. Quantitative analysis of the intrinsic muscles of the
foot. Anat. Rec. 249:143–151.
Lieber, R.L., Fazeli, B.M., and Botte, M.J. 1990. Architecture of selected wrist flexor and extensor muscles.
J. Hand Surg. 15:244–250.
Lieber, R.L., Jacobson, M.D., Fazeli, B.M., Abrams, R.A., and Botte, M.J. 1992. Architecture of selected muscles of the arm and forearm: anatomy and implications for tendon transfer J. Hand Surg. 17:787–798.
Lieber, R.L., Loren, G.J., and Fridén, J. 1994. In vivo measurement of human wrist extensor muscle sarcomere length changes. J. Neurophysiol. 71:874–881.
Ma, S.P. and Zahalak, G.I. 1991. A distribution-moment model of energetics in skeletal muscle.
J. Biomech. 24:21–35.
Powell, P.L., Roy, R.R., Kanim, P., Bello, M.A., and Edgerton, V.R. 1984. Predictability of skeletal muscle tension from architectural determinations in guinea pig hindlimbs. J. Appl. Physiol. 57:1715–1721.
Wickiewicz, T.L., Roy, R.R., Powell, P.L., and Edgerton, V.R. 1983. Muscle architecture of the human lower limb. Clin. Orthop. Rel. Res. 179:275–283.
Zajac, F.E. 1989. Muscle and tendon: Properties, models, scaling and application to biomechanics and motor control. CRC Crit. Rev. Biomed. Eng. 17:359–411.

6
Mechanics of the Head/Neck
6.1 |
Mechanisms of Injury ........................................................ |
107 |
|
Head Injury Mechanisms • Neck Injury Mechanisms |
|
6.2 |
Mechanical Response ......................................................... |
109 |
|
Mechanical Response of the Head • Mechanical Response of |
|
|
the Neck |
|
6.3 |
Regional Tolerance of the Head and Neck to |
|
|
Blunt Impact ....................................................................... |
114 |
Albert I. King |
Regional Tolerance of the Head • Regional Tolerance of |
|
|
the Neck |
|
Wayne State University |
|
|
6.4 |
Human Surrogates of the Head and Neck ....................... |
116 |
David C. Viano |
The Experimental Surrogate • The Injury-Assessment Tool |
• |
Wayne State University |
Computer Models |
|
Injury is a major societal problem in the United States. Approximately 140,000 fatalities occur each year due to both intentional and unintentional injuries. Two-thirds of these are unintentional, and of these about one-half are attributable to automotive-related injuries. In 1993, the estimated number of auto- motive-related fatalities dipped under 40,000 for the first time in the last three decades due to a continuing effort by both the industry and government to render vehicles safer in crash situations. However, for people under 40 years of age, automotive crashes, falls, and other unintentional injuries are the highest risks of fatality in the United States in comparison with all other causes.
The principal aim of impact biomechanics is the prevention of injury through environmental modification, such as the provision of an airbag for automotive occupants to protect them during a frontal crash. To achieve this aim effectively, it is necessary that workers in the field have a clear understanding of the mechanisms of injury, be able to describe the mechanical response of the tissues involved, have some basic information on human tolerance to impact, and be in possession of tools that can be used as human surrogates to assess a particular injury [Viano et al., 1989]. This chapter deals with the biomechanics of blunt impact injury to the head and neck.
6.1 Mechanisms of Injury
Head Injury Mechanisms
Among the more popular theories of brain injury due to blunt impact are changes in intracranial pressure and the development of shear strains in the brain. Positive pressure increases are found in the brain behind the site of impact on the skull. Rapid acceleration of the head, in-bending of the skull, and the propagation of a compressive pressure wave are proposed as mechanisms for the generation of intracranial compression that causes local contusion of brain tissue. At the contrecoup site, there is an opposite
0-8493-1492-5/03/$0.00+$.50 © 2003 by CRC Press LLC

108 |
Biomechanics: Principles and Applications |
response in the form of a negative-pressure pulse that also causes bruising. It is not clear as to whether the injury is due to the negative pressure itself (tensile loading) or to a cavitation phenomenon similar to that seen on the surfaces of propellers of ships (compression loading). The pressure differential across the brain necessarily results in a pressure gradient that can give rise to shear strains developing within the deep structures of the brain. Furthermore, when the head is impacted, it not only translates but also rotates about the neck. It is postulated that the relative motion of the brain surface with respect to the rough inner surface of the skull results in surface contusions and the tearing of bridging veins between the brain and the dura mater, the principal membrane protecting the brain beneath the skull. Gennarelli [1983] has found that rotational acceleration of the head can cause a diffuse injury to the white matter of the brain in animal models, as evidenced by retraction balls developing along the axons of injured nerves. This injury was described by Strich [1961] as diffuse axonal injury (DAI) that she found in the white matter of autopsied human brains. Other researchers, including Lighthall et al. [1990], have been able to cause the development of DAI in the brain of an animal model (ferrets) by the application of direct impact to the brain without the associated head angular acceleration. Adams et al. [1986] indicated that DAI is the most important factor in severe head injury because it is irreversible and leads to incapacitation and dementia. It is postulated that DAI occurs as a result of the mechanical insult but cannot be detected by staining techniques at autopsy unless the patient survives the injury for at least several hours.
Neck Injury Mechanisms
The neck or the cervical spine is subjected to several forms of unique injuries that are not seen in the thoracolumbar spine. Injuries to the upper cervical spine, particularly at the atlanto-occipital joint, are considered to be more serious and life-threatening than those at the lower level. The atlanto-occipital joint can be dislocated either by an axial torsional load or a shear force applied in the anteroposterior direction, or vice versa. A large compression force can cause the arches of C1 to fracture, breaking it up into two or four sections. The odontoid process of C2 is also a vulnerable area. Extreme flexion of the neck is a common cause of odontoid fractures, and a large percentage of these injuries are related to automotive accidents [Pierce and Barr, 1983]. Fractures through the pars interarticularis of C2, commonly known as “hangman’s fractures” in automotive collisions, are the result of a combined axial compression and extension (rearward bending) of the cervical spine. Impact of the forehead and face of unrestrained occupants with the windshield can result in this injury. Garfin and Rothman [1983] discussed this injury in relation to hanging and traced the history of this mode of execution. It was estimated by a British judiciary committee that the energy required to cause a hangman’s fracture was 1708 N·m (1260 ft·lb).
In automotive-type accidents, the loading on the neck due to head contact forces is usually a combination of an axial or shear load with bending. Bending loads are almost always present, and the degree of axial of shear force depends on the location and direction of the contact force. For impacts near the crown of the head, compressive forces predominate. If the impact is principally in the transverse plane, there is less compression and more shear. Bending modes are infinite in number because the impact can come from any angle around the head. To limit the scope of the discussion, the following injury modes are considered: tension–flexion, tension–extension, compression–flexion, and compression–extension in the midsagittal plane and lateral bending.
Tension–Flexion Injuries. Forces resulting from inertial loading of the head–neck system can result in flexion of the cervical spine while it is being subjected to a tensile force. In experimental impacts of restrained subjects undergoing forward deceleration, Thomas and Jessop [1983] reported atlanto-occipital separation and C1–C2 separation occurring in subhuman primates at 120 g. Similar injuries in human cadavers were found at 34 to 38 g by Cheng et al. [1982], who used a preinflated driver airbag system that restrained the thorax but allowed the head and neck to rotate over the bag.

Mechanics of the Head/Neck |
109 |
Tension–Extension Injuries. The most common type of injury due to combined tension and extension of the cervical spine is the “whiplash” syndrome. However, a large majority of such injuries involve the soft tissues of the neck, and the pain is believed to reside in the joint capsules of the articular facets of the cervical vertebrate [Lord et al., 1993]. In severe cases, teardrop fractures of the anterosuperior aspect of the vertebral body can occur. Alternately, separation of the anterior aspect of the disk from the vertebral endplate is known to occur. More severe injuries occur when the chin impacts the instrument panel or when the forehead impacts the windshield. In both cases, the head rotates rearward and applies a tensile and bending load on the neck. In the case of windshield impact by the forehead, hangman’s fracture of C2 can occur. Garfin and Rothman [1983] suggested that it is caused by spinal extension combined with compression on the lamina of C2, causing the pars to fracture.
Compression–Flexion Injuries. When a force is applied to the posterosuperior quadrant of the head or when a crown impact is administered while the head is in flexion, the neck is subjected to a combined load of axial compression and forward bending. Anterior wedge fractures of vertebral bodies are commonly seen, but with increased load burst fractures and fracture-dislocations of the facets can result. The latter two conditions are unstable and tend to disrupt or injure the spinal cord, and the extent of the injury depends on the penetration of the vertebral body or its fragments into the spinal canal. Recent experiments by Pintar et al. [1989, 1990] indicate that burst fractures of lower cervical vertebrae can be reproduced in cadaveric specimens by a crown impact to a flexed cervical spine. A study by Nightingale et al. [1993] showed that fracture-dislocations of the cervical spine occur very early in the impact event (within the first 10 ms) and that the subsequent motion of the head or bending of the cervical spine cannot be used as a reliable indicator of the mechanism of injury.
Compression–Extension Injuries. Frontal impacts to the head with the neck in extension will cause compression–extension injuries. These involve the fracture of one or more spinous processes and, possibly, symmetrical lesions of the pedicles, facets, and laminae. If there is a fracture-dislocation, the inferior facet of the upper vertebra is displaced posteriorly and upward and appears to be more horizontal than normal on x-ray.
Injuries Involving Lateral Bending. If the applied force or inertial load on the head has a significant component out of the midsagittal plane, the neck will be subjected to lateral or oblique along with axial and shear loading. The injuries characteristic of lateral bending are lateral wedge fractures of the vertebral body and fractures to the posterior elements on one side of the vertebral column.
Whenever there is lateral or oblique bending, there is the possibility of twisting the neck. The associated torsional loads may be responsible for unilateral facet dislocations or unilateral locked facets [Moffat et al., 1978]. However, the authors postulated that pure torsional loads on the neck are rarely encountered in automotive accidents. It was shown by Wismans and Spenny [1983] that, in a purely lateral impact, the head rotated axially about the cervical axis while it translated laterally and vertically and rotated about an anteroposterior axis. These responses were obtained from lateral impact tests performed by the Naval Biodynamics Laboratory on human subjects who were fully restrained at and below the shoulders.
6.2 Mechanical Response
Mechanical Response of the Head
A large number of cadaveric studies on blunt head impact have been carried out over the past 50 years. The head was impacted by rigid and padded surfaces and by impactors of varying shapes to simulate flat surfaces and knobs encountered in the automotive environment. In general, the impact responses were described in terms of head acceleration or impact force. Both of these responses are dependent on a variety of factors, including the inertial properties of the head and the surface impacted by the head.

110 |
|
|
Biomechanics: Principles and Applications |
||
|
TABLE 6.1 Average Male Head Mass |
|
|
|
|
|
|
|
|
|
|
|
|
No. of |
Average Body Mass |
Average Head Mass |
|
|
Ref. |
Subjects |
(kg) |
(kg) |
|
|
|
|
|
|
|
|
Walker et al. [1973] |
16 |
67.1 |
4.49 |
|
|
Hubbard and McLeod [1974] |
11 |
|
4.54 |
|
|
Reynolds et al. [1975] |
6 |
65.2 |
3.98 |
|
|
Adjusted per HMRTF |
6 |
76.9 |
4.69 |
|
|
Beier et al. [1980] |
19 |
74.7 |
4.32 |
|
|
McConville et al. [1980] |
31 |
77.5 |
4.55a |
|
|
Robbins [1983] |
25 |
76.7 |
4.54b |
|
aBased on adjusted head volume of 95% of the reported head volume (4396 cm3) and a head specific gravity of 1.097.
bBased on an estimated head volume of 4137 cm3 and a head specific gravity of 1.097.
TABLE 6.2 Average Mass Moments of Inertiaa of the Male
Head (kg·m2 × 10–3)
Ref. |
Ixx |
Iyy |
Izz |
Walker et al. [1973] |
|
23.3 |
|
Hubbard and McLeod [1974] |
17.4 |
16.4 |
20.3 |
Adjusted per HMRTF |
22.6 |
21.3 |
26.3 |
Beier et al. [1980] (16 male subjects only) |
20.7 |
22.6 |
14.9 |
McConville et al. [1980] |
20.4 |
23.2 |
15.1 |
Adjusted by sp. gr. 1.097 |
22.4 |
25.5 |
16.6 |
Robbins [1983] |
20.0 |
22.2 |
14.5 |
Adjusted by sp. gr. 1.097 |
22.0 |
24.2 |
15.9 |
|
|
|
|
a The mass moments of inertia given are about the x, y, or z anatomic axes through the center of gravity of the head.
In this section, the inertial properties of the head will be described, and response data for head impact against a flat, rigid surface will be provided. It should be noted that while response data against surfaces with a variety of shapes and stiffnesses are of interest, the only generally applicable and reproducible data are those of impacts to flat, rigid surfaces.
Inertial Properties of the Head. There are several sources of data on the inertial properties of the human head. Mass data are shown in Table 6.1, while mass moment of inertial data can be found in Table 6.2. The data by Walker et al. [1973] shown in Table 6.1 were analyzed by Hubbard and McLeod [1974], who found that 16 of the 20 heads used by Walker et al. [1973] had dimensions that were close to those of the average male and provided the data for the average body and head mass. Similarly, Hubbard and McLeod [1974] analyzed the head-mass data of Hodgson and Thomas [1971] and Hodgson et al. [1972] for 11 heads, the dimensions of which were consistent with those of a fiftieth percentile male head and found an average value of 4.54 kg, as shown in Table 6.1. The data of Reynolds et al. [1975] were obtained from 6 cadavers that were of low body weight. The Human Mechanical Response Task Force (HMRTF) of the Society of Automotive Engineers (SAE) made an adjustment for the body and head mass, and the results are shown just below the original data of Reynolds et al. [1975] in Table 6.1. The data of Beier et al. [1980] are based on their original study. The studies of McConville et al. [1980] and Robbins [1983] were derived from anthropometric measurement of living subjects. In these studies, head mass was estimated from volumetric measurements and a previously determined value of the specific gravity of the head, 1.097. For the average values of the mass moment of inertia, shown in Table 6.2, the origin of the coordinate axes is at the center of gravity (cg) of the head, and the x axis is in the posteroanterior direction, while the z axis is in the inferosuperior direction and the y axis is in a lateral direction. The adjustments made in Table 6.1 are applicable to Table 6.2 as well.
Mechanics of the Head/Neck |
111 |
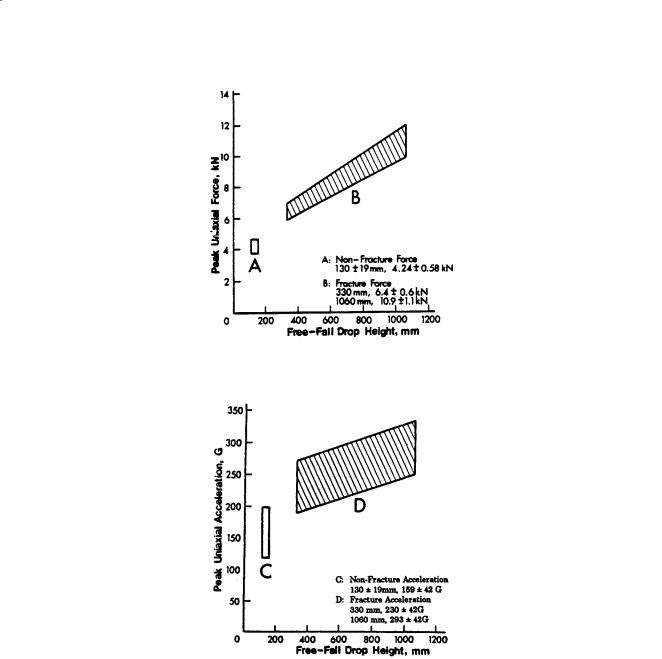
FIGURE 6.1 Impact response of the head in terms of peak force.
FIGURE 6.2 Impact response of the head in terms of peak acceleration.
Cranial Impact Response. Impact response of the head against a flat, rigid surface was obtained by Hodgson and Thomas [1973, 1975], who performed a series of drop tests using embalmed cadavers. The responses in terms of peak force and acceleration are shown in Figs. 6.1 and 6.2, respectively, as a function of an equivalent free-fall drop height. Details of adjustments made to the original data are described by Prasad et al. [1985]. It should be noted that the data shown were from the frontal, lateral, and occipital directions and that there was a large scatter in the peak values. For this reason, the data were pooled, and individual data points were not shown.
The difficulty with acceleration measurements in head impact is twofold. The head is not a rigid body, and accelerometers cannot be mounted at the center of gravity of the head. The center of gravity acceleration can be computed if head angular acceleration is measured, but the variation in skull stiffness cannot be corrected for easily. It is recommended that in all future head-impact studies, head angular acceleration be measured. Several methods for measuring this parameter have been proposed. At present,