

Biomechanics Principles and Applications - Schneck and Bronzino
.pdf52 |
Biomechanics: Principles and Applications |
FIGURE 3.20 Humeral contact positions as a function of glenohumeral motion and positions. (Source: Morrey BF, An KN. 1990. Biomechanics of the shoulder. In CA Rockwood and FA Matsen (Eds.), The Shoulder, pp. 208–245, Philadelphia, Saunders. With permission.)
forward and inferior during internal rotation (Fig. 3.20). With external rotation, the contact is posterior/inferior. With elevation, the contact area moves superiorly. Lippitt and associates [1998] calculated the stability ratio, which is defined as a force necessary to translate the humeral head from the glenoid fossa divided by the compressive load times 100. The stability ratios were in the range of 50 to 60% in the superior–inferior direction and 30 to 40% in the anterior–posterior direction. After the labrum was removed, the ratio decreased by approximately 20%. Joint conformity was found to have significant influence on translations of humeral head during active positioning by muscles [Karduna et al., 1996].
Axes of Rotation
The shoulder complex consists of four distinct articulations: the glenohumeral joint, the acromioclavicular joint, the sternoclavicular joint, and the scapulothoracic articulation. The wide range of motion of the shoulder (exceeding a hemisphere) is the result of synchronous, simultaneous contributions from each joint. The most important function of the shoulder is arm elevation. Several investigators have attempted to relate glenohumeral and scapulothoracic motion during arm elevation in various planes (Table 3.12). About two-thirds of the motion takes place in the glenohumeral joint and about one-third in the scapulothoracic articulation, resulting in a 2:1 ratio.
Surface motion at the glenohumeral joint is primarily rotational. The center of rotation of the glenohumeral joint has been defined as a locus of points situated within 6.0 ± 1.8 mm of the geometric center of the humeral head [Poppen and Walker, 1976]. However, the motion is not purely rotational. The humeral head displaces, with respect to the glenoid. From 0–30°, and often from 30–60°, the humeral head moves upward in the glenoid fossa by about 3 mm, indicating that rolling and/or gliding has taken place. Thereafter, the humeral head has only about 1 mm of additional excursion. During arm elevation in the scapular plane, the scapula moves in relation to the thorax [Poppen and Walker, 1976]. From 0–30° the

Joint-Articulating Surface Motion |
53 |
||
|
TABLE 3.12 Arm Elevation: Glenohumeral/ |
||
|
Scapulothoracic Rotation |
|
|
|
|
|
|
|
|
Glenohumeral/Scapulothoracic |
|
|
Investigator |
Motion Ratio |
|
|
|
|
|
|
Inman et al. [1994] |
2:1 |
|
|
Freedman and Munro [1966] |
1.35:1 |
|
|
Doody et al. [1970] |
1.74:1 |
|
|
Poppen and Walker [1976] |
4.3:1 (<24° elevation) |
|
|
|
1.25:1 (>24° elevation) |
|
|
Saha [1971] |
2.3:1 (30–135° elevation) |
|
|
|
|
|
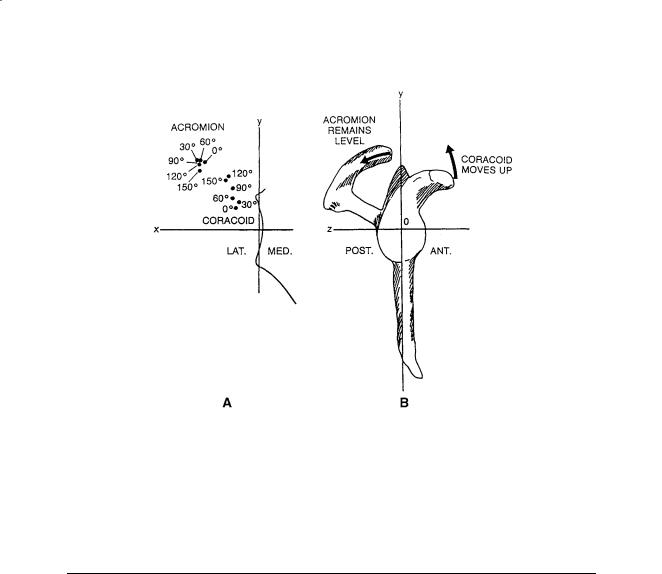
FIGURE 3.21 Rotation of the scapula on the thorax in the scapular plane. Instant centers of rotation (solid dots) are shown for each 30° interval of motion during shoulder elevation in the scapular plane from zero to 150°. The x and y axes are fixed in the scapula, whereas the X and Y axes are fixed in the thorax. From zero to 30° in the scapula rotated about its lower midportion; from 60° onward, rotation took place about the glenoid area, resulting in a medial and upward displacement of the glenoid face and a large lateral displacement of the inferior tip of the scapula. (Source: Poppen NK, Walker PS. 1976. Normal and abnormal motion of the shoulder. J Bone Joint Surg 58A:195. With permission.)
scapula rotates about its lower mid portion, and then from 60° onward the center of rotation shifts toward the glenoid, resulting in a large lateral displacement of the inferior tip of the scapula (Fig. 3.21). The center of rotation of the scapula for arm elevation is situated at the tip of the acromion as viewed from the edge on (Fig. 3.22). The mean amount of scapular twisting at maximum arm elevation is 40°. The superior tip of the scapula moves away from the thorax, and the inferior tip moves toward it.
54 |
Biomechanics: Principles and Applications |
FIGURE 3.22 (A) A plot of the tips of the acromion and coracoid process on roentgenograms taken at successive intervals of arm elevation in the scapular plane shows upward movement of the coracoid and only a slight shift in the acromion relative to the glenoid face. This finding demonstrates twisting, or external rotation, of the scapula about the x axis. (B) A lateral view of the scapula during this motion would show the coracoid process moving upward while the acromion remains on the same horizontal plane as the glenoid. (Source: Poppen NK, Walker PS. 1976. Normal and abnormal motion of the shoulder. J Bone Joint Surg 58A:195. With permission.)
3.5 Elbow
The bony structures of the elbow are the distal end of the humerus and the proximal ends of the radius and ulna. The elbow joint complex allows two degrees of freedom in motion: flexion/extension and pronation/supination. The elbow joint complex is three separate synovial articulations. The humeralulnar joint is the articulation between the trochlea of the distal radius and the trochlear fossa of the proximal ulna. The humero-radial joint is formed by the articulation between the capitulum of the distal humerus and the head of the radius. The proximal radioulnar joint is formed by the head of the radius and the radial notch of the proximal ulna.
Geometry of the Articulating Surfaces
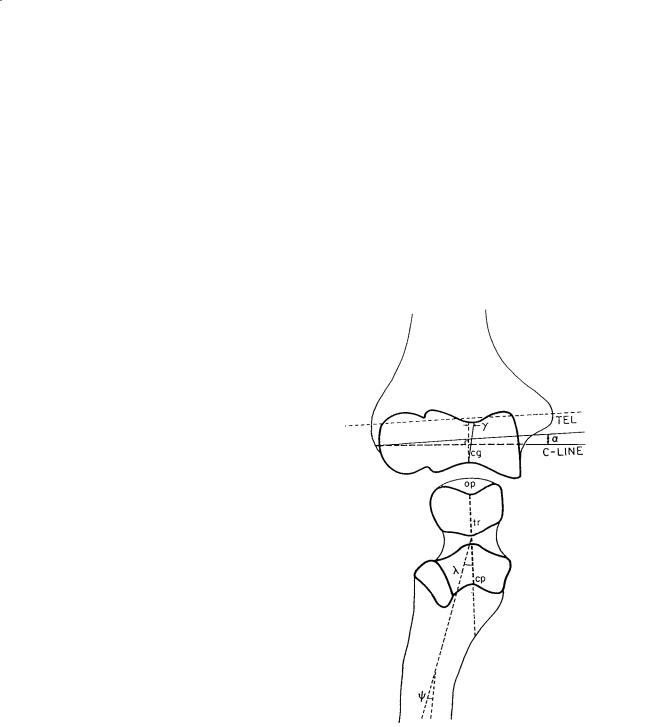
The curved, articulating portions of the trochlea and capitulum are approximately circular in a crosssection. The radius of the capitulum is larger than the central trochlear groove (Table 3.13). The centers of curvature of the trochlea and capitulum lie in a straight line located on a plane that slopes at 45–50° anterior and distal to the transepicondylar line and is inclined at 2.5° from the horizontal transverse plane [Shiba et al., 1988]. The curves of the ulnar articulations form two surfaces (coronoid and olecranon) with centers on a line parallel to the transepicondylar line but are distinct from it [Shiba et al., 1988]. The carrying angle is an angle made by the intersection of the longitudinal axis of the humerus and the forearm in the frontal plane with the elbow in an extended position. The carrying angle is contributed to, in part, by the oblique axis of the distal humerus and, in part, by the shape of the proximal ulna (Fig. 3.23).
Joint-Articulating Surface Motion |
55 |
||
|
TABLE 3.13 Elbow Joint Geometry |
|
|
|
|
|
|
|
Parameter |
Size (mm) |
|
|
|
|
|
|
Capitulum radius |
10.6 ± 1.1 |
|
|
Lateral trochlear flange radius |
10.8 ± 1.0 |
|
|
Central trochlear groove radius |
8.8 ± 0.4 |
|
|
Medial trochlear groove radius |
13.2 ± 1.4 |
|
|
Distal location of flexion/extension |
|
|
|
axis from transepicondylar line: |
|
|
|
Lateral |
6.8 ± 0.2 |
|
|
Medial |
8.7 ± 0.6 |
|
|
|
|
|
Source: Shiba R, Sorbie C, Siu DW, Bryant JT, Cooke TDV, Weavers HW. 1988. Geometry of the humeral-ulnar joint. J Orthop Res 6:897.
FIGURE 3.23 Components contributing to the carrying angles: α + λ + ψ. Key: α, angle between C-line and TEL; γ, inclination of central groove (cg); λ, angle between trochlear notch (tn); ψ, reverse angulation of shaft of ulna; TLE, transepicondylar line; C-line, line joining centers of curvature of the trochlea and capitellum; cg, central groove; op, olecranon process; tr, trochlear ridge; cp, coronoid process. α = 2.5 ± 0.0; λ = 17.5 ± 5.0 (females) and 12.0 ± 7.0 (males); ψ = –6.5 ± 0.7 (females) and –9.5 ± 3.5 (males). (Source: Shiba R, Sorbie C, Siu DW, Bryant JT, Cooke TDV, Weavers HW. 1988. Geometry of the humeral-ulnar joint. J Orthop Res 6:897. With permission.)
Joint Contact
The contact area on the articular surfaces of the elbow joint depends on the joint position and the loading conditions. Increasing the magnitude of the load not only increases the size of the contact area but shifts the locations as well (Fig. 3.25). As the axial loading is increased, there is an increased lateralization of the articular contact [Stormont et al., 1985]. The area of contact, expressed as a percentage of the total articulating surface area, is given in Table 3.14. Based on a finite element model of the humero-ulnar joint, Merz et al. [1997] demonstrated that the humero-ulnar joint incongruity brings about a bicentric distribution of contact pressure, a tensile stress exists in the notch that is the same order of magnitude as the compressive stress [Merz, 1997].

56 |
Biomechanics: Principles and Applications |
FIGURE 3.24 Contact of the ulnohumeral joint with varus and valgus loads and the elbow at 90°. Notice only minimal radiohumeral contact in this loading condition. (Source: Stormont TJ, An KN, Morrey BF, Chae EY. 1985. In elbow joint contact study: comparison of techniques. J Biomech 18(5):329. Reprinted with permission of Elsevier.)
FIGURE 3.25 Very small locus of instant center of rotation for the elbow joint demonstrates that the axis may be replicated by a single line drawn from the inferior aspect of the medial epicondyle through the center of the lateral epicondyle, which is in the center of the lateral projected curvature of the trochlea and capitellum. (Source: Modified from Morrey BF, Chao EYS. 1976. In passive motion of the elbow joint: a biomechanical analysis. J Bone Joint Surg 58A(4):501. Reprinted with permission of the Journal of Bone and Joint Surgery.)
Axes of Rotation
The axes of flexion and extension can be approximated by a line passing through the center of the trochlea, bisecting the angle formed by the longitudinal axes of the humerus and the ulna [Morrey and Chao, 1976].

Joint-Articulating Surface Motion |
|
|
57 |
||
|
TABLE 3.14 Elbow Joint Contact Area |
|
|
|
|
|
|
|
|
|
|
|
|
Total Articulating Surface |
|
|
|
|
|
Area of Ulna and |
|
|
|
|
Position |
Radial Head (mm2) |
Contact Area (%) |
||
|
Full extension |
1598 ± 103 |
8.1 |
± 2.7 |
|
|
90° flexion |
1750 ± 123 |
10.8 |
± 2.0 |
|
|
Full flexion |
1594 ± 120 |
9.5 |
± 2.1 |
|
|
|
|
|
|
|
Source: Goel VK, Singh D, Bijlani V. 1982. Contact areas in human elbow joints. J Biomech Eng 104:169.
FIGURE 3.26 During elbow flexion and extension, a linear change in the carrying angle is demonstrated, typically going from valgus in extension to varus in flexion. (Source: Morrey BF, Chao EYS. 1976. In passive motion of the elbow joint: a biomechanical analysis. J Bone Joint Surg 58A(4):501. Reprinted with permission of the Journal of Bone and Joint Surgery.)
The instant centers of flexion and extension vary within 2–3 mm of this axis (Fig. 3.25). With the elbow fully extended and the forearm fully supinated, the longitudinal axes of humerus and ulna normally intersect at a valgus angle referred to as the carrying angle. In adults, this angle is usually 10–15° and normally is greater on average in women [Zuckerman and Matsen, 1989]. As the elbow flexes, the carrying angle varies as a function of flexion (Fig. 3.26). In extension there is a valgus angulation of 10°; at full flexion there is a varus angulation of 8° [Morrey and Chao, 1976]. More recently, the three-dimensional kinematics of the ulno-humeral joint under simulated active elbow joint flexion-extension was obtained by using an electromagnetic tracking device [Tanaka et al., 1998]. The optimal axis to best represent flexion–extension motion was found to be close to the line joining the centers of the capitellum and the trochlear groove. Furthermore, the joint laxity under valgus–varus stress was also examined. With the weight of the forearm as the stress, a maximum of 7.6° valgus–varus and 5.3° of axial rotation laxity were observed.
3.6 Wrist
The wrist functions by allowing changes of orientation of the hand relative to the forearm. The wrist joint complex consists of multiple articulations of eight carpal bones with the distal radius, the structures

58 |
|
|
Biomechanics: Principles and Applications |
||||
|
TABLE 3.15 Changes of Wrist Geometry with Grasp |
|
|
|
|
||
|
|
|
|
|
|
|
|
|
|
|
|
|
|
Analysis of |
|
|
|
Resting |
Grasp |
Variance (p = level) |
|||
|
|
|
|
|
|
|
|
|
Distal radioulnar joint space (mm) |
1.6 |
± 0.3 |
1.8 |
± 0.6 |
0.06 |
|
|
Ulnar variance (mm) |
–0.2 |
± 1.6 |
0.7 |
± 1.8 |
0.003 |
|
|
Lunate, uncovered length (mm) |
6.0 |
± 1.9 |
7.6 |
± 2.6 |
0.0008 |
|
|
Capitate length (mm) |
21.5 |
± 2.2 |
20.8 |
± 2.3 |
0.0002 |
|
|
Carpal height (mm) |
33.4 |
± 3.4 |
31.7 |
± 3.4 |
0.0001 |
|
|
Carpal ulnar distance (mm) |
15.8 |
± 4.0 |
15.8 |
± 3.0 |
NS |
|
|
Carpal radial distance (mm) |
19.4 |
± 1.8 |
19.7 |
± 1.8 |
NS |
|
|
Third metacarpal length (mm) |
63.8 |
± 5.8 |
62.6 |
± 5.5 |
NS |
|
|
Carpal height ratio |
52.4 |
± 3.3 |
50.6 |
± 4.1 |
0.02 |
|
|
Carpal ulnar ratio |
24.9 |
± 5.9 |
25.4 |
± 5.3 |
NS |
|
|
Lunate uncovering index |
36.7 |
± 12.1 |
45.3 |
± 14.2 |
0.002 |
|
|
Carpal radial ratio |
30.6 |
± 2.4 |
31.6 |
± 2.3 |
NS |
|
|
Radius—third metacarpal angle (degrees) |
–0.3 ± 9.2 |
–3.1 ± 12.8 |
NS |
|||
|
Radius—capitate angle (degrees) |
0.4 |
± 15.4 |
–3.8 |
± 22.2 |
NS |
|
|
|
|
|
|
|
|
|
Note: 15 normal subjects with forearm in neutral position and elbow at 90° flexion.
Source: Schuind FA, Linscheid RL, An KN, Chao EYS. 1992. Changes in wrist and forearm configuration with grasp and isometric contraction of elbow flexors. J Hand Surg 17A:698.
of the ulnocarpal space, the metacarpals, and each other. This collection of bones and soft tissues is capable of a substantial arc of motion that augments hand and finger function.
Geometry of the Articulating Surfaces
The global geometry of the carpal bones has been quantified for grasp and active isometric contraction of the elbow flexors [Schuind et al., 1992]. During grasping there is a significant proximal migration of the radius of 0.9 mm, apparent shortening of the capitate, a decrease in the carpal height ratio, and an increase in the lunate uncovering index (Table 3.15). There is also a trend toward increase of the distal radioulnar joint with grasping. The addition of elbow flexion with concomitant grasping did not significantly change the global geometry, except for a significant decrease in the forearm interosseous space [Schuind et al., 1992].
Joint Contact
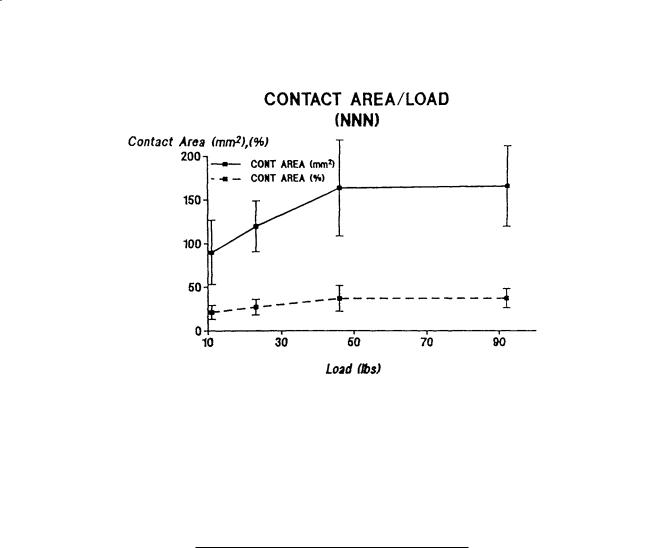
Studies of the normal biomechanics of the proximal wrist joint have determined that the scaphoid and lunate bones have separate, distinct areas of contact on the distal radius/triangular fibrocartilage complex surface [Viegas et al., 1987] so that the contact areas were localized and accounted for a relatively small fraction of the joint surface, regardless of wrist position (average of 20.6%). The contact areas shift from a more volar location to a more dorsal location as the wrist moves from flexion to extension. Overall, the scaphoid contact area is 1.47 times greater than that of the lunate. The scapho-lunate contact area ratio generally increases as the wrist position is changed from radial to ulnar deviation and/or from flexion to extension. Palmer and Werner [1984] also studied pressures in the proximal wrist joint and found that there are three distinct areas of contact: the ulno-lunate, radio-lunate, and radio-scaphoid. They determined that the peak articular pressure in the ulno-lunate fossa is 1.4 N/mm2, in the radioulnate fossa is 3.0 N/mm2, and in the radio-scaphoid fossa is 3.3 N/mm2. Viegas et al. [1989] found a nonlinear relationship between increasing load and the joint contact area (Fig. 3.27). In general, the distribution of load between the scaphoid and lunate was consistent with all loads tested, with 60% of the total contact area involving the scaphoid and 40% involving the lunate. Loads greater than 46 lbs were found to not significantly increase the overall contact area. The overall contact area, even at the highest loads tested, was not more than 40% of the available joint surface.
Joint-Articulating Surface Motion |
59 |
FIGURE 3.27 The nonlinear relation between the contact area and the load at the proximal wrist joint. The contact area was normalized as a percentage of the available joint surface. The load of 11, 23, 46, and 92 lbs. was applied at the position of neutral pronation/supination, neutral radioulnar deviation, and neutral flexion/extension. (Source: Viegas SF, Patterson RM, Peterson PD, Roefs J, Tencer A, Choi S. 1989. The effects of various load paths and different loads on the load transfer characteristics of the wrist. J Hand Surg 14A(3):458. With permission.)
Horii et al. [1990] calculated the total amount of force born by each joint with the intact wrist in the neutral position in the coronal plane and subjected to a total load of 143 N (Table 3.16). They found that
TABLE 3.16 Force Transmission at the Intercarpal Joints
Joint |
Force (N) |
|
|
Radio-ulno-carpal |
|
Ulno-triquetral |
12 ± 3 |
Ulno-lunate |
23 ± 8 |
Radio-lunate |
52 ± 8 |
Radio-scaphoid |
74 ± 13 |
Midcarpal |
|
Triquetral-hamate |
36 ± 6 |
Luno-capitate |
51 ± 6 |
Scapho-capitate |
32 ± 4 |
Scapho-trapezial |
51 ± 8 |
|
|
Note: A total of 143 N axial force applied across the wrist. Source: Horii E, Garcia-Elias M, An KN, Bishop AT, Cooney
WP, Linscheid RL, Chao EY. 1990. Effect on force transmission across the carpus in procedures used to treat Kienböck’s disease.
J Bone Joint Surg 15A(3):393.
22% of the total force in the radio-ulno-carpal joint is dissipated through the ulna 14% through the ulnolunate joint, and 18% through the ulno-triquetral joint) and 78% through the radius (46% through the scaphoid fossa and 32% through the lunate fossa). At the midcarpal joint, the scapho-trapezial joint transmits 31% of the total applied force, the scapho-capitate joint transmits 19%, the luno-capitate joint transmits 29%, and the triquetral-hamate joints transmits 21% of the load.
60 |
Biomechanics: Principles and Applications |
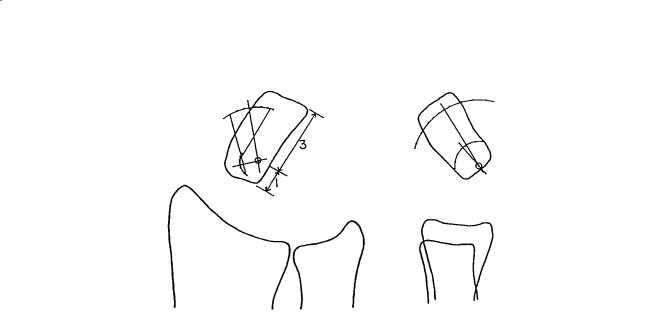
FIGURE 3.28 The location of the center of rotation during ulnar deviation (left) and extension (right), determined graphically using two metal markers embedded in the capitate. Note that during radial-ulnar deviation the center lies at a point in the capitate situated distal to the proximal end of this bone by a distance equivalent to approximately one-quarter of its total longitudinal length. During flexion-extension, the center of rotation is close to the proximal cortex of the capitate. (Source: Youm Y, McMurty RY, Flatt AE, Gillespie TE. 1978. Kinematics of the wrist: an experimental study of radioulnar deviation and flexion/extension. J Bone Joint Surg 60A(4):423. With permission.)
A limited amount of studies have been done to determine the contact areas in the midcarpal joint. Viegas et al. [1990] have found four general areas of contact: the scapho-trapezial-trapezoid (STT), the scapho-capitate (SC), the capito-lunate (CL), and the triquetral-hamate (TH). The high pressure contact area accounted for only 8% of the available joint surface with a load of 32 lbs and increased to a maximum of only 15% with a load of 118 lbs. The total contact area, expressed as a percentage of the total available joint area for each fossa was: STT = 1.3%, SC = 1.8%, CL = 3.1%, and TH = 1.8%.
The correlation between the pressure loading in the wrist and the progress of degenerative osteoarthritis associated with pathological conditions of the forearm was studied in a cadaveric model [Sato, 1995]. Malunion after distal radius fracture, tear of triangular fibrocartilage, and scapholunate dissociation were all responsible for the alteration of the articulating pressure across the wrist joint. Residual articular incongruity of the distal radius following intra-articular fracture has been correlated with early osteoarthritis. In an in vitro model, step-offs of the distal radius articular incongruity were created. Mean contact stress was significantly greater than the anatomically reduced case at only 3 mm of step-off [Anderson et al., 1996].
Axes of Rotation
The complexity of joint motion at the wrist makes it difficult to calculate the instant center of motion. However, the trajectories of the hand during radioulnar deviation and flexion/extension, when they occur in a fixed plane, are circular, and the rotation in each plane takes place about a fixed axis. These axes are located within the head of the capitate and are not altered by the position of the hand in the plane of rotation [Youm et al., 1978]. During radioulnar deviation, the instant center of rotation lies at a point in the capitate situated distal to the proximal end of this bone by a distance equivalent to approximately one-quarter of its total length (Fig. 3.28). During flexion/extension, the instant center is close to the proximal cortex of the capitate, which is somewhat more proximal than the location for the instant center of radioulnar deviation.
Normal carpal kinematics were studied in 22 cadaver specimens using a biplanar radiography method. The kinematics of the trapezium, capitate, hamate, scaphoid, lunate, and triquetrum were determined

Joint-Articulating Surface Motion |
61 |
TABLE 3.17 Individual Carpal Rotation Relative to the Radius (Degrees) (Sagittal Plane Motion of the Wrist)
|
|
|
|
|
|
|
Axis of Rotation |
|
|
|
|
|
||
|
|
|
|
|
|
|
|
|
|
|
|
|
|
|
|
|
|
X |
|
|
|
|
Y |
|
|
|
|
Z |
|
Wrist Motiona |
(+) Pronation; (–) Supination |
|
(+) Flexion; (–) Extension |
|
(+) Ulnar Deviation; (–) Radial Deviation |
|||||||||
Carpal Bone |
N-E60 N-E30 |
N-F30 |
N-F60 |
|
N-E60 |
N-E30 N-F60 |
N-E60 |
|
N-E60 |
N-E30 |
N-F30 |
N-F60 |
||
|
|
|
|
|
|
|
|
|
|
|
|
|
|
|
Trapezium (N=13) |
–0.9 |
–1.3 |
0.9 |
–1.4 |
|
–59.4 |
–29.3 |
28.7 |
54.2 |
1.2 |
0.3 |
–0.4 |
2.5 |
|
S.D. |
2.8 |
2.2 |
2.6 |
2.7 |
2.3 |
1 |
1.8 |
3 |
4 |
2.7 |
1.3 |
2.8 |
||
Capitate (N=22) |
0.9 |
–1 |
1.3 |
–1.6 |
60.3 |
–30.2 |
21.5 |
63.5 |
0 |
0 |
0.6 |
3.2 |
||
S.D. |
2.7 |
1.8 |
2.5 |
3.5 |
2.5 |
1.1 |
1.2 |
2.8 |
2 |
1.4 |
1.6 |
3.6 |
||
Hamate (N=9) |
0.4 |
–1 |
1.3 |
–0.3 |
|
–59.5 |
–29 |
28.8 |
62.6 |
2.1 |
0.7 |
0.1 |
1.8 |
|
S.D. |
3.4 |
1.7 |
2.5 |
2.4 |
1.4 |
0.8 |
10.2 |
3.6 |
4.4 |
1.8 |
1.2 |
4.1 |
||
Scaphoid (N=22) |
–2.5 |
–0.7 |
1.6 |
2 |
|
–52.3 |
–26 |
20.6 |
39.7 |
4.5 |
0.8 |
2.1 |
7.8 |
|
S.D. |
3.4 |
2.6 |
2.2 |
3.1 |
3 |
3.2 |
2.8 |
4.3 |
3.7 |
2.1 |
2.2 |
4.5 |
||
Lunate (N=22) |
1.2 |
0.5 |
0.3 |
–2.2 |
|
–29.7 |
–15.4 |
11.5 |
23 |
4.3 |
0.9 |
3.3 |
11.1 |
|
S.D. |
2.8 |
1.8 |
1.7 |
2.8 |
6.6 |
3.9 |
3.9 |
5.9 |
2.6 |
1.5 |
1.9 |
3.4 |
||
Triquetrum (N=22) |
–3.5 |
–2.5 |
2.5 |
–0.7 |
|
–39.3 |
–20.1 |
15.5 |
30.6 |
0 |
–0.3 |
2.4 |
9.8 |
|
S.D. |
3.5 |
2 |
2.2 |
3.7 |
4.8 |
2.7 |
3.8 |
5.1 |
2.8 |
1.4 |
2.6 |
4.3 |
||
|
|
|
|
|
|
|
|
|
|
|
|
|
|
|
a N-E60: neutral to 60° of extension; N-E30: neutral to 30° of extension; N-F30: neutral to 30° of flexion; N-F60: neutral to 60° of flexion. S.D. = standard deviation.
Source: Kobayashi M, Berger RA, Nagy L, et al. 1997. Normal kinematics of carpal bones: a three-dimensional analysis of carpal bone motion relative to the radius. J Biomech 30(8):787.
during wrist rotation in the sagittal and coronal plane [Kobagashi et al., 1997]. The results were expressed using the concept of the screw displacement axis and covered to describe the magnitude of rotation about and translation along three orthogonal axes. The orientation of these axes is expressed relative to the radius during sagittal plane motion of the wrist (Table 3.17). The scaphoid exhibited the greatest magnitude of rotation and the lunate displayed the least rotation. The proximal carpal bones exhibited some ulnar deviation in 60° of wrist flexion. During coronal plane motion (Table 3.18), the magnitude of radial-ulnar deviation of the distal carpal bones was mutually similar and generally of a greater magnitude than that of the proximal carpal bones. The proximal carpal bones experienced some flexion during radial deviation of the wrist and extension during ulnar deviation of the wrist.
3.7 Hand
The hand is an extremely mobile organ that is capable of conforming to a large variety of object shapes and coordinating an infinite variety of movements in relation to each of its components. The mobility of this structure is possible through the unique arrangement of the bones in relation to one another, the articular contours, and the actions of an intricate system of muscles. Theoretical and empirical evidence suggest that limb joint surface morphology is mechanically related to joint mobility, stability, and strength [Hamrick, 1996].
Geometry of the Articulating Surfaces
Three-dimensional geometric models of the articular surfaces of the hand have been constructed. The sagittal contours of the metacarpal head and proximal phalanx grossly resemble the arc of a circle [Tamai et al., 1988]. The radius of curvature of a circle fitted to the entire proximal phalanx surface ranges from 11–13 mm, almost twice as much as that of the metacarpal head, which ranges from 6–7 mm (Table 3.19). The local centers of curvature along the sagittal contour of the metacarpal heads are not fixed. The locus of the center of curvature for the subchondral bony contour approximates the locus of the center for the acute curve of an ellipse (Fig. 3.29). However, the locus of center of curvature for the articular cartilage contour approximates the locus of the obtuse curve of an ellipse.