

Biomechanics Principles and Applications - Schneck and Bronzino
.pdf192 |
Biomechanics: Principles and Applications |
and morphology of elastin and how elastin is coupled to collagen remain points of investigation. Scott and Vesely [1996] have shown that the elastin in the ventricularis consists of continuous amorphous sheets or compact meshes, while elastin in the fibrosa consists of complex arrays of large tubes that extend circumferentially across the leaflet. These tubes may surround the large circumferential collagen bundles in the fibrosa. Mechanical testing of elastin structures from the fibrosa and ventricularis separately have shown that the purpose of elastin in the aortic valve leaflet is to maintain a specific collagen fiber configuration and return the fibers to that state during cyclic loading [Vesely, 1998]. The valve’s viscoelastic properties are actually dominated by the elastic component (over the range of in vitro testing) so that the viscous effects, which are largely responsible for energy losses, are small [Thubrikar, 1990]. In addition to the collagen and elastin, clusters of lipids have been observed in the central spongiosa of porcine aortic valves. Vesely et al. [1994] have shown that the lipids tend to be concentrated at the base of the valve leaflets, while the coaptation regions and free edges of the leaflets tend to be devoid of these lipids. In addition, the spatial distribution of the lipids within the spongiosal layer of the aortic leaflets corresponded to areas in which calcification is commonly observed on bioprosthetic valves suggesting that these lipid clusters may be potential nucleation sites for calcification. In contrast, pulmonic leaflets showed a substantially lower incidence of lipids [Dunmore-Buyze et al., 1995]. The aortic valve leaflets have also been shown to be slightly stiffer than pulmonary valve leaflets, although the extensibilities and relaxation rates of the two tissues are similar [Leeson-Dietrich et al., 1995].
Using marker fluoroscopy, in which the aortic valve leaflets were surgically tagged with radio-opaque markers and imaged with high-speed x-rays, the leaflets have been shown to change length during the cardiac cycle [Thubrikar, 1990]. The cusps are longer during diastole than systole in both the radial and circumferential direction. The variation in length is greatest in the radial direction, approximately 20%, while the strain in the circumferential direction is about 10% of the normal systolic length [Lo and Vesely, 1995]. The difference in strain is due to the presence of the compliant elastin fibers aligned in this radial direction. The length change in both directions results in an increased valve surface area during diastole. During systole, the shortening of the valve leaflets helps to reduce obstruction of the aorta during the systolic ejection of blood. It should be noted that this change in area is by no means an active mechanism within the aortic valve; the valve simply reacts to the stresses it encounters in a passive manner.
In addition to this change in surface area, the aortic valve leaflets also undergo bending in the circumferential direction during the cardiac cycle. In diastole when the valve is closed, each leaflet is convex toward the ventricular side. During systole when the valve is open, the curvature changes and each leaflet is concave toward the ventricle. This bending is localized on the valve cusp near the wall of the aorta. This location is often thicker than the rest of the leaflet. The total diastolic stress in a valve leaflet has been estimated at 2.5 × 10⁶ dynes/cm2 for a strain of 15% [Thubrikar, 1990] The stress in the circumferential direction was found to be the primary load bearing element in the aortic valve. Due to the collagen fibers oriented circumferentially, the valve is relatively stiff in this direction. The strain that does occur circumferentially is primarily due to scissoring of the fibrous matrix and straightening of collagen fibers that are kinked or crimped in the presence of no external stress. However, in the radial direction, because elastin is the primary element, the valve can undergo a great deal of strain, ranging from 20 to 60% in tissue specimens [Christie, 1990; Lo and Vesely, 1995]. In the closed position, the radial stress levels are actually small compared to those in the circumferential direction. This demonstrates the importance of the lunula in ensuring that the valve seals tightly to prevent leakage. Because of their anatomical location, the lunula cause these high circumferential stress levels by enabling the aortic pressure to pull each leaflet in the circumferential direction towards the other leaflets.
The composition, properties, and dimensions of the aortic valve change with age and in the presence of certain diseases. The valve leaflets become thicker, the lunula become fenestrated, or mesh-like, and in later stages of disease the central portion of the valve may become calcified [Davies, 1980]. This thickening of the valve typically occurs on the ventricular side of the valve, in the region where the tips of the leaflets come together. Another site of calcification and fibrosis is the point of maximum cusp flexion and is thought to be a response to fatigue in the normal valve tissue.

Heart Valve Dynamics |
193 |
Valve Dynamics
The aortic valve opens during systole when the ventricle is contracting and then closes during diastole as the ventricle relaxes and fills from the atrium. Systole lasts about one third of the cardiac cycle and begins when the aortic valve opens, which typically takes only 20 to 30 msec [Bellhouse, 1969]. Blood rapidly accelerates through the valve and reaches a peak velocity after the leaflets have opened to their full extent and start to close again. Peak velocity is reached during the first third of systole and the flow begins to decelerate rapidly after the peak is reached, albeit not as fast as its initial acceleration. The adverse pressure gradient that is developed affects the low momentum fluid near the wall of the aorta more than that at the center; this causes reverse flow in the sinus region [Reul and Talukdar, 1979]. Figure 12.2 illustrates the pressure and flow relations across the aortic valve during the cardiac cycle. During systole, the pressure difference required to drive the blood through the aortic valve is on the order of a few millimeters of mercury; however, the diastolic pressure difference reaches 80 mmHg in normal individuals. The valve closes near the end of the deceleration phase of systole with very little reverse flow through the valve.
During the cardiac cycle the heart undergoes translation and rotation due to its own contraction pattern. As a result, the base of the aortic valve varies in size and also translates, mainly along the axis of the aorta. Using marker fluoroscopy to study the base of the aortic valve in dogs, Thubrikar et al. [1993] found that the base perimeter is at its largest at end diastole and decreases in size during systole; it then reaches a minimum at the end of systole and increases again during diastole. The range of this perimeter variation during the cardiac cycle was 22% for an aortic pressure variation of 120/80 mmHg. The valve annulus also undergoes translation, primarily parallel to the aortic axis. The aortic annulus moves downward toward the ventricle during systole and then recoils back toward the aorta as the ventricle fills during diastole. The annulus also experiences a slight side-to-side translation with its magnitude approximately one half the displacement along the aortic axis.
During systole, vortices develop in all three sinuses behind the leaflets of the aortic valve. The function of these vortices was first described by Leonardo da Vinci in 1513, and they have been researched extensively in this century primarily through the use of in vitro models [Bellhouse, 1969; Reul and Talukdar, 1979]. It has been hypothesized that the vortices help to close the aortic valve so that blood is prevented from returning to the ventricle during the closing process. These vortices create a transverse pressure difference that pushes the leaflets toward the center of the aorta and each other at the end of systole, thus minimizing any possible closing volume. However, as shown in vitro by Reul and Talukdar [1979], the axial pressure difference alone is enough to close the valve. Without the vortices in the sinuses, the valve still closes but its closure is not as quick as when the vortices are present. The adverse axial pressure difference within the aorta causes the low inertia flow within the developing boundary layer along the aortic wall to decelerate first and to reverse direction. This action forces the belly of the leaflets away from the aortic wall and toward the closed position. When this force is coupled with the vortices that push the leaflet tips toward the closed position, a very efficient and fast closure is obtained. Closing volumes have been estimated to be less than 5% of the forward flow [Bellhouse and Bellhouse, 1969].
The parameters that describe the normal blood flow through the aortic valve are the velocity profile, time course of the blood velocity or flow, and magnitude of the peak velocity. These are determined in part by the pressure difference between the ventricle and aorta and by the geometry of the aortic valve complex. As seen in Fig. 12.3, the velocity profile at the level of the aortic valve annulus is relatively flat. However there is usually a slight skew toward the septal wall (less than 10% of the center-line velocity) which is caused by the orientation of the aortic valve relative to the long axis of the left ventricle. This skew in the velocity profile has been shown by many experimental techniques, including hot film anemometry, Doppler ultrasound, and MRI [Paulsen and Hasenkam, 1983; Rossvol et al., 1991; Kilner et al., 1993]. In healthy individuals, blood flows through the aortic valve at the beginning of systole and then rapidly accelerates to its peak value of 1.35 ± 0.35 m/s; for children this value is slightly higher at 1.5 ± 0.3 m/s [Hatle and Angelson, 1985]. At the end of systole there is a very short period of reverse flow that can be measured with Doppler ultrasound. This reverse flow is probably either a small closing

194 |
Biomechanics: Principles and Applications |
FIGURE 12.3 Velocity profiles measured 2 cm downstream of the aortic valve with hot film anemometry in dogs [Paulsen and Hasenkam, 1983]. The timing of the measurements during the cardiac cycle is shown by the marker on the aortic flow curve.
volume or the velocity of the valve leaflets as they move toward their closed position. The flow patterns just downstream of the aortic valve are of particular interest because of their complexity and relation to arterial disease. Highly skewed velocity profiles and corresponding helical flow patterns have been observed in the human aortic arch using magnetic resonance phase velocity mapping [Kilner et al., 1993].
The pulmonic valve flow behaves similarly to that of the aortic valve, but the magnitude of the velocity is not as great. Typical peak velocities for healthy adults are 0.75 ± 0.15 m/s; again, these values are slightly higher for children at 0.9 ± 0.2 m/s [Weyman, 1994]. As seen in Fig. 12.4, a rotation of the peak velocity can be observed in the pulmonary artery velocity profile. During acceleration, the peak velocity is observed inferiorly with the peak rotating counterclockwise throughout the remainder of the ejection phase [Sloth et al., 1994]. The mean spatial profile is relatively flat, however, although there is a region

Heart Valve Dynamics |
195 |
FIGURE 12.4 Velocity profiles downstream of the human pulmonary valve obtained with magnetic resonance phase velocity mapping [Sloth, 1994]. Again, the timing of the measurements is shown by the marker on the flow curve.
of reverse flow that occurs in late systole which may be representative of flow separation. Typically, there is only a slight skew to the profile. The peak velocity is generally within 20% of the spatial mean throughout the cardiac cycle. Secondary flow patterns can also be observed in the pulmonary artery and its bifurcation. In vitro laser Doppler anemometry experiments have shown that these flow patterns are dependent on the valve geometry and thus can be used to evaluate function and fitness of the heart valve [Sung and Yoganathan, 1990].
12.2Mitral and Tricuspid Valves
The mitral (Fig. 12.5) and tricuspid valves are similar in structure with both valves composed of four primary elements: (1) the valve annulus, (2) the valve leaflets, (3) the papillary muscles, and (4) the chordae tendineae. The base of the mitral leaflets form the mitral annulus, which attaches to the atrial
196 |
Biomechanics: Principles and Applications |
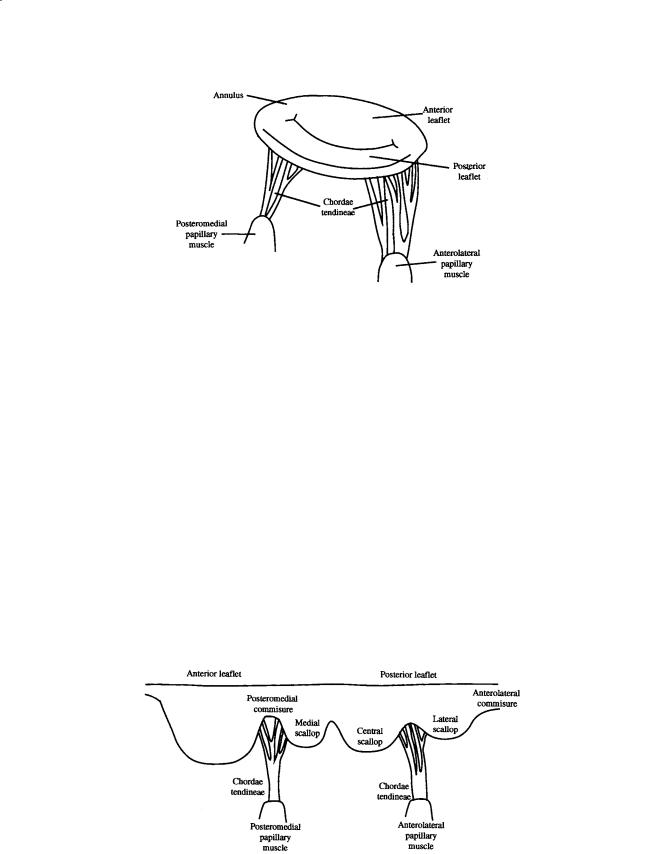
FIGURE 12.5 Schematic of the mitral valve showing the valve leaflets, papillary muscles, and chordae tendineae.
and ventricular walls, and aortic root. At the free edge of the leaflets, the chordae tendinae insert at multiple locations and extend to the tips of the papillary muscles. This arrangement provides continuity between the valve and ventricular wall to enhance valvular function. The valvular apparatus, or complex, requires an intricate interplay between all components throughout the cardiac cycle.
The mitral annulus is an elliptical ring composed of dense collagenous tissue surrounded by muscle. It goes through dynamic changes during the cardiac cycle by not only changing in size, but also by moving three-dimensionally. The circumference of the mitral annulus ranges from 8 to 12 cm during diastole. Recent studies involving the measurement of annular shape have also shown that the mitral annulus is not planar, but instead has a three-dimensional form. The annulus actually forms a saddle, or ski-slope shape [Glasson et al., 1996; Pai et al., 1995; Komoda et al., 1994; Levine et al., 1987]. This three-dimensional shape must be taken into account when non-invasively evaluating valvular function.
The mitral valve is a bileaflet valve comprised of an anterior and posterior leaflet. The leaflet tissue is primarily collagen-reinforced endothelium, but also contains striated muscle cells, non-myelinated nerve fibers, and blood vessels. The anterior and posterior leaflets of the valve are actually one continuous piece of tissue, as shown in Fig. 12.6. The free edge of this tissue shows several indentations of which two are regularly placed, called the commisures. The commisures separate the tissue into the anterior and posterior leaflets. The location of the commisures can be identified by the fan-like distribution of chordae tendinae and the relative positioning of the papillary muscles. The combined surface area of both leaflets is approximately twice the area of the mitral orifice; this extra surface area permits a large
FIGURE 12.6 Diagram of the mitral valve as a continuous piece of tissue. The posterior and anterior leaflets are indicated, as are the scallops, chordae tendineae, and papillary muscles.

Heart Valve Dynamics |
197 |
line of coaptation and ample coverage of the mitral orifice during normal function and provides compensation in cases of disease [He, 1997, 1999]. The posterior leaflet encircles roughly two-thirds of the mitral annulus and is essentially an extension of the mural endocardium from the free walls of the left atrium. The anterior leaflet portion of the annulus is a line of connection for the leaflet, the wall of the ascending aorta, the aortic valve, and the atrial septum. The anterior leaflet is slightly larger than the posterior leaflet, and is roughly semi-lunar in shape as opposed to the quadrangular-shaped posterior leaflet. The normal width and height of the anterior leaflet are approximately 3.3 cm and 2.3 cm, respectively. The height of the posterior leaflet is 1.3 cm, while the commisure height is less than 1.0 cm. The posterior leaflet typically has indentations, called scallops, that divide the leaflet into three regions:
(1) the medial, (2) central, and (3) lateral scallop [Kunzelman et al., 1994; Barlow, 1987; Roberts, 1983; Raganathan et al., 1970; Silverman and Hurst, 1968].
The mitral leaflet tissue can be divided into both a rough and clear zone. The rough zone is the thicker part of the leaflet and is defined from the free edge of the valve to the valve’s line of closure. The term “rough” is used to denote the texture of the leaflet due to the insertion of the chordae tendineae in this area. The clear zone is thinner and translucent and extends from the line of closure to the annulus in the anterior leaflet and to the basal zone in the posterior leaflet. Unlike the mitral valve, the tricuspid valve has three leaflets: (1) an anterior leaflet, (2) a posterior leaflet with a variable number of scallops, and (3) a septal leaflet. The tricuspid valve is larger and structurally more complicated than the mitral valve and the separation of the valve tissue into distinct leaflets is less pronounced than with the mitral valve. The surface of the leaflets is similar to that of the mitral valve; however, the basal zone is present in all of the leaflets [Silver et al., 1971].
Chordae tendineae from both leaflets attach to each of the papillary muscles. The chordae tendineae consist of an inner core of collagen surrounded by loosely meshed elastin and collagen fibers with an outer layer of endothelial cells. In the mitral complex structure, there are marginal and basal chordae that insert into the mitral leaflets. From each papillary muscle, several chordae originate and branch into the marginal and basal chordae. The thinner marginal chordae insert into the leaflet free edge at multiple insertion points, while the thicker basal chordae insert into the leaflets at a higher level towards the annulus. The marginal chordae function to keep the leaflets stationary while the basal chordae seem to act more as supports [Kunzelman, 1994].
The left side of the heart has two papillary muscles, called anterolateral and posteromedial, that attach to the ventricular free wall and tether the mitral valve in place via the chordae tendinae. This tethering prevents the mitral valve from prolapsing into the atrium during ventricular ejection. On the right side of the heart, the tricuspid valve has three papillary muscles. The largest one, the anterior papillary muscle, attaches to the valve at the commissure between the anterior and posterior leaflets. The posterior papillary muscle is located between the posterior and septal leaflets. The smallest papillary muscle, called the septal muscle, is sometimes not even present. Improper tethering of the leaflets will result in valve prolapse during ventricular contraction, permitting the valve leaflets to extend into the atrium. This incomplete apposition of the valve leaflets can cause regurgitation, which is leaking of the blood being ejected back into the atrium.
Mechanical Properties
Studies on the mechanical behavior of the mitral leaflet tissue have been conducted to determine the key connective tissue components which influence the valve function. Histological studies have shown that the tissue is composed of three layers which can be identified by differences in cellularity and collagen density. Analysis of the leaflets under tension indicated that the anterior leaflet would be more capable of supporting larger tensile loads than the posterior leaflet. The differences between the mechanical properties between the two leaflets may require different material selection for repair or replacement of the individual leaflets [Kunzelman et al., 1993a, b].
Studies have also been done on the strength of the chordae tendinae. The tension of chordae tendineae in dogs was monitored throughout the cardiac cycle by Salisbury and co-workers [1963]. They found

198 |
Biomechanics: Principles and Applications |
that the tension only paralleled the left ventricular pressure tracings during isovolumic contraction, indicating slackness at other times in the cycle. Investigation of the tensile properties of the chordae tendineae at different strain rates by Lim and Bouchner [1975] found that the chordae had a non-linear stress–strain relationship. They found that the size of the chordae had a more significant effect on the development of the tension than did the strain rate. The smaller chordae with a cross-sectional area of 0.001 to 0.006 cm2 had a modulus of 2 × 10⁹ dynes/cm2, while larger chordae with a cross-sectional area of 0.006 to 0.03 cm2 had a modulus of 1 × 10⁹ dynes/cm2.
A theoretical study of the stresses sustained by the mitral valve was performed by Ghista and Rao [1972]. This study determined that the stress level can reach as high as 2.2 × 10⁶ dynes/cm2 just prior to the opening of the aortic valve, with the left ventricular pressure rising to 150 mmHg. A mathematical model has also been created for the mechanics of the mitral valve. It incorporates the relationship between chordae tendineae tension, left ventricular pressure, and mitral valve geometry [Arts et al., 1983]. This study examined the force balance on a closed valve, and determined that the chordae tendinae force was always more than half the force exerted on the mitral valve orifice by the transmitral pressure gradient. During the past 10 years, computational models of mitral valve mechanics have been developed, with the most advanced modeling being three-dimensional finite element models (FEMs) of the complete mitral apparatus. Kunzelman and co-workers [1993, 1998] have developed a model of the mitral complex that includes the mitral leaflets, chordae tendinae, contracting annulus, and contracting papillary muscles. From these studies, the maximum principal stresses found at peak loading (120 mmHg) were 5.7 × 10⁶ dynes/cm2 in the annular region, while the stresses in the anterior leaflet ranged from 2 × 10⁶ to 4 × 10⁶ dynes/cm2. This model has also been used to evaluate mitral valve disease, repair in chordal rupture, and valvular annuloplasty.
Valve Dynamics
The valve leaflets, chordae tendineae, and papillary muscles all participate to ensure normal functioning of the mitral valve. During isovolumic relaxation, the pressure in the left atrium exceeds that of the left ventricle, and the mitral valve cusps open. Blood flows through the open valve from the left atrium to the left ventricle during diastole. The velocity profiles at both the annulus and the mitral valve tips have been shown to be skewed [Kim et al., 1994] and therefore are not flat as is commonly assumed. This skewing of the inflow profile is shown in Fig. 12.7. The initial filling is enhanced by the active relaxation of the ventricle, maintaining a positive transmitral pressure. The mitral velocity flow curve shows a peak in the flow curve, called the E-wave, which occurs during the early filling phase. Normal peak E-wave velocities in healthy individuals range from 50 to 80 cm/s [Samstad et al., 1989; Oh et al., 1997]. Following active ventricular relaxation, the fluid begins to decelerate and the mitral valve undergoes partial closure. Then the atrium contracts and the blood accelerates through the valve again to a secondary peak, termed the A-wave. The atrium contraction plays an important role in additional filling of the ventricle during late diastole. In healthy individuals, velocities during the A-wave are typically lower than those of the E-wave, with a normal E/A velocity ratio ranging from 1.5 to 1.7 [Oh et al., 1997]. Thus, normal diastolic filling of the left ventricle shows two distinct peaks in the flow curve with no flow leaking back through the valve during systole.
The tricuspid flow profile is similar to that of the mitral valve, although the velocities in the tricuspid valve are lower because it has a larger valve orifice. In addition, the timing of the valve opening is slightly different. Since the peak pressure in the right ventricle is less than that of the left ventricle, the time for right ventricular pressure to fall below the right atrial pressure is less than the corresponding time period for the left side of the heart. This leads to a shorter right ventricular isovolumic relaxation and thus an earlier tricuspid opening. Tricuspid closure occurs after the mitral valve closes since the activation of the left ventricle precedes that of the right ventricle [Weyman, 1994].
A primary focus in explaining the fluid mechanics of mitral valve function has been understanding the closing mechanism of the valve. Bellhouse [1972] first suggested that the vortices generated by ventricular filling were important for the partial closure of the mitral valve following early diastole. Their

Heart Valve Dynamics |
199 |
FIGURE 12.7 Two-dimensional transmitral velocity profiles recorded at the level of the mitral annulus in a pig [Kim et al., 1994]: (a) systole; (b) peak E-wave; (c) deceleration phase of early diastole; (d) mid-diastolic period (diastasis); (e) peak A-wave; (f) time averaged diastolic cross-sectional mitral velocity profile. (Reprinted with permission from the American College of Cardiology, J. Am. Coll. Cardiol. 24:532–545.)
in vitro experiments suggested that without the strong outflow tract vortices, the valve would remain open at the onset of ventricular contraction, thus resulting in a significant amount of mitral regurgitation before complete closure. Later in vitro experiments by Reul and Talukdar [1981] in a left ventricle model made from silicone suggested that an adverse pressure differential in mid-diastole could explain both the flow deceleration and the partial valve closure, even in the absence of a ventricular vortex. Thus, the studies by Reul and Talukdar suggest that the vortices may provide additional closing effects at the initial stage; however, the pressure forces are the dominant effect in valve closure. A more unified theory of valve closure put forth by Yellin and co-workers [1981] includes the importance of chordal tension, flow

200 |
Biomechanics: Principles and Applications |
FIGURE 12.8 Magnetic resonance image of a healthy individual during diastole. An outline of the interior left ventricle (LV) is indicated in white as are the mitral valve leaflets (MV) and the aorta (AO). Velocity vectors were obtained from MRI phase velocity mapping and superimposed on the anatomical image.
deceleration, and ventricular vortices, with chordal tension being a necessary condition for the other two. Their animal studies indicated that competent valve closure can occur even in the absence of vortices and flow deceleration. Recent studies using magnetic resonance imaging to visualize the three-dimen- sional flow field in the left ventricle showed that in normal individuals a large anterior vortex is present at initial partial closure of the valve, as well as following atrial contraction [Kim et al., 1995]. Studies conducted in our laboratory using magnetic resonance imaging of healthy individuals clearly show the vortices in the left ventricle [Walker et al., 1996], which may be an indication of normal diastolic function. An example of these vortices is presented in Fig. 12.8.
Another area of interest has been the motion of the mitral valve complex. The heart moves throughout the cardiac cycle; similarly, the mitral apparatus moves and changes shape. Recent studies have been conducted which examined the three-dimensional dynamics of the mitral annulus during the cardiac cycle. [Pai et al., 1995; Glasson et al., 1996; Komoda et al., 1994; Ormiston et al., 1981]. These studies have shown that during systole the annular circumference decreases from the diastolic value due to the contraction of the ventricle, and this reduction in area ranges from 10 to 25%. This result agrees with an animal study of Tsakiris and co-workers [1971] that looked at the difference in the size, shape, and position of the mitral annulus at different stages in the cardiac cycle. They noted an eccentric narrowing of the annulus during both atrial and ventricular contractions that reduced the mitral valve area by 10 to 36% from its peak diastolic area. This reduction in the annular area during systole is significant, resulting in a smaller orifice area for the larger leaflet area to cover. Not only does the annulus change size, but it also translates during the cardiac cycle. The movement of the annulus towards the atrium has been suggested to play a role in ventricular filling, possibly increasing the efficiency of blood flow into the ventricle. During ventricular contraction, there is a shortening of the left ventricular chamber along its longitudinal axis, and the mitral and tricuspid annuli move toward the apex [Pai et al., 1995; Alam and Rosenhamer, 1992; Hammarström et al., 1991; Simonson and Schiller, 1989].
The movement of the papillary muscles is also important in maintaining proper mitral valve function. The papillary muscles play an important role in keeping the mitral valve in position during ventricular contraction. Abnormal strain on the papillary muscles could cause the chordae to rupture, resulting in mitral regurgitation. It is necessary for the papillary muscles to contract and shorten during systole to prevent mitral prolapse; therefore, the distance between the apex of the heart to the mitral apparatus is important. The distance from the papillary muscle tips to the annulus was measured in normal individuals during systole and was found to remain constant [Sanfilippo et al., 1992]. In patients with mitral

Heart Valve Dynamics |
201 |
valve prolapse, however, this distance decreased, corresponding to a superior displacement of the papillary muscle towards the annulus.
The normal function of the mitral valve requires a balanced interplay between all of the components of the mitral apparatus, as well as the interaction of the atrium and ventricle. Engineering studies into mitral valve function have provided some insight into its mechanical properties and function. Further fundamental and detailed studies are needed to aid surgeons in repairing the diseased mitral valve and in understanding the changes in function due to mitral valve pathologies. In addition, these studies are crucial for improving the design of prosthetic valves that more closely replicate native valve function.
References
Alam, M. and Rosenhamer, G. 1992. Atrioventricular plane displacement and left ventricular function.
J. Am. Soc. Echocardiogr. 5:427–433.
Arts, T., Meerbaum, S., Reneman, R., and Corday, E. 1983. Stresses in the closed mitral valve: a model study. J. Biomechanics 16:539–547.
Barlow, J.B. 1987. Perspectives on the Mitral Valve. F.A. Davis Company, Philadelphia, PA.
Bellhouse, B.J. 1969. Velocity and pressure distributions in the aortic valve. J. Fluid. Mech. 37:587–600. Bellhouse, B.J. 1972. The fluid mechanics of a model mitral valve and left ventricle. Cardiovasc. Res.
6:199–210.
Bellhouse, B.J. and Bellhouse, F. 1969. Fluid mechanics of model normal and stenosed aortic valves. Circ. Res. 25:693–704.
Christie, G.W. 1990. Anatomy of aortic heart valve leaflets: the influence of glutaraldehyde fixation on function. Eur. J. Cardio-Thorac. Surg. 6(suppl. 1):S25–S33.
David, H., Boughner, D.R., Vesely, I., and Gerosa, G. 1994. The pulmonary valve: is it mechanically suitable for use as an aortic valve replacement? ASAIO J. 40:206–212.
Davies, M.J. 1980. Pathology of Cardiac Valves. Butterworths, London.
Dunmore-Buyze, J., Boughner, D.R., Macris, N., and Vesely, I. 1995. A comparison of macroscopic lipid content within porcine pulmonary and aortic valves: implications for bioprosthetic valves.
J. Thorac. Cardiovasc. Surg. 110:1756–1761.
Emery, R.W. and Arom, K.V. 1991. The Aortic Valve. Hanley & Belfus, Philadelphia, PA.
Ghista, D.N. and Rao, A.P. 1972. Structural mechanics of the mitral valve: stresses sustained by the valve; non-traumatic determination of the stiffness of the in vivo valve. J. Biomechanics 5:295–307.
Glasson, J.R., Komeda, M., Daughters, G.T., Niczyporuk, M.A., Bolger, A.F., Ingels, N.B., and Miller, D.C. 1996. Three-dimensional regional dynamics of the normal mitral annulus during left ventricular ejection. J. Thorac. Cardiovasc. Surg. 111:574–585.
Gramiak, R. and Shah, P.M. 1970. Echocardiography of the normal and diseased aortic valve. Radiology 96:1.
Hammarström, E., Wranne, B., Pinto, F.J., Puryear, J., and Popp, R.L. 1991. Tricuspid annular motion.
J. Am. Soc. Echocardiogr. 4:131–139.
Hatle, L. and Angelsen, B. 1985. Doppler Ultrasound in Cardiology Physical Principals and Clinical Applications. Lea & Febiger, Philadelphia, PA.
He, S., Fontaine, A.A., Schwammenthal, E., Yoganathan, A.P., and Levine, R.A. 1997. Integrated mechanism for functional mitral regurgitation: leaflet elongation versus coapting force: in vitro study. Circulation 96(6):1826–1834.
He, S., Lemmon, J.D., Weston, M.W., Jensen, M.O., Levine, R.A., and Yoganathan, A.P. 1999. Mitral valve compensation for annular dilatation: in vitro study into the mechanisms of functional mitral regurgitation with an adjustable annulus model. J. Heart Valve Dis. 8:294–302.
Kilner, P.J., Yang, G.Z., Mohiaddin, R.H., Firmin, D.N., and Longmore, D.B. 1993. Helical and retrograde secondary flow patterns in the aortic arch studied by three-directional magnetic resonance velocity mapping. Circulation 88(part I):2235–2247.