

Biomechanics Principles and Applications - Schneck and Bronzino
.pdf242 |
Biomechanics: Principles and Applications |
16.1 Definitions
Capacitance
Capacitance is a general term that relates the magnitude of contained volume to the transmural pressure across the vessel walls and is defined by the pressure–volume relationship. In living blood vessels, the pressure–volume relationship is complex and nonlinear. At transmural pressure near zero, there is a finite volume within the vessels (see definition of unstressed volume). If this volume is then removed from the vessels, there is only a small decrease in transmural pressure as the vessel collapses from a circular crosssection to an elliptical one. This is especially true for superficial or isolated venous vessels. However, for vessels which are tethered or embedded in tissue a negative pressure may result without appreciably changing the shape of the vessels. With increases in contained volume, the vessel becomes distended, and there is a concomitant increase in transmural pressure. The incremental change in volume to incremental change in transmural pressure is often relatively constant. At very high transmural pressures vessels become stiffer, and the incremental volume change to transmural pressure change is small. Because all blood vessels exhibit these nonlinearities, no single parameter can describe capacitance; instead, the entire pressure–volume relationship must be considered.
Compliance
Vascular compliance (C) is defined as the slope of the pressure-volume relationship. It is the ratio of the change in incremental volume (∆V) to a change in incremental transmural pressure (∆P). Thus C = ∆V/∆P. Because the pressure–volume relationship is nonlinear, the slope of the relationship is not constant over its full range of pressures, and so the compliance should be specified at a given pressure. Units of compliance are those of volume divided by pressure, usually reported in ml/mmHg. Values are typically normalized to wet tissue weight or to total body weight. When the compliance is normalized by the total contained blood volume, it is termed the vascular distensibility and represents the fractional change in volume (∆V/V) per change in transmural pressure; D = (∆V/V)∆P, where V is the volume at control or at zero transmural pressure.
Unstressed Volume
Unstressed volume (V0) is the volume in the vascular system when the transmural pressure is zero. It is a calculated volume obtained by extrapolating the relatively linear segment of the pressure–volume relationship over the normal operating range to zero transmural pressure. Many studies have shown that reflexes and drugs have quantitatively more influence on V0 than on the compliance.
Stressed Volume
The stressed volume (Vs) is the volume of blood in the vascular system that must be removed to change the computed transmural pressure from its prevailing value to zero transmural pressure. It is computed as the product of the vascular compliance and transmural distending pressure: Vs = C × P. The total contained blood volume at a specific pressure (P) is the sum of stressed and unstressed volume. The unstressed volume is then computed as the total blood volume minus the stressed volume. Because of the marked nonlinearity around zero transmural pressure and the required extrapolation, both V0 and Vs are virtual volumes.
Capacity
Capacity refers to the amount of blood volume contained in the blood vessels at a specific distending pressure. It is the sum of the unstressed volume and the stressed volume, V = V0 + Vs.

The Venous System |
243 |
Mean Filling Pressure
If the inflow and outflow of an organ are suddenly stopped, and blood volume is redistributed so that all pressures within the vasculature are the same, this pressure is the mean filling pressure [5]. This pressure can be measured for the systemic or pulmonary circuits or the body as a whole. The arterial pressure often does not equal the venous pressure as flow is reduced to zero, because blood must move from the distended arterial vessels to the venous beds during the measurement maneuver, and flow may stop before equilibrium occurs. This is because smooth-muscle activity in the arterial vessels, rheological properties of blood, or high interstitial pressures act to impede the flow, thus corrections must often be made [4,5]. The experimentally measured mean filling pressure provides a good estimate of Pv , (the pressure in the minute venules), for estimating venous stressed volume.
Venous Resistance
Venous resistance (R) refers to the hindrance to blood flow through the venous vasculature caused by friction of the moving blood along the venous vascular wall. By definition it is the ratio of the pressure gradient between the entrance of the venous circulation, namely the capillaries, and the venous outflow divided by the venous flow rate. Thus,
R = |
(Pc |
= Pra ) |
|
|
|
(16.1) |
|
|
|
||
|
|
F |
|
where R is the venous resistance, Pc is the capillary pressure, Pra is the right atrial pressure, and F is the venous flow. As flow is decreased to zero, arterial closure may occur, leading to a positive perfusion pressure at zero flow. With partial collapse of veins, a Starling resistor-like condition is present in which an increase in outlet pressure has no influence on flow until the outlet pressure is greater than the “waterfall” pressure.
Venous Inertance
Venous inertance (Iv) is the opposition to a change in flow rate related to the mass of the bolus of blood that is accelerated or decelerated. The inertance Iv for a cylindrical tube with constant cross-sectional area is Iv = Lρ/A, where L is the length of the vessel, ρ is the density of the blood, and A is the crosssectional area [9].
16.2 Methods To Measure Venous Characteristics
Our knowledge of the nature and role of the capacitance characteristics of the venous system has been limited by the difficulty of measuring the various variables needed to compute parameter values. State- of-the-art equipment is often needed because of the low pressures and many disturbing factors present. Many of the techniques that have been used to measure venous capacitance require numerous assumptions that may not be correct or are currently impossible to evaluate [4].
Resistance
For the estimate of vascular resistance, the upstream to outflow pressure gradient across the tissues must be estimated along with a measure of flow. Pressures in large vessels are measured with a catheter connected to a pressure transducer, which typically involves measurement of minute changes in resistance elements attached to a stiff diaphragm which flexes proportionally to the pressure. For the veins in tissue, the upstream pressure, just downstream from the capillaries, is much more difficult to measure because of the minute size (ca. 15 µm) of the vessels. For this a servo-null micropipette technique may be used.

244 |
Biomechanics: Principles and Applications |
A glass micropipette with a tip diameter of about 2 m is filled with a 1–2 mol saline solution. When the pipette is inserted into a vein, the pressure tends to drive the lower conductance blood plasma into the pipette. The conductance is measured using an AC-driven bridge. A servosystem, driven by the imbalance signal, is used to develop a counter pressure to maintain the interface between the lowconductance filling solution and the plasma near the tip of the pipette. This counter pressure, which equals the intravascular pressure, is measured with a pressure transducer. Careful calibration is essential.
Another approach for estimating the upstream pressure in the veins is to measure the mean filling pressure of the organ (see above) and assume that this pressure is the upstream venous pressure. Because this venous pressure must be less than the capillary pressure and because most of the blood in an organ is in the small veins and venules, this assumption, though tenuous, is not unreasonable. To measure flow many approaches are available including electromagnetic, transit-time ultrasonic, or Doppler ultrasonic flowmeters. Usually the arterial inflow is measured with the assumption that the outflow is the same. Indicator dilution techniques are also used to estimate average flow. They are based on the principle that the reduction in concentration of infused indicator is inversely proportional to the rate of flow. Either a bolus injection or a continuous infusion may be used. Adequacy of mixing of indicator across the flow stream, lack of collateral flows, and adequately representative sampling must be considered [2].
Capacitance
For estimating the capacitance parameters of the veins, contained volume, rather than flow, and transmural pressure, rather than the longitudinal pressure gradient, must be measured. Pressures are measured as described above. For the desired pressure–volume relationship the total contained volume must be known.
Techniques used to measure total blood volume include indicator dilution. The ratio of the integral of indicator concentration time to that of concentration is used to compute the mean transit time (MIT) following the sudden injection of a bolus of indicator [2,4]. The active volume is the product of MTT and flow, with flow measured as outlined above. Scintigraphy provides an image of the distribution of radioactivity in tissues. A radioisotope, such as technicium 99 that is bound to red blood cells which in turn are contained within the vasculature, is injected and allowed to equilibrate. A camera, with many collimating channels sensitive to the emitted radiation, is placed over the tissue. The activity recorded is proportional to the volume of blood. Currently it is not possible to accurately calibrate the systems to provide measures of blood volume because of uncertain attenuation of radiation by the tissue and distance. Furthermore, delimiting a particular organ within the body and separating arterial and venous segments of the circulation are difficult.
Compliance
To estimate compliance, changes in volume are needed. This is generally easier than measuring the total blood volume. Using plethysmography, a rigid container is placed around the organ, and a servo system functions to change the fluid volume in the chamber to maintain the chamber pressure-constant. The consequent volume change is measured and assumed to be primarily venous, because most of the vascular volume is venous. With a tight system and careful technique, at the end of the experiment both inflow and outflow blood vessels can be occluded and then the contained blood washed out and measured to provide a measure of the total blood volume [12].
Gravimetric Techniques
Gravimetric techniques can be used to measure changes in blood volume. If the organ can be isolated and weighed continuously with the blood vessels intact, changes in volume can be measured in response to drugs or reflexes. With an important modification, this approach can be applied to an organ or the systemic circulation; the tissues are perfused at a constant rate, and the outflow is emptied at a constant pressure into a reservoir. Because the reservoir is emptied at a constant rate for the perfusion, changes

The Venous System |
245 |
in reservoir volume reflect an opposite change in the perfused tissue blood volume [8]. To measure compliance, the outflow pressure is changed (2–5 mmHg) and the corresponding change in reservoir volume noted. With the inflow and outflow pressure held constant, the pressure gradients are assumed to be constant so that 100% of an outflow pressure change can be assumed to be transmitted to the primary capacitance vessels. Any reflex or drug-induced change in reservoir volume may be assumed to be inversely related to an active change in vascular volume [7,8,10]. If resistances are also changed by the reflex or drug, then corrections are needed and the interpretations are more complex.
Outflow Occlusion
If the outflow downstream from the venous catheter is suddenly occluded, the venous pressure increases, and its rate of increase is measured. The rate of inflow is also measured so that the compliance can be estimated as the ratio flow to rate of pressure rise: Compliance in ml/mmHg = (flow in ml/min)/(rate of venous pressure rise in mmHg/min). The method is predicated on the assumption that the inflow continues at a constant rate and that there is no pressure gradient between the pressure measuring point and the site of compliance for the first few seconds of occlusion when the rate of pressure rise is measured.
Integral of Inflow Minus Outflow
With this technique both inflow and outflow are measured and the difference integrated to provide the volume change during an experimental forcing. If there is a decrease in contained volume, the outflow will be transiently greater than the inflow. The volume change gives a measure of the response to drugs or reflexes. Following a change in venous pressure, the technique can be used to measure compliance. Accurate measures of flow are needed. Serious errors can result if the inflow is not measured but is only assumed to be constant during the experimental protocol. With all methods dependent on measured or controlled flow, small changes in zero offset, which is directly or indirectly integrated, leads to serious error after about 10 minutes, and so the methods are not useful for long-term or slow responses.
16.3 Typical Values
Cardiac output, the sine qua non of the cardiovascular system, averages about 100 ml/(min-kg). It is about 90 in humans, is over 110 ml/(min-kg) in dogs and cats, and is even higher on a body weight basis in small animals such as rats and mice. The mean arterial blood pressure in relaxed, resting, conscious mammals averages about 90 mmHg. The mean circulatory filling pressure averages about 7 mmHg, and the central venous pressure just outside the right heart about 2 mmHg. The blood volume of the body is about 75 ml/kg, but in humans it is about 10% less, and it is larger in small animals. It is difficult to measure accurately because the volume of distribution of the plasma is about 10% higher than that of the red blood cells.
Vascular compliance averages about 2 ml (mmHg-kg body weight). The majority is in the venules and veins. Arterial compliance is only about 0.05 ml/mmHg-kg). Skeletal muscle compliance is less than that of the body as a whole, whereas the vascular compliance of the liver is about 10 times that of other organs. The stressed volume is the product of compliance and mean filling pressure and so is about 15 ml/kg. By difference, the unstressed volume is about 60 ml/kg.
As flow is increased through a tissue, the contained volume increases even if the outflow pressure is held constant, because there is a finite pressure drop across the veins which is increased as flow increases. This increase in upstream distending pressure acts to increase the contained blood volume. The volume sensitivity to flow averages about 0.1 ml per 1 ml/min change in flow [6]. For the body as a whole, the sensitivity is about 0.25 ml per 1 ml/min with reflexes blocked, and with reflexes intact it averages about 0.4 ml/min3. Using similar techniques, it appears that the passive compensatory volume redistribution from the peripheral toward the heart during serious left heart failure is similar in magnitude to a reflexengendered redistribution from activation of venous smooth muscle [6].

246 |
Biomechanics: Principles and Applications |
The high-pressure carotid sinus baroreceptor reflex system is capable of changing the venous capacitance [10]. Over the full operating range of the reflex it is capable of mobilizing up to 7.5 ml/kg of blood by primarily changing the unstressed vascular volume with little or no changes in venous compliance [7,8]. Although this represents only a 10% change in blood volume, it can cause nearly a 100% change in cardiac output. It is difficult to say with confidence what particular organ and/or tissue is contributing to this blood volume mobilization. Current evidence suggests that the splanchnic vascular bed contributes significantly to the capacitance change, but this also may vary between species [11].
Acknowledgments
This work was supported by National Heart Lung and Blood Institute grants HL 19039 and HL 07723.
References
1.Furey SAI, Zieske H, Levy MN. 1984. The essential function of the right heart. Am Heart J 107:404.
2.Lassen NA, Perl W. 1979. Tracer Kinetic Methods in Medical Physiology. New York, Raven Press.
3.Numao Y, Iriuchijima J. 1977. Effect of cardiac output on circulatory blood volume. Jpn J Physiol 27:145.
4.Rothe CF. 1983. Venous system: physiology of the capacitance vessels. In JT Shepherd, FM Abboud (Eds.), Handbook of Physiology: The Cardiovascular System, Sec. 2, Vol. 3, Pt. 1, pp 397–452. Bethesda, MD, American Physiology Society.
5.Rothe CF. 1993. Mean circulatory filling pressure: its meaning and measurement. J Appl Physiol 74:499.
6.Rothe CF, Gaddis ML. 1990. Autoregulation of cardiac output by passive elastic characteristics of the vascular capacitance system. Circulation 81:360.
7.Shoukas AA, MacAnespie CL, Brunner MJ et al. 1981. The importance of the spleen in blood volume shifts of the systemic vascular bed caused by the carotid sinus baroreceptor reflex in the dog. Circ Res 49:759.
8.Shoukas AA, Sagawa K. 1973. Control of total systemic vascular capacity by the carotid sinus baroreceptor reflex. Circ Res 33:22.
9.Rose W, Shoukas AA. 1993. Two-port analysis of systemic venous and arterial impedances. Am J Physiol 265(Heart Circ Physiol 34):H1577.
10.Shoukas AA. 1993. Overall systems analysis of the carotid sinus baroreceptor reflex control of the circulation. Anesthesiology 79:1402.
11.Haase E, Shoukas AA. 1991. The role of the carotid sinus baroreceptor reflex on pressure and diameter relations of the microvasculature of the rat intestine. Am J Physiol 260:H752.
12.Zink J, Delaive J, Mazerall E, Greenway CV. 1976. An improved plethsmograph with servo control of hydrostatic pressure. J Appl Physiol 41(1):107.

17
Mechanics of Tissue and Lymphatic Transport
17.1 |
Introduction ..................................................................... |
247 |
17.2 Basic Concepts of Tissue and Lymphatic |
|
|
|
Transport........................................................................... |
248 |
Alan R. Hargen |
Transcapillary Filtration • Starling Pressures and Edema |
|
|
Prevention • Interstitial Flow and Lymph Formation |
• |
University of California, San Diego and |
|
|
|
Lymphatic Architecture • Lymphatic Morphology • |
|
NASA Ames Research Center |
|
|
|
Lymphatic Network Display • Mechanics of Lymphatic |
|
Geert W. Schmid-Schönbein |
Values • Lymph Pump Mechanisms • Tissue Mechanical |
|
University of California, San Diego |
Motion and Lymphatic Pumpng |
|
17.1Introduction
Transport of fluid and metabolites from blood to tissue is critically important for maintaining the viability and function of cells within the body. Similarly, transport of fluid and waste products from tissue to the lymphatic system of vessels and nodes is also crucial to maintain tissue and organ health. Therefore, it is important to understand the mechanisms for transporting fluid containing microand macromolecules from blood to tissue and the drainage of this fluid into the lymphatic system. Because of the succinct nature of this chapter, readers are encouraged to consult more complete reviews of blood, tissue, and lymphatic transport by Aukland and Reed [1993], Bert and Pearce [1984], Casley-Smith [1982], Curry [1984], Hargens [1986], Jain [1987], Lai-Fook [1986], Levick [1984], Reddy [1986], Schmid-Schönbein [1990], Schmid-Schönbein and Zweifach [1994], Staub [1988], Staub, Hogg, and Hargens [1987], Taylor and Granger [1984], Zweifach and Lipowsky [1984], and Zweifach and Silverberg [1985].
Most previous studies of blood, tissue, and lymphatic transport have used isolated organs or whole animals under general anesthesia. Under these conditions, transport of fluid and metabolites is artificially low in comparison to animals which are actively moving. In some cases, investigators employed passive motion by connecting an animal’s limb to a motor in order to facilitate studies of blood to lymph transport and lymphatic flow. However, new methods and technology allow studies of physiologically active animals so that a better understanding of the importance of transport phenomena in moving tissues is now apparent. Therefore, the major focus of this chapter emphasizes recent developments in the understanding of the mechanics of tissue and lymphatic transport.
The majority of the fluid that is filtered from the microcirculation into the interstitial space is carried out of the tissue via the lymphatic network. This unidirectional transport system originates with a set of blind channels in distal regions of the microcirculation. It carries a variety of interstitial molecules, proteins, metabolites, and even cells along channels deeply embedded in the tissue parenchyma towards a set of sequential lymph nodes and eventually back into the venous system via the right and left thoracic ducts. The lymphatics are the pathways for immune surveillance by the lymphocytes and thus are one of the important highways of the immune system.
0-8493-1492-5/03/$0.00+$.50 © 2003 by CRC Press LLC

248 |
Biomechanics: Principles and Applications |
17.2Basic Concepts of Tissue and Lymphatic Transport
Transcapillary Filtration
Because lymph is formed from fluid filtered from the blood, an understanding of transcapillary exchange must be considered first. Usually pressure parameters favor filtration of fluid across the capillary wall to the interstitium (Jc) according to the Starling–Landis equation:
|
Jc = Lp A (Pc − Pt )− σ p (πc |
− πt ) |
(17.1) |
|
[ |
] |
|
where: Jc |
= net transcapillary fluid transport |
|
|
Lp |
= hydraulic conductivity of capillary wall |
|
|
A |
= capillary surface area |
|
|
Pc |
= capillary blood pressure |
|
|
Pt |
= interstitial fluid pressure |
|
|
σp = reflection coefficient for protein |
|
|
|
πc |
= capillary blood colloid osmotic pressure |
|
|
πt |
= interstitial fluid colloid osmotic pressure |
|
|
In many tissues, fluid transported out of the capillaries is passively drained by the initial lymphatic vessels so that:
Jc = J1 |
(17.2) |
where Jl = lymph flow. Pressure within the initial lymphatic vessels, Pl, depends on higher interstitial fluid pressure Pt for establishing lymph flow:
Pt ≥ P1 |
(17.3) |
Starling Pressures and Edema Prevention
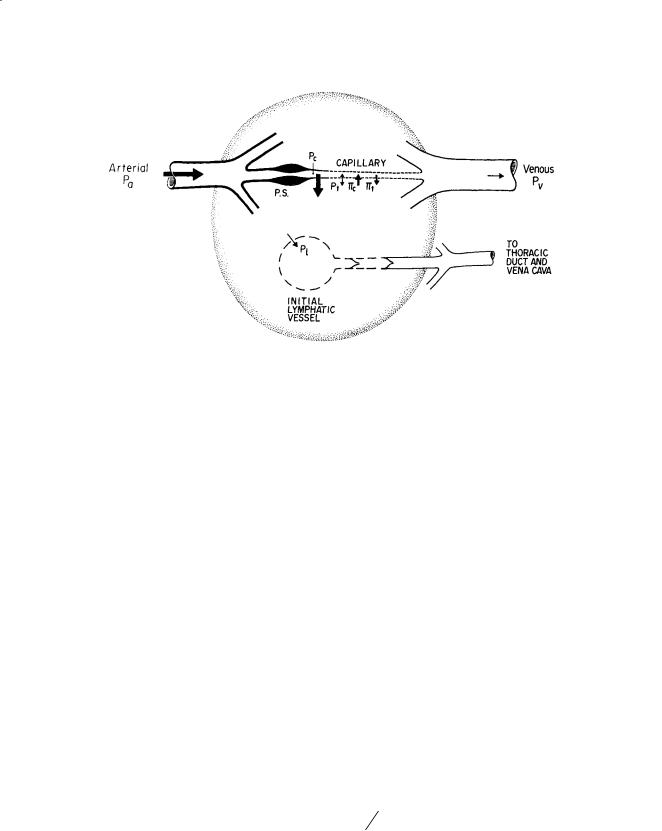
Hydrostatic and colloid osmotic pressures within the blood and interstitial fluid primarily govern transcapillary fluid shifts (Fig. 17.1). Although input arterial pressure averages about 100 mmHg at heart level, capillary blood pressure Pc is significantly reduced due to resistance R, according to the Poiseuille equation (Eq. 17.4):
= 8ηl
R (17.4)
πr 4
where: η = blood viscosity
l = vessel length between feed artery and capillary r = radius
Therefore, normally at heart level, Pc is approximately 30 mmHg. However, during upright posture, Pc at foot level is about 90 mmHg and only about 25 mmHg at head level [Parazynski et al., 1991]. Differences in Pc between capillaries of the head and feet are due to gravitational components of blood pressure according to ρgh. For this reason, volumes of transcapillary filtration and lymph flows are generally higher in tissues of the lower body as compared to those of the upper body. Moreover, one might expect much more sparse distribution of lymphatic vessels in upper body tissues. In fact, tissues of the lower body of humans and other tall animals have efficient skeletal muscle pumps, prominent
Mechanics of Tissue and Lymphatic Transport |
249 |
FIGURE 17.1 Starling pressures which regulate transcapillary fluid balance. Pressure parameters which determine direction and magnitude of transcapillary exchange include capillary blood pressure Pc, interstitial fluid pressure Pt (directed into capillary when positive or directed into tissue when negative), plasma colloidal osmotic pressure πc, and interstitial fluid colloidal osmotic pressure πt. Precapillary sphincters (PS) regulate Pc, capillary flow, and capillary surface area A. It is generally agreed that a hydrostatic pressure gradient (Pt > lymph pressure Pl) drains off excess interstitial fluid under conditions of net filtration. Relative magnitudes of pressures are depicted by the size of arrows. (Source: Hargens AR. 1986. Interstitial fluid pressure and lymph flow. In: R Skalak, S Chien (Eds.), Handbook of Bioengineering, Vol. 19, pp. 1–35. New York, McGraw-Hill. With permission.)
lymphatic systems, and noncompliant skin and fascial boundaries to prevent dependent edema [Hargens et al., 1987].
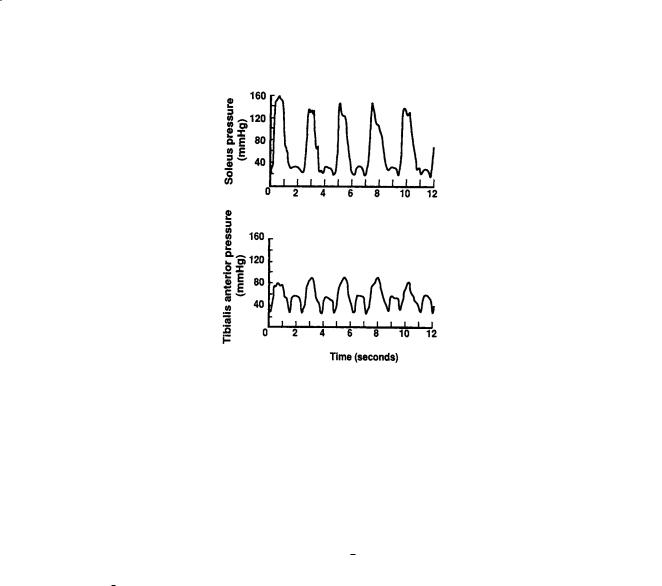
Other pressure parameters in the Starling–Landis Eq. (17.1) such as Pt , πc, and πt are not as sensitive to changes in body posture as is Pc. Typical values for Pt range from –2 mmHg to 10 mmHg depending on the tissue or organ under investigation [Wiig, 1990]. However, during movement, Pt in skeletal muscle increases to 150 mmHg or higher [Murthy et al., 1994], providing a mechanism to promote lymphatic flow and venous return via the skeletal pump (Fig. 17.2). Blood colloid osmotic pressure πc usually ranges between 25 and 35 mmHg and is the other major force for retaining plasma within the vascular system and preventing edema. Interstitial πt depends on the reflection coefficient of the capillary wall (σp ranges from 0.5 to 0.9 for different tissues) as well as washout of interstitial proteins during high filtration rates [Aukland and Reed, 1993]. Typically πt ranges between 8 and 15 mmHg with higher values in upper body tissues compared to those in the lower body [Aukland and Reed, 1993; Parazynski et al., 1991]. Precapillary sphincter activity (Fig. 17.1) also decreases blood flow, decreases capillary filtration area A, and reduces Pc in dependent tissues of the body to help prevent edema during upright posture [Aratow et al., 1991].
Interstitial Flow and Lymph Formation
As stated in the Introduction, many previous investigators were convinced that interstitial flow of proteins was limited by simple diffusion according to Fick’s equation (Eq. 17.5):
|
J |
p |
= −D ∂cp |
∂x |
(17.5) |
|
|
|
|
||
where: Jp |
= one dimensional protein flux |
|
|
|
|
D |
= diffusion coefficient |
|
|
|
|
∂cp/∂x |
= concentration gradient of protein through interstitium |
|
|||
250 |
Biomechanics: Principles and Applications |
FIGURE 17.2 Simultaneous intramuscular pressure oscillations in the soleus (top panel) and the tibialis anterior (bottom panel) muscles during plantarand dorsiflexion exercise. Soleus muscle is an integral part of the calf muscle pump. (Source: Murthy G, DE Watenpaugh, RE Ballard, et al., 1994. Supine exercise during lower body negative pressure effectively simulates upright exercise in normal gravity. J. Appl. Physiol. 76:2742. Modified with permission.)
However, recent experimental and theoretical understandings of the dependence of volume and solute flows on hydrostatic and osmotic pressures [Hammel, 1994; Hargens and Akeson, 1986] strongly suggest that convective flow plays an important role in interstitial flow and tissue nutrition. For example, in the presence of osmotic or hydrostatic pressure gradients, protein transport Jp is coupled to fluid transport according to Eq. (17.6):
Jp = c |
p Jv |
(17.6) |
where: cp = average protein concentration Jv = volume flow of fluid
Most investigators note that lymph formation and flow greatly depend upon tissue movement or activity related to muscle contraction. It is also generally agreed that formation of initial lymph depends solely on the composition of nearby interstitial fluid and pressure gradients across the interstitial–lymphatic boundary [Hargens, 1986; Zweifach and Lipowsky, 1984]. For this reason, lymph formation and flow can be quantified by measuring disappearance of isotope-labeled albumin from subcutis or skeletal muscle [Reed et al., 1985].
Lymphatic Architecture
To understand lymph transport in engineering terms it is paramount that we develop a detailed picture of the lymphatic network topology and vessel morphology. This task is facilitated by a number of morphological and ultrastructural studies from past decades which give a general picture of the morphology and location of lymphatic vessels in different tissues. Lymphatics have been studied by injections of macroscopic and microscopic contrast media and by light and electron microscopic sections. The display of the lymphatics is organ specific; there are many variations in lymphatic architecture [SchmidSchönbein, 1990]. We will focus this discussion predominantly on skeletal muscle, the intestines, and skin. But, the mechanisms may also, in part, be relevant with respect to other organs.

Mechanics of Tissue and Lymphatic Transport |
251 |
FIGURE 17.3 Tracing of a typical lymphatic channel (bottom panel) in rat spinotrapezius muscle after injection with a micropipette of a carbon contrast suspension. All lymphatics are of the initial type and are closely associated with the arcade arterioles. Few lymphatics follow the path of the arcade venules, or their side branches, the collecting venules or the transverse arterioles. [Skalak et al., 1986.]
In skeletal muscle, lymphatics are positioned in immediate proximity of the arterioles [Skalak et al., 1984]. The majority of feeder arteries in skeletal muscle and most, but not all of the arcade arterioles, are closely accompanied by a lymphatic vessel (Fig. 17.3). Lymphatics can be traced along the entire length of the arcade arterioles, but they can be traced only over relatively short distances (less than 50 µm) into the side branches of the arcades, the transverse (terminal) arterioles which supply the blood into the capillary network. Systematic reconstructions of the lymphatics in skeletal muscle have yielded little evidence for lymphatic channels that enter into the capillary network per se [Skalak et al., 1984]. Thus, the network density of lymphatics is quite low compared to the high density of the capillary network in the same tissue, a characteristic feature of lymphatics in most organs [Skalak et al., 1986]. The close association between lymphatics and the vasculature is also present in the skin [Ikomi and SchmidSchönbein, 1995], and in other organs and may extend into the central vasculature.
Lymphatic Morphology
Histological sections of the lymphatics permit the classification into distinctly different subsets, initial lymphatics and collecting lymphatics. The initial lymphatics (denoted also as terminal or capillary lymphatics) form a set of blind endings in the tissue, which feed into the collecting lymphatics, and which in turn are the conduits into the lymph nodes. While both initial and collecting lymphatics are lined by a highly attenuated endothelium, only the collecting lymphatics have a smooth muscle in their media. In accordance, collecting lymphatics exhibit spontaneous narrowing of their lumen, while there is no evidence for contractility in the initial lymphatics. Contractile lymphatics are capable of peristaltic smooth muscle contractions, which in conjunction with periodic opening and closing of the intraluminal valves permits unidirectional fluid transport. The lymphatic smooth muscle has an adrenergic innervation [Ohhashi et al., 1982], exhibits myogenic contraction [Hargens and Zweifach, 1977; Mizuno et al., 1997], and reacts