Global corporate finance - Kim
.pdf412 |
INTERNATIONAL PORTFOLIO INVESTMENT |
|
|
|
||
|
|
|
|
|||
|
Table 16.4 Dollar-adjusted rates of return and standard deviations |
|
||||
|
|
|
|
|
|
|
|
|
|
Bonds |
|
|
Stocks |
|
|
|
|
|
|
|
|
Country |
Mean |
Standard deviation |
|
Mean |
Standard deviation |
|
|
|
|
|
|
|
|
Belgium |
8.11% |
9.66% |
10.14% |
14.19% |
|
|
Denmark |
6.99% |
13.14% |
11.37% |
24.83% |
|
|
France |
5.99% |
12.62% |
8.13% |
21.96% |
|
|
Germany |
10.64% |
9.45% |
10.10% |
20.34% |
|
|
Italy |
3.39% |
13.73% |
5.60% |
27.89% |
|
|
The Netherlands |
7.90% |
8.28% |
10.68% |
18.24% |
|
|
Spain |
5.17% |
11.52% |
10.35% |
20.33% |
|
|
Sweden |
6.41% |
6.06% |
9.70% |
17.09% |
|
|
Switzerland |
9.11% |
12.68% |
12.50% |
23.48% |
|
|
UK |
6.81% |
15.30% |
14.67% |
34.40% |
|
|
Japan |
11.19% |
12.21% |
19.03% |
32.20% |
|
|
Canada |
3.52% |
6.44% |
12.10% |
17.89% |
|
|
USA |
4.31% |
5.53% |
10.23% |
18.12% |
|
|
|
|
|
|
|
|
Source: H. Levy and Z. Lerman, “The Benefits of International Diversification in Bonds,” Financial Analysts Journal, Sept./Oct. 1988, p. 57.
US bonds had a risk level of 5.53 percent and a mean return level of 4.31 percent. At about the same level of risk, the optimal international portfolio of bonds earned a mean return of about 8.5 percent – about twice the US-only portfolio’s return. This was achieved by investing in a portfolio of German, Swedish, and Japanese bonds with small amounts in US and Spanish bonds.
Investment in US stocks is also inefficient because, according to figure 16.7, its risk–return combination is to the right of the efficient frontier. The performance of the international stock portfolio, M(s), was better than that of US stocks. Point M(s) had a standard deviation of 14.84 percent and a mean return of 15 percent. Compare this to the US stocks, whose standard deviation was 18.12 percent and whose mean rate of return was 10.23 percent. Consequently, US investors could have earned more from international stock portfolios than from US stock portfolios, and at a lower risk level. This was achieved by investing in a portfolio of German, Spanish, Japanese, and Canadian stocks with small amounts of Belgian and British stocks.
Figure 16.7 shows that the bond portfolios definitely outperformed the stock portfolios. At every level of mean return up to 11 percent, the bond portfolios had a lower risk level than corresponding stock portfolios. However, the efficient bond frontier stops at a mean return level of about 11 percent, while the efficient stock frontier extends up to a mean return level of about 19 percent. The upper bound represents investment in Japanese stocks, which had the highest risk and return among all stocks. The higher range of risk–return combinations was not attainable with bond portfolios. Still, the stock portfolios played an efficient role on their own because of their upper bound.
As given in figure 16.7, the efficient frontier of stocks and bonds combined dominated its counterpart of either stocks by themselves or bonds by themselves. This means that international portfolios of stocks and bonds outperformed both stock portfolios and bond portfolios. The optimal international portfolio of stocks and bonds is obtained at point M(bs), where the efficient frontier of stocks and bonds and the security market line intersect with each other.


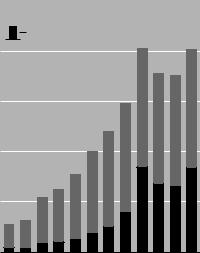

 Total investment in ordinary shares ADRS
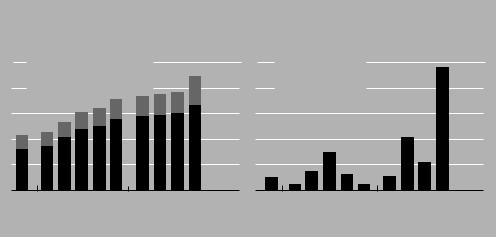
416 |
INTERNATIONAL PORTFOLIO INVESTMENT |
|
|
|
|||
|
|
|
|
|
|
|
|
|
The Money Pours In |
|
|
|
|
||
|
A look at the growing number of hedge funds and the amount of money invested; all figures are estimates |
||||||
|
|
Number of funds |
7,500 |
|
|
$75 |
|
|
|
Net new assets |
|
||||
|
|
|
Funds of funds |
|
|||
|
|
|
6,000 |
invested in hedge |
|
60 |
|
|
|
|
Single-manager funds |
|
|||
|
|
|
funds, in billions |
|
|||
|
|
|
|
|
|
|
|
|
|
4,500 |
|
|
45 |
|
|
3,000 |
|
|
30 |
|
|
1,500 |
|
|
15 |
|
|
0 |
|
|
0 |
1994 |
19951996199719981999 |
2000 2001 2002 2003 |
1994 |
19951996199719981999 |
2000 2001 2002 2003 |
Source: TASS Research
Figure 16.9 Hedge funds: the number of funds and the net new assets
Source: The Wall Street Journal, July 11, 2004, p. C1.
tions, or bets that prices will fall, to offset their securities holdings. Some bet on cross-border mergers and acquisitions, convertible securities, or foreign currencies. They frequently use borrowed money in an effort to boost returns. Hedge funds have grown in popularity in recent years, both because of their oversized returns and their aura of exclusivity.
Figure 16.9 shows that the number of hedge funds operating worldwide by the end of 2003 had reached 6,500, with just under $75 billion in net new assets invested in hedge funds during the year. Most hedge funds are small, with less than $100 million in invested capital. A few dozen hedge funds have a capital base larger than $1 billion. Most of these funds were reported as being based in the USA.
According to Tremont Capital’s TASS Research hedge-fund tracking division, $72.2 billion gushed into hedge funds in 2003, more than twice that in the next highest year. The trend has continued in 2004 and TASS estimated that there were 7,700 funds as of July 2004, with $800 billion in assets under management.
Hedge funds have recently become the target of frequent criticism in the financial press, because of the lucrative compensation packages paid to management, the fact that they are unregulated, and the huge speculative positions taken by some hedge funds (see Global Finance in Action 16.1). For these reasons, experts suggest that an investor should ask the following questions before putting money into a hedge fund: First, how does the investment strategy work? Second, what are the risks? Third, what market conditions favor the manager’s strategy – and which ones work against it? Fourth, what is the manager’s experience and track record? Fifth, how long do I have to wait before I can withdraw my money? Sixth, how are the manager and the consultant helping select the hedge fund compensated?


418 INTERNATIONAL PORTFOLIO INVESTMENT
16.3.5Investment in US multinational companies
It used to be the case that if you wanted to invest globally, you bought foreign stocks. But the recent wave of cross-border mergers and acquisitions along with accelerated globalization by US companies have turned many US shareholders into global investors, whether they like it or not. Thus, investors may choose securities of US-based multinational companies (MNCs) for their international portfolio diversification. An MNC represents a portfolio of international operations, thus its performance is somewhat insulated from US market downturns. An MNC can reduce risk by diversifying sales not only among industries, but also among countries. This means that the MNC as a single firm can achieve stability similar to that of an internationally diversified portfolio.
16.3.6Global investing
Empirical studies conclude that international diversification pushes out the efficient frontier, thus allowing investors simultaneously to reduce risk and increase return. This benefit exists for a number of reasons. First, more profitable investments are possible in an enlarged universe, because faster-growing economies create higher returns or investors may see another advantage from currency gains. Second, the advantages of international diversification may occur because companies in different countries are subject to divergent cyclical economic fluctuations.
The US portion of total world capital markets has dropped from 70 percent in 1980 to 45 percent in 2000. During that same period, nondollar stock markets frequently outperformed their US counterparts. Yet the average American investor has less than 10 percent of his or her portfolio invested in international securities. Some stockbrokers, such as Launny Steffens, Executive Vice President of Merrill Lynch, think that investors would be better off patterning their asset allocations much more closely to total world capitalizations. Of course, opportunity varies region by region, country by country. And some regions and countries come with greater risk – liquidity, political, or currency risk.
The manager of a US stock fund has just one way to beat the competition, by making better stock picks. But an international stock fund manager has three different ways to add value: by picking countries, by picking currencies, and by picking stocks.
How can US investors best select a global fund? Some helpful hints may cut down on the potential for loss (Clements 1992). They are: (1) stick with large players in the global market;
(2) combine funds to minimize the effect of the failure of one fund on the total portfolio; (3) select regional rather than totally global funds; (4) consider combining regional funds with stock or bond index funds; and (5) try publicly traded funds. These suggestions will not assure success, but can reduce the likelihood of failure.

QUESTIONS 419
SUMMARY
Political and economic events in the 1980s and the 1990s underscored the growing importance of free flows of finance, trade, and investment among countries. These changes, along with an improved ability to collect and analyze data, give us low-cost information about foreign securities. As a result, investors are realizing substantial benefits from international investment. In this chapter, we saw that international stock and bond diversification can yield higher returns with less risk than investment in a single market.
In the past 20 years or so, researchers have convincingly argued, in terms of the mean-variance model, the case for international portfolio investments, as opposed to purely domestic diversification. A major reason for such a case is that international investment offers a broader range of opportunities than domestic investment even in a market as large as the USA or Europe. Studies have stressed the following two points: (1) adding foreign securities to a purely domestic portfolio reduces the total risk of the portfolio because of a low correlation between foreign securities and the domestic market; and (2) in the past, international portfolios could have yielded both a higher return and a lower volatility than purely domestic portfolios.
Even though investors are increasingly interested in foreign securities, investment in foreign securities represents a small portion of their total investment in stocks and bonds. Most commonly expressed barriers to international investment include: (1) excessive information and transaction costs; (2) double taxation of foreign investment profits; (3) foreign-exchange regulations and currency risk; (4) greater rate-of-return volatility; (5) unfamiliarity with operating procedures of foreign stock exchanges; (6) unavailability of high-quality financial data for foreign companies; and (7) significant delays of transactions and settlements associated with foreign securities.
Questions
1Discuss both unsystematic risk and systematic risk within an international context.
2What is the market portfolio? Why is the market portfolio important?
3Many studies have found that intercountry correlations tend to be substantially lower than intracountry correlations. Explain some reasons for this fact. What significance does this finding have for international investment?
4Describe the efficient portfolio, the efficient frontier, and the optimum portfolio.
5Is the standard deviation of bond returns in any particular market typically higher or lower than the standard deviation of stock returns in that market? Does this information make any difference for investors?
6Is it possible for an international portfolio to reduce the domestic systematic risk?
7Describe American depository receipts and global depository receipts.
8What are the different methods of international diversification?

420 INTERNATIONAL PORTFOLIO INVESTMENT
Problems
1The expected rate of return on the market portfolio is 20 percent. The riskless rate of interest is 10 percent. The beta of a multinational company is 0.5. What is the cost of this company’s common equity?
2At present, the riskless rate of return is 10 percent and the expected rate of return on the market portfolio is 15 percent. The expected returns for five stocks are listed below, together with their expected betas.
Stock |
Expected return |
Expected beta |
|
|
|
A |
0.22 |
1.5 |
B |
0.30 |
1.3 |
C |
0.12 |
0.8 |
D |
0.15 |
0.7 |
E |
0.14 |
1.1 |
|
|
|
On the basis of these expectations, which stocks are overvalued? Which stocks are undervalued?
3The prices of a common stock were $40, $50, and $60 for the last 3 days. Compute the average stock price and the standard deviation.
4A portfolio manager wishes to invest a total of $10 million in US and British portfolios. The expected returns are 15 percent on the US portfolio and 12 percent on the British portfolio. The standard deviations are 10 percent for the US portfolio and 9 percent for the British portfolio. Their correlation coefficient is 0.33. What is the expected return and standard deviation of an international portfolio with 25 percent invested in the US portfolio and 75 percent in the British portfolio?
5An international portfolio with a total investment of $10 million consists of a US portfolio and a foreign portfolio. The US portfolio requires an investment of $5 million and the foreign portfolio requires an investment of $5 million. The standard deviations are 4 percent for the US portfolio and 4 percent for the foreign portfolio.
(a)If these two portfolios are perfectly positively correlated, what is the standard deviation of the international portfolio?
(b)If the two portfolios have a correlation coefficient of 0.2, what is the standard deviation of the international portfolio?
(c)If the two portfolios are perfectly negatively correlated, what is the standard deviation of the international portfolio?